SLC S21W5 : Advanced Strategies Using On-Chain Data and Sentiment Indicators
Greetings my fellow traders,
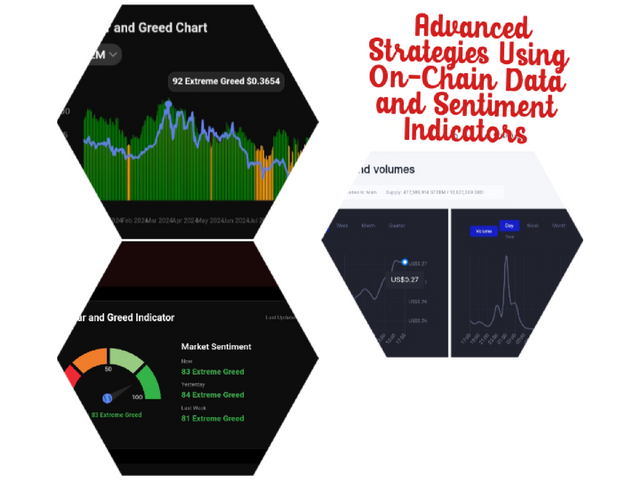
It's the fifth week of the Steemit Learning Challenge for season 21 and I'm delighted to join this week's competition which is titled Advanced Strategies Using On-Chain Data and Sentiment Indicators. I will be attempting the questions given below as part of my entry for the contest.
| Question 1: Understanding On-Chain Data Metrics |
|---|
Explain the importance of on-chain data metrics like wallet activity, exchange inflows/outflows, and token holding distribution. How can these metrics indicate market sentiment during a bull run?
The importance of of on-chain data matrics like the wallet activity, exchange inflows/outflows, and token holding distribution in the indication of market sentiment during a bull run can never be overemphasized and the reason is because they provide insights into the transaction that goes on in the blockchain.
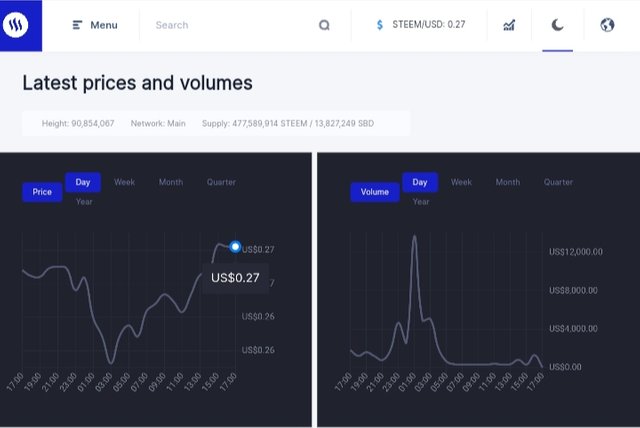
With the help of these matrices, market sentiment as well as the trend of the market are easily identified during the bull run. For better understanding let's look at details on how this matrices indicate market sentiment and how important they are.
Wallet Activity: As the name suggests, wallet activities, this matrices tracks the number of wallets that interact with the blockchain within a specific period. Now let's look at its importance.
Importance of Wallet Activity
The basic notable importance of the wallet activity which we will be discussing in summary include user adoption, transaction trend and network engagement.
User Adoption: When there is a massive increase in active wallets it means that there is more user adoption of the wallet which is a sign of positive sentiment meaning users are making use of the wallet more and putting interest there by pushes price up indicating bull run.
Transaction Trends: When there is much transaction of the said token that is inflow and outflow, it means that people are interested in the token.
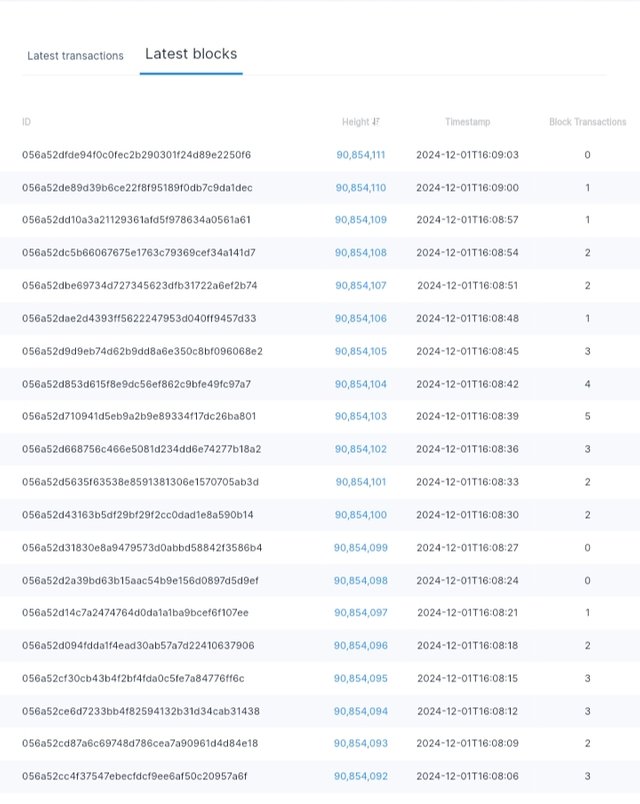
Network Engagement: Wallets whose owners interact fully with with the ecosystem instead of just storing token is another importance of the wallet activity. Staking and others are ways of engaging with the ecosystem.
Importance of wallet activity During a Bull Run
Surge in Activity: One of the reason for the significant rise of active wallets during the bull run is fear of missing out. This means that participant enter the market to leverage the rising price of the token.
Sustainability Check: When we see a steady increase in wallet activity within the ecosystem, it means there is growth and the token involve will also rise because of the activities going on with it.
Exchange Inflows and Outflows: The essence of this matrices is to track the movement of assets which happens between the personal wallets and centralized exchanges. The movement of Steem for instance from our wallets on Steemit to the different exchanges we sell them to Fiat.
Importance Exchange Inflows and Outflows
Liquidity and Selling Pressure: When token moves to an exchange from our personal wallets is called inflow as it implies we have an intention to sell and this lead to selling pressure. Similarly, token withdrawn from exchange to personal wallet is outflow which means intention to hold and that reduces selling pressure.
Market Behavior: Inflow or outflow here determine if the market behaviour. With the inflow and outflow, we have the phases of the market to be accumulation and distribution there by influencing the price of the asset.
Importance of Exchange Inflows and Outflows During a Bull Run
Decline in Exchange Balances: When we see participant withdrawing their token to their personal wallet to hold it implies confidence in the said token which pushes the price up during a bull market.
Spike in Inflows: Withdrawing the asset to exchange means we have intention to sell and that may pull back the price of the asset or stop it's upward movement.
Token Holding Distribution: This matrices talks about how assets are distributed in the wallets. We have whales, retail investors wallets so the distribution of the assets via their different wallets differs and that is what this matrices is all about.
Importance Token Holding Distribution
Market Power: Here it talks about the wallets own by whales and those own by retail investors. The power to move the price depends on inflow by whales wallet.
Decentralization: Having many wallets holding the assets shows that power to shift the market is not centered and that gives confidence to investors.
Behavioral Insights: When there is a little change in the holding i.e., inflow from whales we may see a price shift.
Importance of Token Holding Distribution During a Bull Run
Whale Accumulation: When whales are accumulating, it is a sign that there is much confidence in the asset and that can fuel the price of the asset pushing it upward.
Retail Participation: Retail investors are always driven by FOMO which in most cases leads them to buy the asset and hold thereby pushing the price of the asset upward.
Profit-Taking by Whales: When whales have pushed price to a certain level they go ahead to take profit and then come back to the market thereafter.
How These Metrics Indicate Market Sentiment During a Bull Run
There are three main ways which these metrics indicates market sentiment during a bull run and these 3 ways are seen below.
Bullish Sentiment Indicators: When the wallet activity increases it implies more interest and demand. Also, when we see lots of outflows i.e., money sent from exchange to our personal wallets we know that it is a face of accumulation or holding of the asset for a longer time, this helps to give others confidents about the asset and it keeps pushing price upward.
Bearish or Neutral Signals: When we see an inflows i.e., sending asset from personal wallets to exchange, it is a clear indication that there will be a selling pressure and that will push the price down. So when the activity of the wallet also reduce it implies loss of confident or selling pressure setting in.
Timing and Transitions: When we see that the wallet activity is increasing through outflows it implies that the market is going to be bullish but when we see inflows we know that the market will be bearish.
| Question 2: Using Sentiment Indicators to Analyze Market Trends |
|---|
Discuss how sentiment indicators, such as the Fear & Greed Index or social media sentiment, provide insights into bullish or bearish market conditions. Provide examples of how these indicators have historically predicted reversals.
The sentiment indicators, such as the Fear & Greed Index or social media sentiment, provide insights into bullish or bearish market conditions as they analyses the emotion states of the market. This means that they can tell you if the market will be Bullish, bearish or even reverse based on how optimistic or pessimistic investors are. Now let's look at the Fear & Greed Index indicator provide insights into bullish or bearish market conditions.
Fear & Greed Index: This indicator is scaled 0 (extreme fear) to 100 (extreme greed) and it combines many data points which is used to measure the overall sentiment of the market. Lets consider the Insights into Market Conditions (extreme greed and extreme fear) scale mentioned above.
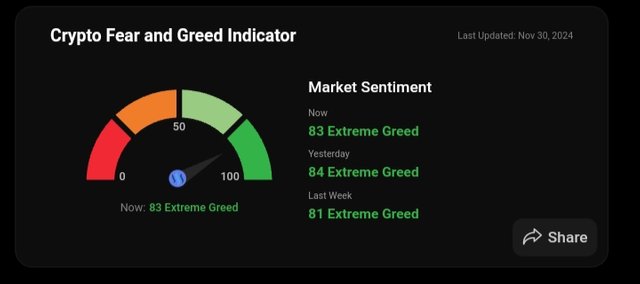
Insights into Market Conditions: The Insights into Market Conditions are basically Bullish Sentiment (Extreme Greed) and the Bearish Sentiment (Extreme Fear). For a better understanding let's discuss them one after the other.
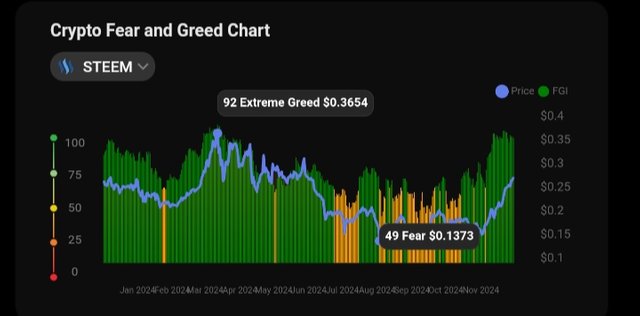
Bullish Sentiment (Extreme Greed): The higher the index, the more the price rises but extreme greed may lead to price reversal to the opposite direction.
Bearish Sentiment (Extreme Fear): The lower the index the more the price decreases and extreme fear can lead to undervaluation and that can push price down to liquidation.
Historical Examples Using the Fear & Greed Index
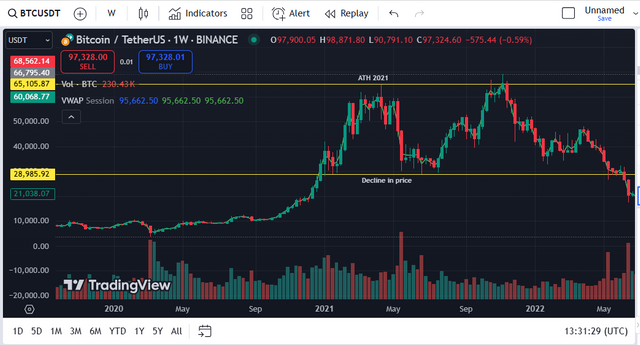
Lets consider the chart of BTCUSDT in 2021. Now in this very year around February - March we saw the price of Bitcoin moving to about $60,000 which is it's ATH at then.
With this price, we saw the Fear & Greed Index setting in, in this case extreme greed which shows overconfident with such high, we saw a quick corrections around May that same year which brought the price back to around 32,000.
Social Media Sentiment Analysis: Social media is a powerful tools hence to determine market sentiment most times we try to track investors conversation via either Twitter, Reddit and other platforms. The essence is to know there taught about the market.
Insights into Market Conditions: The Insights into Market Conditions are basically Bullish Sentiment and the Bearish Sentiment. For a better understanding let's discuss them one after the other.
Bullish Sentiment: When there is much community engagement hype on social media about the asset then we see it rising because it is an expected good news. The winning of Donald Trump is a good example as he promised to support cryptocurrency.
Bearish Sentiment: When there is a compliant or issues with the asset and the integrity is dragged to social media then we see price decline as confidence will be lost.
Historical Examples Using the Social Media Sentiment Analysis
In 2018, we saw the price of Bitcoin dropped from $20,000 to below $4,000 because of the sentiment which was going on on social media. A lot of people then we're fighting against cryptocurrency and the news that it is not accepted for many things brought the price down so much.
Predicting Reversals with Sentiment Indicators
One of the ways which the sentiment indicators predicts reversal is through the extreme. When we have extreme greed, it means that market went high and it will get to certain level where it won't go any higher hence a decline will be seen in the price at that point.
Extreme fear on the other hand shows that the market has been oversold and that present opportunity for investors to buy the deep and through that process we see price rising again because a buying pressure is seen.
Limitations of Sentiment Indicators
Provision of false signal: When we have extreme greed or extreme fear, this doesn't guarantee market reversal to the opposite direction at all times as there are periods where the market will remain on that state for a longer period.
Lagging Nature: Since the sentiment indicators always gives an immediate reaction in some cases to price, we may not be able to correctly predict the price movement as any news that comes up may change the movement.
Speculative Volatility: Due to volatility in the market, sentiment can change rapidly inflicting the market movement which we have already earlier analysed.
| Question 3: Integrating On-Chain Data with Sentiment Indicators |
|---|
Describe how on-chain data and sentiment indicators complement each other to provide a holistic view of market sentiment. Use examples from Steem/USDT to illustrate their combined application.
The combination of the on-chain data and the market sentiment indicators helps to provide for traders quantitative and qualitative analysis of market sentiment. As you already know, the on-chain data has to do with the blockchain based activity whereas market sentiment has to do with emotions or opinions of those participating in the market activities. So let's look at details on how on-chain data and the market sentiment indicators complement each other.
How On-Chain Data and Sentiment Indicators Complement Each Other
On-Chain Data: The on-chain data as earlier discussed focuses on data from the activity within the ecosystem. Things like wallet activity, exchange inflows/outflows, token distribution, transaction volume and many more are the things that we see with the on-chain data.
Sentiment Indicators: Here the emotion of the participants, social media trend which has to do with fear and greed index etc are what are majorly taken into consideration here.
Combined Approach (On-Chain Data & Sentiment Indicators):
The On-chain data talks about the user behaviour which centered on the interaction of the activity within the wallet and exchange. This include the accumulation and distribution phases which we have earlier explained.
In the case of the sentiment indicators we are looking at the psychology which lead to the accumulation and distribution which we talked about above. These is always controlled by fear and greed.
When you combined both of them, you will notice that for accumulation or distribution to be seen there must be fear or greed of selling off or holding for a long term.
Application to Steem/USDT
Market Sentiment During a Bull Run in STEEM/USDT
Let's look one after the other on On-Chain Data Insights, Sentiment Indicators and then have a combination of both.
On-Chain Data Insights: For wallets activity, when we see an increase in active wallets it implies that there is interest in Steem. When we also notice outflow of the Steem token from exchange to Steemit wallet it is also a sign of confident and more holding. If more whales hold Steem it means more confident and that will drive the price upward.
Sentiment Indicators: When you see tweets or news talking about how good Steem is then it can push the price upward. Also, if we noticed that there is extreme greed in the market it implies that people are still buying and holding pushing price upward.
Combined Analysis: Based on the above, the on-chain data shows that Steem is withdraw from exchange to Steemit wallet and also the social media sentiment shows how good it is to invest on Steem.
Seeing that both the on-chain data and the social media sentiment are all positive about Steem, it shows the bullish momentum of Steem hence traders here will hold but remain cautious because there are possibilities of reversal.
Market Reversal in STEEM/USDT
Let's look one after the other on On-Chain Data Insights, Sentiment Indicators and then have a combination of both.
On-Chain Data Insights: When we notice inflow i.e., transfer of Steem from Steemit wallet to exchange, it means there will be a massive sell. Also if the activity within the wallet reduces it implies that traders are losing interest on the token. Lastly, when the whales instead of accumulating they are distributing i.e., selling and booking profits. This implies that price will decline.
Sentiment Indicators: When there is any negative news on social media about the Steem token or if the word Steem is not mentioned regularly on social media like as it was mentioned before. It means people are losing interest also if there is a shift from greed to fear we see a serious decline because confident on the Steem token has disappeared.
Combined Analysis: The on-chain data as we can see from above shows Steem being moved from wallet to exchange implying selling pressure and the market sentiment on the other hand shows that interest on holding the asset is no more which is the psychology of traders and that leads to Bearish market.
Having these scenario as a trader, what you should do immediately is to expect a bearish reversal if the market was initially moving in an upward direction.
Benefits of Combining On-Chain Data and Sentiment Indicators
One of the main benefits associated with combining the On-Chain Data and Sentiment Indicators is that you can be able to predict the market reversal since both are given same information implying same thing.
Another benefits of combining On-Chain Data and Sentiment Indicators is that a validation or confirmation is easily done. If both are saying same thing that means the information provided has been validated.
Limitations
Social media sentiment indicators can switch the market at any point and time based on the information which we see on the social media. Also the on-chain data can also lag behind in providing information about the inflow and outflow.
So far, these two factors are concern, technical analysis most times will seem invalid because market change change at any point and time because of the social media sentiment.
| Question 4: Developing a Sentiment-Based Trading Strategy |
|---|
Create a sentiment-based trading strategy for Steem, incorporating both on-chain data and sentiment indicators. Outline entry, exit, and risk management criteria tailored to bullish and bearish sentiment phases.
Here I will create a sentiment-based trading strategy for Steem and I will do that for the bullish and the bearish sentiment phase. So let's look at them one after the other.
Bullish Sentiment Phase Strategy Overview
Below is the sentiment-based trading strategy for Steem bullish market.
Entry Criteria: Here you must look for a strong bullish momentum using the on-chain data and sentiment.
For on-chain data, be sure to see an increase activity within the wallets for atleast 7 days. Also check to see the amount of outflows that is the amount of Steem that came from exchange to the Steemit wallet. Lastly check to be sure that the Wales are holding assets (accumulation).
For sentiment, ensure to check that there have been a positive talk and mention of Steem on social media in the past few days also be sure that the fear and greed index is between 60-80 which means not extreme greed meaning market can push more up to 100.
Exit Criteria: Here you must protect your profits using either the trailing stop or being actively following the market News and others. So let's see how to use the on-chain data and sentiment to do so.
For on-chain, if you notice movement of assets from Steemit wallet to exchange it means whales are selling so it is time to take profit and exit or when whales stop holding asset.
For sentiment, once the fear and greed index move above 80, it implies that it is moving towards extreme greed hence you are advice to exit or when we see negative talks about the asset on social media.
Bearish Sentiment Phase Strategy Overview
Below is the sentiment-based trading strategy for Steem bearish market.
Entry Criteria: Here you must look for a strong bearish momentum using the on-chain data and sentiment.
For on-chain data, be sure to see an decrease activity within the wallets for atleast 7 days. Also check to see the amount of inflows that is the amount of Steem that goes from Steemit wallet to an exchange. Lastly check to be sure that the Wales are selling off assets (distribution).
For sentiment, ensure to check that there have been a negative talk and less mention of Steem on social media in the past few days also be sure that the fear and greed index is below 30 which means it is moving towards extreme fear.
Exit Criteria: Here you must protect your profits using either the trailing stop or being actively following the market News and others. So let's see how to use the on-chain data and sentiment to do so.
For on-chain, if you notice movement of assets from exchange to the Steemit wallet it means whales have started accumulating again. So since they are sending back to Steemit exchange the selling pressure will reduce.
For sentiment, once the fear and greed index move from around 30-50 this is fear to neutral it means that the there trend is changing and you need to exit the market. If there are also positive news on social media you should also exit the trade.
Risk Management: This risk management works for both the bullish and the bearish strategy and that is why I'm discussing it below.
Position Sizing: Ensure that the percentage of your asset you will use to enter the market will be based on the strength of the sentiment and you on-chain data.
Stop-Loss Placement: To protect your account properly always place a stop loss 5-10% below your entry point for bullish market and above your entry point for bearish market.
Take-Profit Targets: Make use of the trailing stop so as to maximise the amount of profit to obtain during the trade as asset always reach extreme greed and extreme fear level. So profit made can be locked.
Diversification: Ensure not to gather all eggs in one basket. So diversify your asset and don't put all your money on just Steem token.
Example Applications
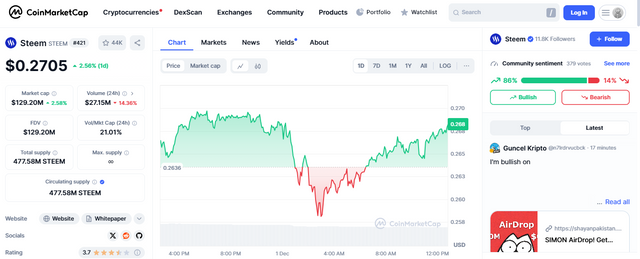
Bullish Sentiment Trade: From the data gather in the coinmarketcap where I checked the inflows and outflows of the Steem token as seen below.
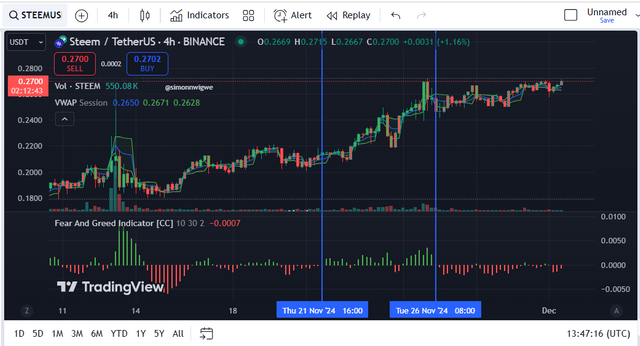
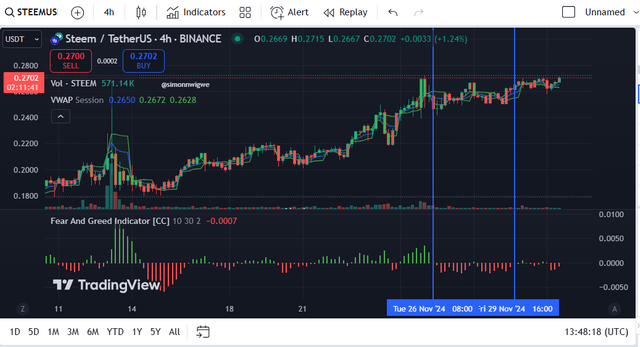
Also from the market sentiment where 80%+ people voted Steem Bullish and also seeing from my technical analysis that the fear and greed index was around 60+ it is best to enter the market at this price.
Enter the market at the current price
Exit market when fear and greed index exceed 80
Stop loss will be 10% below entry point.
Bearish Sentiment Trade: Wallet activity reduced here as we see sell by whales and from the chart below we see the fear and greed index at around 25. This may be as a result of news from social media.
Entry short position for Steem at current price.
Exit when wallet activities increase or when the fear and greed index move to 30.
Stop loss should be 10% above entry.
| Question 5: Limitations and Best Practices in Sentiment Analysis |
|---|
Discuss the challenges and limitations of market sentiment analysis, such as delayed reactions or misleading signals. Provide tips for improving the reliability of sentiment-based trading strategies.
Challenges and Limitations of Market Sentiment Analysis
Delayed Reactions: One of the major limitation of this analysis is that it lags behind price. Most times before it will be noticed the price of the asset may have already shifted.
Noise in Data: There tendencies that these indicators come with noise of fake signal as they don't react on time and they may bring some fake signal when they finally come up.
FOMO: Sentiment indicators leaders traders to FOMO as people are always scared of being left out of the trend and maybe when they are joining the trend may have already gone.
Overemphasis on Sentiment: When you focus only on sentiment indicators and ignoring technical and fundamental analysis then you may be trapped in the market as it may not give accuracy.
Manipulation of Sentiment: Social media can be manipulated by hackers which may lead to spraying for information.
Tips for Improving the Reliability of Sentiment-Based Strategies
Combine Sentiment with On-Chain and Technical Data: Ensure to always combine sentiment with on-chain and technical indicators such as RSI and others for more effective result.
Monitor Extreme Sentiment for Contrarian Signals: Ensure to check extreme level of greed and fear to know when the market wants to reverse to the opposite direction.
Monitor Whale and Institutional Behavior: Ensure to always monitor the whales and institutions behaviour to know what they are thinking about the market.
Be informed: Stay informed with market trend and information so that you will know when there are changes in the market and you can also adjust along side the market.
Finally, I want to invite @waterjoe, @josepha, and @ripon0630 to also join the contest and share with us their thoughts on Advanced Strategies Using On-Chain Data and Sentiment Indicators.
NB: All images except otherwise stated are mine and are gotten from the TradingView, steemscan, coinmarketcap and coinstats website

Upvoted! Thank you for supporting witness @jswit.
@tipu curate
;) Holisss...
--
This is a manual curation from the @tipU Curation Project.
Upvoted 👌 (Mana: 0/7) Get profit votes with @tipU :)