Mastering the Bull Run with Trailing Stop and Multi-Timeframe Analysis
Greetings my fellow traders,
It's the third week of the Steemit Learning Challenge for season 21 and I'm delighted to join this week's competition which is titled Mastering the Bull Run with Trailing Stop and Multi-Timeframe Analysis. I will be attempting the questions given below as part of my entry for the contest.
| Question 1: Explain Trailing Stop and Its Usefulness in a Bull Run |
|---|
Describe how a trailing stop works and why it is especially useful in a bull run. Discuss different types of trailing stops (percentage-based, fixed levels, or ATR-based) and how they protect profits while capturing the upward trend.
The word trailing stop is a term used in the crypto space for dynamic stop loss which helps to protect the traders profits as the market continues to move in the direction predicted. This stop loss is different from a static stop loss which doesn't make any adjustments as the price moves. In the case of the trailing stop, we see price adjust in amount or percentage securing the amount or percentage profit.
How a Trailing Stop Works & Why Useful in a Bull Run
Trailing Mechanism
The step or ways the Trailing Stop Works can be seen below
At first, the Trailing Stop is set at a fixed price, percentage or volatility measure. In the case of long position it is usually set below the market price and in the case of short position is usually set above the market price.
If the price moves in the predicated direction, the Trailing Stop moves along with it and it maintain thesame distance as it has in the beginning which means if the stop loss was 10% away from the current price then it will adjust accordingly based on the movement.
If after or before movement the price hit the Trailing Stop, the position will close with the gained profit secured or reducing the amount of losses.
Why Useful in a Bull Run
There are basically two major reasons why Trailing Stop is useful in Bull Run and below we will look at them.
Profit Protection: If the market is in a strong upward movement, the Trailing Stop helps to lock the profits gained during the upward movement because there are tendencies that market may sharply reverse during a rally in the market which won't affect the already locked profit.
Trend Capture: Since the Trailing Stop automatically adjust itself as the market moves, traders are always confident of the stay in the market because part of their profits are always save as the market keeps moving and even if there is a rally in the price that leads to a sudden reversal, it won't wipe out the profit they have made from the beginning instead it will only take away the one that wasn't adjusted.
Types of Trailing Stops
Basically there are 3 major type of Trailing Stops which include Percentage-Based Trailing Stop, Fixed Level Trailing Stop & ATR-Based Trailing Stop. Now let's look at them under the following heading, its meaning (description), example explanation, advantages and best use case.
Percentage-Based Trailing Stop: Here, as the name suggests Trailing Stop, it is usually set at a certain percentage (e.g 10%) below or above the price action for long or short respectively. If the price increase or decrease for long or short, the Trailing Stop moves up or down maintaining same percentage space as in the initial.
Example: Let's consider a long position here. If the current price of an asset is $50 and it has a trailing stop of 10%, this means that the stop loss of the asset will be set at $45. If the price moves higher to $70, the trailing stop will be set at $63 which is (10% below $70) and if the market moves below the $63 then the position will exit itself.
Advantages: It is easy to set as it is in percentage, you don't have to do the arithmetic as it is automated and it is widely use by traders.
Best Use Case: This type of trailing stop is used in markets whose trends are consistent as it will adjust based on the price movement.
Fixed Level Trailing Stop: Here a fixed dollar price is what the trailing stop is set with below or above the current price for long or short respectively. For instance $10 below or above current market price for long or short.
Example: Let's consider a long position here. If the current price of an asset is $50 and it has a trailing stop of $10, this means that the stop loss of the asset will be set at $40. If the price moves higher to $70, the trailing stop will be set at $60 and if the market moves below the $60 then the position will exit itself.
Advantages: This method is very easy to calculate as you only need to add the amount you initially started with at all level as it keeps moving.
Best Use Case: This type of trailing stop is best used in market with low volatility.
ATR-Based Trailing Stop: Here, Average True Range (ATR) indicator is the format used to set the trailing stop. Here price adjust automatically according to the ATR which has the +2 and -2 difference for the upper band and the lower band respectively.
Example: If for instance, ATR is $3 and the trader uses 3x ATR trailing stop, then the price where the stop will be set in the case of a long will be $9 below the current price. If the price moves upward, then the trailing stop adjust accordingly.
Advantages: Here since the ATR indicator is a volatile indicator, it adjust in price of asset based on the market volatility.
Best Use Case: It is mostly used in volatile market as it adjust accordingly based on the ATR.
How Trailing Stops Protect Profits While Capturing Trends
The trailing stop protects profits while capturing trends in the following ways, Profit Lock-In, Ride the Trend and Automatic Exit. The explanations are also seen below.
Profit Lock-In: Based on the adjustment done in the Trailing stop, some of the profit secured will be locked which means even if there is a reversal, some of the profits will be locked.
Ride the Trend: In bull run, the Trailing stop keeps traders in the market as it continue to adjust upward since the trend keeps moving upward and these keeps the traders longer in the market to maximise all opportunity of the trend.
Automatic Exit: Since the Trailing stop offers an automatic Exit, as the price adjust if there is a counter movement, traders don't need to be scared because they are well protected.
| Question 2: Multi-Timeframe Analysis for Steem’s Bull Run |
|---|
Use multi-timeframe analysis on the Steem/USDT pair by observing trends across different timeframes (e.g., weekly, daily, and hourly). Explain how each timeframe provides complementary insights for refining entry points, stop levels, and profit-taking decisions.
In this section of the question, we are going to be looking at the pair STEEM/USDT on different time frame. Here we are going to be looking at the trend of the market, momentum of the market and this also help us to decide entry, exit and also make use of proper risk management. So we are going to be looking at the weekly, daily and the hourly timeframe for our analysis.
Expectations for Multi-Timeframe Analysis on STEEM/USDT
Below I will list the guides or expectations or what is needed when carrying out Multi-Timeframe analysis on the pair of STEEMUSDT. We are going to be taking them one after the other.
Weekly Timeframe (Macro View): Here we intend to look for the overall trend of the market taking into consideration the major Support and resistance level. Here what we look out for include trend direction, key levels, momentum indicators and the insights of the market.
Trend Direction: Firstly you must identify if the market is in an uptrend, downtrend or sideways. This is the first thing before making any other decision.
Key Levels: Major level of support and resistance level as well as the levels identified by the Fibonacci retracement must always be taken into consideration.
Momentum Indicators: To know if the market is overbought or oversold, the RSI or any other momentum based indicator such as MACD should be used to identify levels of overbought and oversold.
insights: If the weekly chart shows a strong uptrend, then you must focus on longing the market and if it shows a strong downtrend then you should consider shorting the market lastly if the market shows a range then possible breakout should be expected.
Daily Timeframe (Intermediate View): Here we see the medium term view of the market. As it gives you an information of the trend based on weekly chart information. Here also we look out for Trend Continuation or Reversals, Chart Patterns, Moving Averages and the insights of the market.
Trend Continuation or Reversals: Traders check if the daily trend is in agreement with the weekly timeframe. This means that a check if the daily and weekly are all in same trend i.e., if all are uptrend or downtrend.
Chart Patterns: Here you look for basic chart patterns such as bullish flag for uptrend bearish flag for downtrend, double top/bottom etc., these pattern helps you to make decision.
Moving Averages: These indicator helps to identify bullish or bearish cross over. So a combination of 50-day and 200-day MA crossing each other can signal a buy or sell.
insights: When there is a pullback in the daily timeframe, one can have the opyto enter the market if the missed out the first movement. Stop loss also can be set based on the swing within the daily timeframe also divergence if spotted on daily timeframe can indicate trend reversal.
Hourly Timeframe (Micro View): In this level, you will be able to get an entry or exit point based on the previous analysis of the weekly and daily timeframe. Here also we look out for Intraday Momentum, Volume Spikes, Indicators and the insights to the market.
Intraday Momentum: Here you check and be sure that the hourly trend is same with higher timeframe such as daily and weekly before making decisions.
Volume Spikes: Check for Volume movement along side price and be sure that they are in same direction.
Indicators: Indicator like the 20-period EMA can be used to determine the entry and the exit points in the market.
insights: Check and see that the hourly chart, daily chart and weekly align and if that happens you will know it is a strong trend. Look for breakout from the hourly chart. Use your hourly chart to set stop loss and take profit in the trade.
Example: Applying Multi-Timeframe Analysis to STEEM/USDT
Weekly Chart Observation: Here we are going to be looking at the trend, support and resistance and the momentum as explained above.
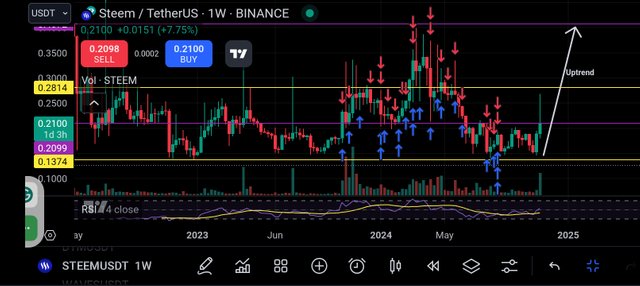
From the above screenshot my observation for the weekly chart is that the trend of the STEEM/USDT is in a strong upward movement. Also I observe and marked major support and resistance level using the horizontal trendline using the yellow and purple colour. I also noted that the RSI is around the 53 which shows bullish momentum without overbought.
Daily Chart Observation: From the chart we saw a little pull back and then a continuation of the trend to the upward direction. The formation of the bullish flag off shows that the trend is still going to be in an upward direction.
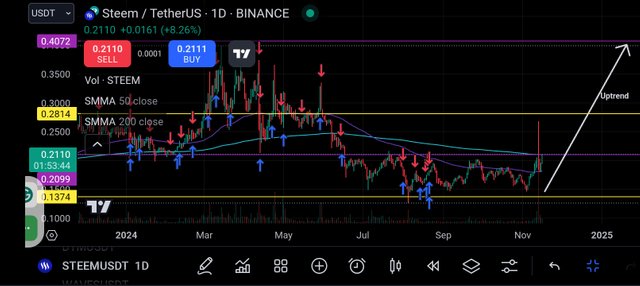
Using the 50-day and the 200-day MA, you will notice that 50-day MA is above 200-day MA which confirms the trend movement to the upper direction. The resistance and support in this level is still maintain.
Hourly Chart Observation: Considering the same chart on a 4H timeframe, you will notice the price breaking through a resistance level and also checking through the RSI it was around 60 meaning it is bullish and hasn't hit the overbought region yet.
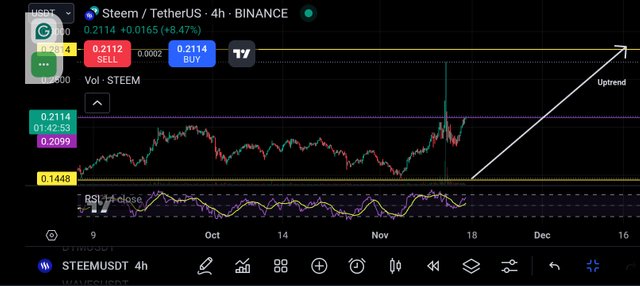
So combining the pattern and the RSI indicator, one can enter the market immediately after the candle breaking the resistance closes and a pattern confirmation is also visible.
Refining Strategy Based on Multi-Timeframe Analysis
Entry Point: After carefully looking at all the charts i.e., weekly, daily and hourly, one can enter the market if he or she noticed that the trends are same direction. In my case entry will be at the close of the current candle in the 4H timeframe
Stop-Loss: Here I will place my stop loss below the nearest support level in the 4H chart or to minimise my risk I will place it in the last low of the movement.
Profit-Taking: Profit should be placed in the resistance level of the weekly chart and a trailing stop should also be used in other to lock profit made from the account.
| Question 3: Adjusting Trailing Stops Based on Multi-Timeframe Analysis |
|---|
Show how to adjust trailing stops based on information gathered from multiple timeframes. For example, a stop based on weekly ATR can offer enhanced security in a long-term context, while a daily stop adjustment can closely track the trend. Use examples to illustrate.
Here we are going to be looking at how we can adjust trailing stop based on information gathered from multiple timeframes. This allows traders to capture the trend in the market as it can be used in different market strategy or condition. Lets consider a framework on how this works.
Framework for Adjusting Trailing Stops
Weekly ATR-Based Trailing Stop: Here the ATR helps to account for long term volatility by protecting the position of the trade.
Calculation: Calculate using the Average True Range to determine distance where the trailing stop will be located and adjusted accordingly.
Example: If the weekly ATR is at $0.02 and we want to go for a long position, we are to set a stop loss 2x ATR below the current price.
This means that if the price of STEEM/USDT is at $0.30, the the stop will be placed at $0.26 which implies that ($0.30 - $0.04). If the price continue to move up we see adjustment as the stop continue maintaining a distance of $0.04 from the current price.
Daily-Based Trailing Stop: Here the trend is followed closely and the trailing stop is adjusted based on the daily price movement and a pull back is also expected. ATR is used here for a more tighter stop unlike the weekly. An ATR of 1.5x can be considered for use.
Swing Lows/Highs: Your stop loss should be placed below the current swing lows for the uptrend movement and should be placed above the current highs for a downtrend.
Example: If the price of STEEM/USDT is at $0.30, in an uptrend market, the the stop will be placed in the current swing lows below the price.
Hourly-Based Trailing Stop: Here a much more trailing stop is provided which helps in sharp moves and locking profit and also exiting you from the market. Here you may want to use a percentage such as 1% or 2% of the price action.
Support Levels: For an uptrend, place the stop directly below the support level in the hourly timeframe to keep you in the market and exit of the trend changes.
Example: If the price of STEEM/USDT is at $0.30, in an uptrend market, a 2% trailing stop may be used and the position of your stop loss will be $0.294 and that will continue to adjust upward if market keeps moving giving a distance of $0.006 from current price.
How to Adjust Trailing Stops Dynamically
Here the entry point was seen $0.2040, the weekly stop was kept at $0.175 which is 2x weekly ATR.
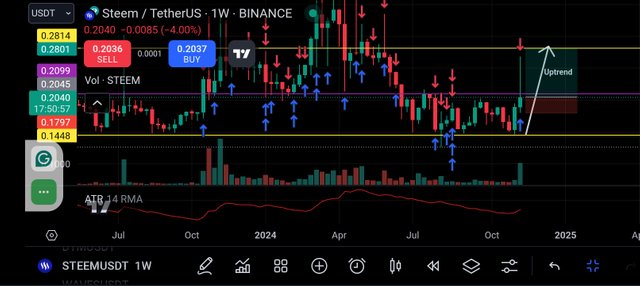
From the screenshot above you can see that a huge gap of stop loss was consider and the Take profit is kept in the next resistance level.
In the daily timeframe as you can see from the screenshot below the entry remains at $0.2040 the stop loss was adjusted upward to about $0.185 which shows how the trailing works with timeframe.
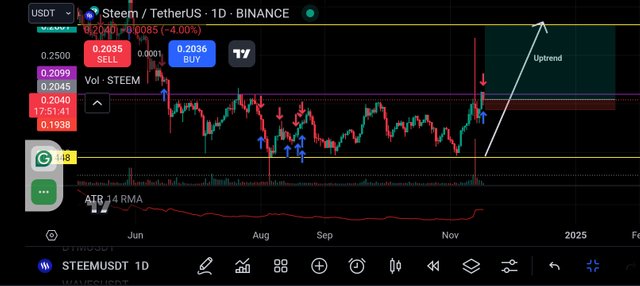
So this adjustment reduces the risk which was supposed to be incurred as seen in the weekly timeframe. ATR is moving towards overbought which mean there is still some movement.
In the hourly timeframe, as you can see from the screenshot below the entry remains at $0.2040 the stop loss was adjusted to about 2% of the current price of the asset.
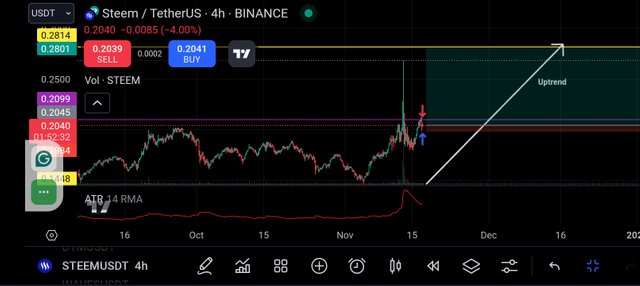
If you consider the Stop loss used here you will notice that it is almost negligible as it is very small. This also reduce the risk a trader is willing to take. So this adjustment of the stop loss will continue depending on the timeframe.
Using a Multi-Timeframe on a chart helps you secure some profit and the trade closes if the stop loss of the hourly is hit for instance locking the profit that has been made. Similarly, if the market keeps going up it will keep adjusting to same distance as in the first. This means if a profit of 2% is made, it secure it and adjust the stop loss to 2% below the current price.
| Question 4: Develop an Advanced Trading Strategy for a Bull Run |
|---|
Create an advanced trading strategy for Steem’s bull run by combining trailing stops and multi-timeframe analysis. Describe your entry and exit criteria, adjusted trailing stop levels for each timeframe, and methods to optimize gains while minimizing risk.
To create an advanced trading strategy for the pair of STEEMUSDT during bull run combing Multi-Timeframe and dynamic trailing stop for the purpose of maximising profits and minimizing loss then we can consider using the below procedure.
Multi-Timeframe Analysis
Weekly Timeframe: Identify trend and note key support and resistance level. Use the 50-days and the 200-days MA. Check if RSI is above 50 to indicate an uptrend movement and that asset has not been overbought.
Insights: After all confirmation, which indicates that the asset is in an uptrend then set your Trailing stop which is 2x weekly ATR since that keeps one longer in the market.
Daily Timeframe: Adjust closely to have a closer look of current trend and to get an entry point. If price is above the 50-days MA and there is bullish candle pattern such as bullish flag. Use the RSI to know the strength of the indicator.
Insights: After all confirmation, which indicates that the asset is in an uptrend then set your Trailing stop which is 1.5x weekly ATR since that keeps one longer in the market.
Hourly Timeframe: Select entry and exit point since this tells you exact price point and movement. Set trailing stop at hourly resistance and support. Use RSI to be sure that market is not overbought.
Insights: After all confirmation, which indicates that the asset is in an uptrend then set your Trailing stop which is 2% below the current price.
Entry Criteria
To enter the market in a weekly timeframe, be sure that price is bullish on the weekly chart. For the daily chart confirm if the chart is continuation or a reversal pattern before going down to hourly chart to enter. Check to be sure the levels of hourly resistance are broken and trend is going upward.
If the hourly price close above resistance then you may consider entry a long since the RSI hasn't show overbought. You can place stop loss below the recent broken resistance level.
Adjusting Trailing Stops
Use a 2x ATR on the weekly chart, 1.5x on the daily chart and 2% on the hourly chart. I have explained how this can be done above.
In the case of the weekly, if the price of STEEM/USDT is at $0.30, the the stop will be placed at $0.26 which implies that ($0.30 - $0.04). If the price continue to move up we see adjustment as the stop continue maintaining a distance of $0.04 from the current price.
In the case of the daily timeframe If the price of STEEM/USDT is at $0.30, in an uptrend market, the the stop will be placed in the current swing lows below the price.
In the case of the hourly If the price of STEEM/USDT is at $0.30, in an uptrend market, a 2% trailing stop may be used and the position of your stop loss will be $0.294 and that will continue to adjust upward if market keeps moving giving a distance of $0.006 from current price.
Profit-Taking Criteria
Profits here are taken gradually on various resistance level as the stop loss continue to adjust upward. So the first take profit will be in the first resistance, the second will be in the next with trailing stop adjusted to thesame distance it was first put. The profit made is locked and if the market rally, you will be kicked out of the market.
Example Trade Execution
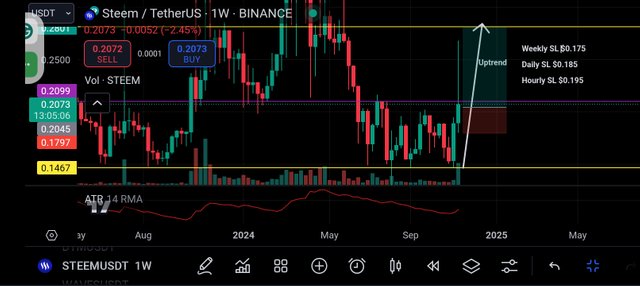
Entry:In the weekly chart we see a strong uptrend with price at $0.2040
Daily chart also confirms the uptrend moves as well as price broke the current resistance level. Checking the hourly chart I saw a clear breakout. The trailing stop was $0.175 which is 2x weekly ATR.
Trailing Stop Adjustments:
Price Reaches $0.2040:
- Weekly stop: Adjust to $0.175.
- Daily stop: Adjust to $0.185.
- Hourly stop: Tighten to $0.195.
Exit: If the price hits the daily stop, then it exit you from the market else it adjust with same percentage upward of the trend continue in same.direction.
| Question 5: Precautions and Limitations of Trailing Stops and Multi-Timeframe Analysis |
|---|
Discuss the limitations and risks associated with trailing stops and multi-timeframe analysis in a bullish market. Provide tips to avoid being prematurely stopped out and interpret trend reversal signals across multiple timeframes accurately.
Despite how good the multi-timeframe and the trailing stops are in trading crypto assets, there still some limitations that must be closely looked out to avoid our account been burn or liquidated. So below are few of the limitations and risk and how they can be effectively addressed.
Limitations, Risks of Trailing Stops and solutions
Premature Stop-Outs: Using trailing stop, you may be forced out of the market prematurely with noise or little pull backs in the market.
Solution: Make use of wider range of trailing stop and combine it with key support and resistance as well as Fibonacci retracement so as to stay longer in the market.
Over-Optimization: Using too much tight stop loss can opt you out of the market before the trend will move to the predicated direction.
Solution: Use the ATR to point out position where the trailing stop loss will be positioned and use the different trailing stop such as percentage and others to know which work more effectively for you.
Delayed Adjustment: If the trailing stop doesn't adjust promptly, there may be a loss of unprotected profit which was supposed to be locked and serve as your gain.
Solution: Apply automated trailing stop or monitor the market closely to make adjustment when profit has been made and adjust stop loss accordingly.
Limitations, Risks of Multi-Timeframe Analysis and it's solutions
Conflicting Signals: There are instances where the timeframes presents different signals and this makes it difficult for traders to make a decision.
Solution: Make use of higher timeframe such as weekly or daily to have a clear view of the market structure.
Over-Analysis: Analysis that is done on multiple timeframe can make the trader confuse as there may be different results obtained.
Solutions: Use just two timeframe for your analysis such as daily and weekly for longer staying in the market and daily and hourly for a shorter stay in the market.
Misinterpreting Trend Reversals: Cases of little pull back to gather momentum may be seen as a trend reversal and that can mislead traders.
Solution: Ensure you use a higher timeframe to confirm reversal before making any decision.
Tips to Avoid Being Prematurely Stopped Out
Set Stops Based on Market Structure*: Your stops should be set based on the structure of the market. If the market is in an uptrend then stop must be set below the current price maybe the next support level.
Use ATR-Based Stops: Set stop based on the ATR indicator as it helps to calculate accurate distance between current price and where you set your stop and it adjust accordingly with the distance.
User higher Timeframe: Consider using a higher timeframe for your stops so that you don't get kicked immediately in the market anytime there is a little pull back.
Trail Stops Dynamically: Trailing stop should be adjusted automatically or monitored closely to avoid consuming profit already made.
Interpreting Trend Reversal Signals Across Multiple Timeframes
Weekly Timeframe: On weekly timeframe, if the price falls below the 50 RSI it means that the uptrend momentum is weak and a possible trend reversal may be expected. Also if price moves below the 50-day MA it implies that trend is about to reverse.
Daily Timeframe: When price breaks key support level in the daily timeframe and we see a cross in the MACD.
Hourly Timeframe: When the hourly timeframe breaks support level and forms lower highs and lower lows.
Finally, I want to invite @suboohi, @josepha, and @ripon0630 to also join the contest and share with us their thoughts on Mastering the Bull Run with Trailing Stop and Multi-Timeframe Analysis.
NB: All images except otherwise stated are mine and are gotten from the TradingView website


.jpeg)