

Hi guys
I specially once again welcome us all to the second week of season 6 here in the steemit crypto academy. This week, the professor in the person of
@fredquantum discuss extensively on the topic
Crypto Trading Strategy With Triple Exponential Moving Average (TEMA), after attending the lecture delivered by the professor, I have resolve to attempt the homework task given. Let's get started.
1. What is your understanding of Triple Exponential Moving Average (TEMA)?
In crypto trading, one of the most commonly used indicators is the moving average indicator. This is because the indicator is very easy to read and understand by both newbies in the crypto world and those who have gone advance in trading.
In using moving average indicator, we are meant to understand that when the price chart is seen above the indicator, it implies that the trend is bullish in nature in the same way, when the indicator is seen above the price chart, it implies that the trend is bearish in nature. We have several types of moving average indicators among which include the simple moving average, exponential moving average, weighted moving average, triple exponential moving average etc.
Our focus here today is the Triple Exponential Moving Average. All the other moving averages mentioned above can be seen as an earlier developed averages which has some lapses and the Triple Exponential Moving Average (TEMA) serves as an advance version for them as it helps to solve all the issues associated with the earlier developed average.
Patrick Mulloy developed the Triple Exponential Moving Average (TEMA) after he saw the lapses in the other types of moving averages. The lapses include noise, lagging, false signal etc. The indicator is made up of a single oscillating line which is calculated by combining 3 EMA which are using same period.
This indicator was formerly used in the stock market and it has been proven to be very successful and gradually, because of the rate of it success it was then adopted and used in the crypto market as well.
A smoothing function is used by the TEMA indicator to get rid of noise, false signal and the lagging that are found in most moving average. When this is done, the TEMA also help to spot clear trend movement I.e (continuation and reversal), support and resistance levels, buy and sell entry zone as well as exit zone.
Finally, just like every other moving average indicator, the TEMA identify trend direction and entry position in same manner. In the case of bullish trend, the TEMA indicator will be seen below price chart, in the same way in the case of bearish trend, the TEMA indicator will be seen above price chart. For entry position (buy/sell) to be taken there must be a cross between the moving averages with different periods.
2. How is TEMA calculated? Add TEMA to the crypto chart and explain it's settings. (Screenshot required).
To calculate the TEMA, we will be making use of 3 EMA and this is to help us eliminate the noise as well as the lagging. Below is how it is calculated.
TEMA = (3 * EMA1) - (3 * EMA2) + EMA3
Where;
EMA1 = Exponential Moving Average
EMA2 = Exponential Moving Average of EMA1
EMA3 = Exponential Moving Average of EMA2
It's important to mention here that all the EMA's used to calculate the TEMA are all set at the same period. The essence of this is to ensure that accuracy of the data is taken into consideration.
Adding TEMA to price chart
Here in this section, we will be making use of the tradingview.com platform to perform this task. So the steps are seen below.
Visit the tradingview official site by clicking on tradingview and then access the price chart.
On the chart, locate and click on indicator and then a search bar and list of indicators will display, search for TEMA
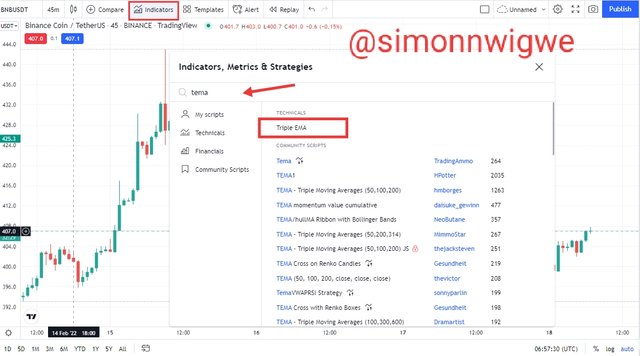
Source
Once you have seen the indicator, click on it. And it will be seen in the price chart like this
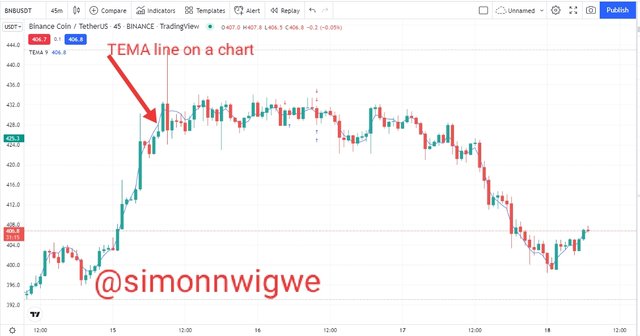
Source
To change any settings, click on the settings icon and a dialog box showing inputs, style and visibility will display. Sees screenshot below.
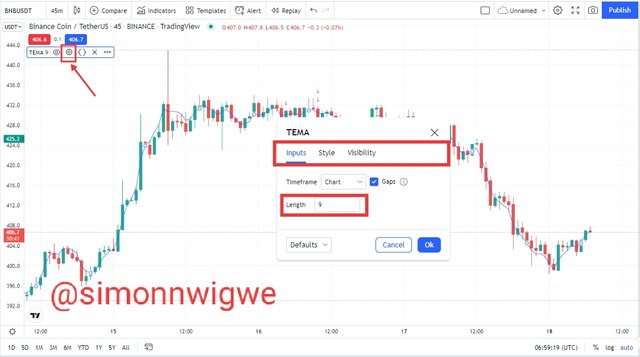
Source
From the screenshot above, you will notice that the default period (length) settings is 9, and this is a very nice setting for short term traders. They period can be change depending on the traders strategy. For long term traders the period can be change to a more higher number like 20 and above and that makes the chart clear and the signal more reliable.
3. Compare TEMA with other Moving Averages. You can use one or two Moving Averages for in-depth comparison with TEMA.
Here I this section, I want to compare the TEMA and the SMA and the EMA. As I have stated earlier the reason of the TEMA indicator is so that it can be able to correct the lapses found among other moving averages. Let's consider the table below.
| TEMA | SMA | EMA |
|---|
| Three EMA's values are used here to derive the average value of the market | Arithmetic mean is used to derive the average price of a given period of time | Here recent prices are used derive average value of the market |
| Signal here is smoother and precise | Signals are not precise or smooth because it still contains noise | Noise are still found in the signal generated hence it's not precise |
| Lagging factor in the price of the asset is completely eliminated at this point hence a more reliable price is ascertain | Reacts too fast to price and may lead to false signal | Lagging factor is still present hence the average price gotten is not too reliable |
4. Explain the Trend Identification/Confirmation in both bearish and bullish trends with TEMA (use separate charts). Explain Support and Resistance with TEMA (on separate charts). (Screenshot required).
The moving average as we has started clearly above is a trend based indicator I.e it tells a trader the direction of a trend at any point in time.
Bullish Trend
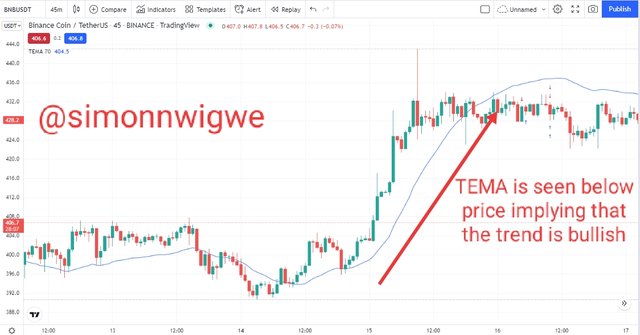
Source
From the screenshot above, we can see that the TEMA line is found below the price chart and just like every other moving average, this identify the fact that the trend at this point is bullish. The price chart as you can see is moving in an upward direction and the TEMA below it also moving in an upward direction.
Bearish Trend
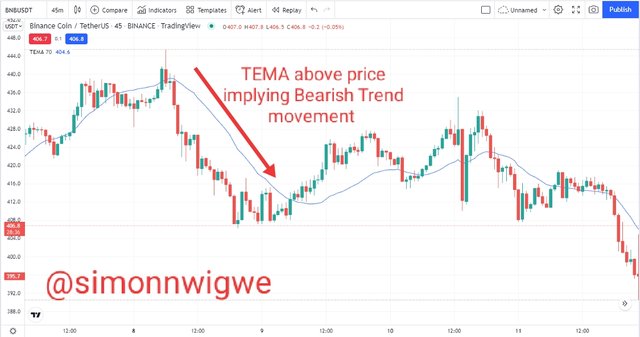
Source
From the screenshot above, we can see that the TEMA line is found above the price chart and just like every other moving average, this identify the fact that the trend at this point is bearish. The price chart as you can see is moving in a downward direction and the TEMA below it also moving in an downward direction.
Support and Resistance using TEMA
Levels of support and resistance are very important levels as far as trading is concern. This levels shows the strength of buyers and sellers in the market. When ever the price gets to these levels of support or resistance, it is expected that the price breakthrough and continue in same direction or it retest and reverse to the opposite direction.
The points of support and resistance are mostly used by traders to make their entries I.e the points and good entry and exit position when it comes to trading. So let's look at support and resistance on a chart.
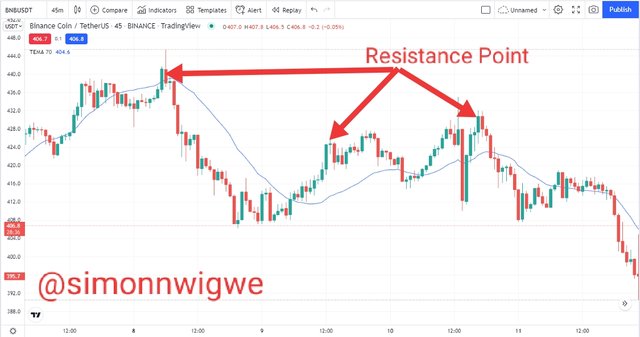
Source
From the screenshot above, the point marked as the resistance level is the point where the price can no longer move in an upward direction and then a reversal is notice in the price. This points are good entry points for sell position and traders often make use of it to maximize their profit.
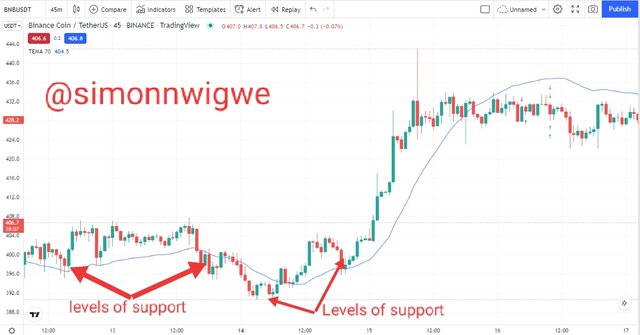
Source
In a similar way, from the screenshot above, the point marked as the support level is the point where the price can no longer move in a downward direction and then a reversal is notice in the price. This points are good entry points for buy position and traders often make use of it to maximize their profit.
5. Explain the combination of two TEMAs at different periods and several signals that can be extracted from it. Note: Use another period combination other than the one used in the lecture, explain your choice of the period. (Screenshot required).
When ever two moving average with different periods are combined on a chart, we look out for crossing which helps traders to understand that the trend is about to reverse. Normally, we will need to have one of the MA with a short period and the other MA with a longer period. Short period MA reacts faster to price whereas long period MA reacts slower to price action.
We combine this indicators together so that we know exactly when to buy or sell our asset. The buying and selling points are points where the TEMA lines crosses each other. Here I will be making use of the periods 20 and 70.
In the case of a bullish signal or buy entry position, the 20 period TEMA line must cross and stay above the 70 period TEMA line. This is an indication that buyers are now fully in charge of the market hence at any suitable point after the crossover a buy entry can be made. See screenshot below.
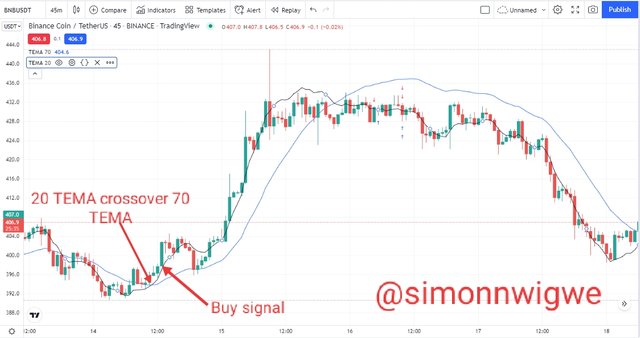
Source
From the above screenshot, you will notice that the smaller TEMA line which is 20 period cross above the larger TEMA line with 70 period. And a buy entry point is seen immediately after the crossing as the price moves in a bullish or upward direction.
Similarly, in the case of a bearish signal or sell entry position, the 70 period TEMA line must cross and stay above the 20 period TEMA line. This is an indication that sellers are now fully in charge of the market hence at any suitable point after the crossover a sell entry can be made. See screenshot below.
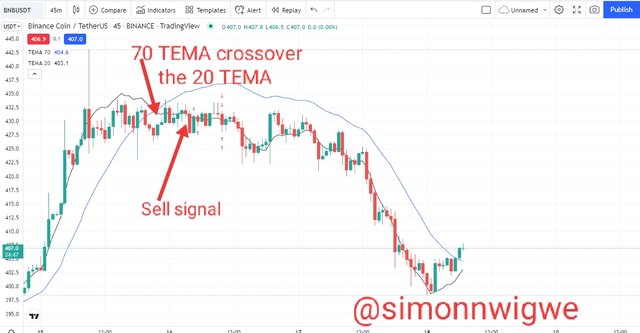
Source
From the above screenshot, you will notice that the larger TEMA line which is 70 period cross above the smaller TEMA line with 20 period. And a sell entry point is seen immediately after the crossing as the price moves in a bearish or downward direction.
6. What are the entry and exit criteria using TEMA? Explain with charts. (Screenshot required).
The entry and exit of trade criteria using the TEMA indicator has to do with the crossover we just explained above.
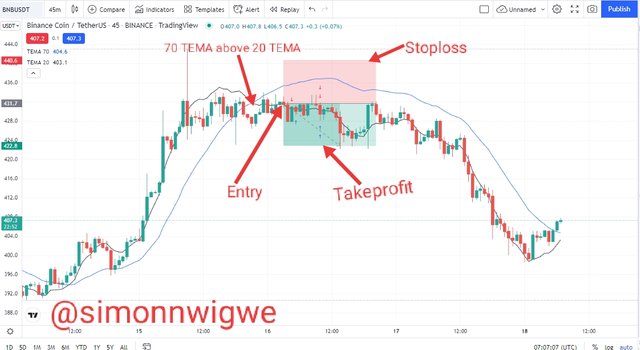
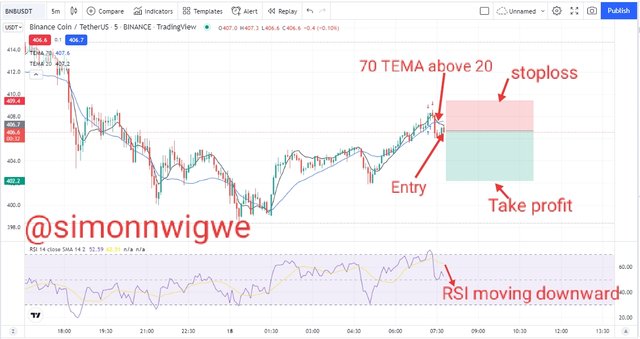
Sell Trade Entry and Exit Criteria
In the case of bearish trend, the price is seen going in a downward direction when the combined TEMA indicators with different periods like the one I used (20 and 70) cross each other.
When the longer TEMA I.e 70 period cross above the shorter TEMA I.e 20 period it signifies bearish trend and the price begin to move in downward direction.
When this crossing happens, a sell entry position can be taken but it is always advisable to live it until at least two bearish candle shows itself before the entry should be made.
Take profit as well as stop loss can be taken at the ratios of 1:1 or 1:2 to ensure that we don't loss much if the trade does not go in our favour. Let's consider the screenshot below.
Source
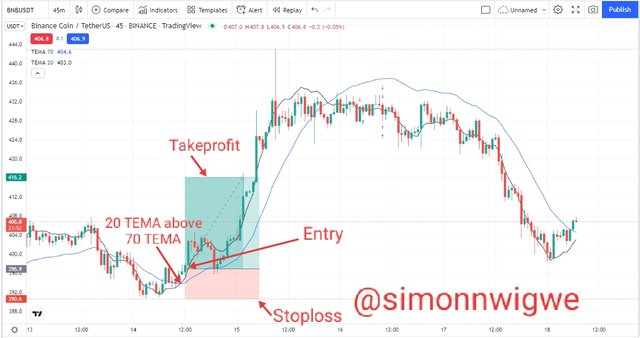
Buy Trade Entry and Exit Criteria
In the case of bullish trend, the price is seen going in an upward direction when the combined TEMA indicators with different periods like the one I used (20 and 70) cross each other.
When the shorter TEMA I.e 20 period cross above the longer TEMA I.e 70 period it signifies bullish trend and the price begin to move in upward direction.
When this crossing happens, a buy entry position can be taken but it is always advisable to live it until at least two bullish candle shows itself before the entry should be made.
Take profit as well as stop loss can be taken at the ratios of 1:1 or 1:2 to ensure that we don't loss much if the trade does not go in our favour. Let's consider the screenshot below.
Source
7. Use an indicator of choice in addition to crossovers between two TEMAs to place at least one demo trade and a real margin trade on an exchange (as little as $1 would do). Ideally, buy and sell positions (Apply proper trade management). Use only 5 - 15 mins time frame. (Screenshots required).
Here in this section, I will be performing a demo trade and a real trade. I will be using the TEMA crossover strategy along side the RSI indicator to perform this trade. The RSI indicator is scaled from 0 - 100, when the threshold is seen from 70 and above, we say that the asset under review is in an overbought region and when the threshold is seen from 30 below, we say that the asset is in an oversold region.
Demo Trade
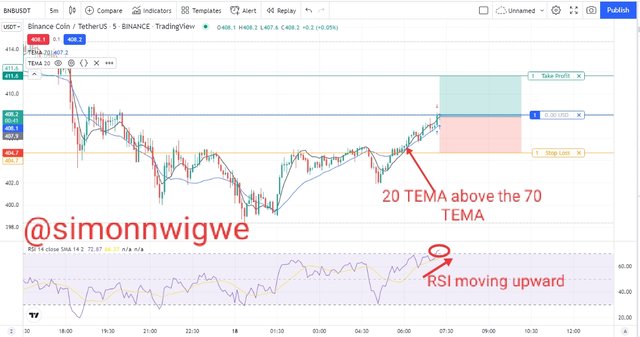
Source
Let's consider the chart above. Here in this chart, I have added 2 TEMA of length 20 and 70 respectively, I also added the RSI indicator to see the strength or pressure of either buy or sell. From the we have place our order and proper risk management was taken into consideration and that is why the take profit and stop loss level are taken into consideration.
Source
The trade was executed using the paper tradingview. And from the screenshot you can see the profit made.
Real Trade
Source
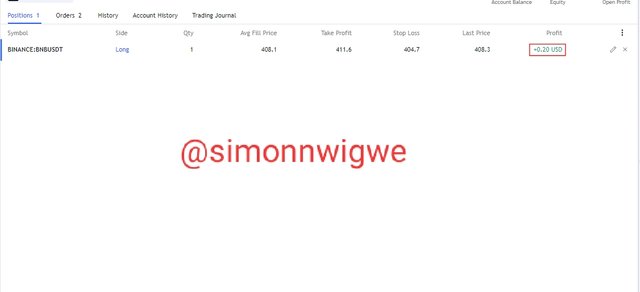
The analysis of this trade is carried out using the trading view platform and it's execution is done using my verified binance account. All criteria as in the case of the demo trade above was also obyed. See trade execution on binance below.
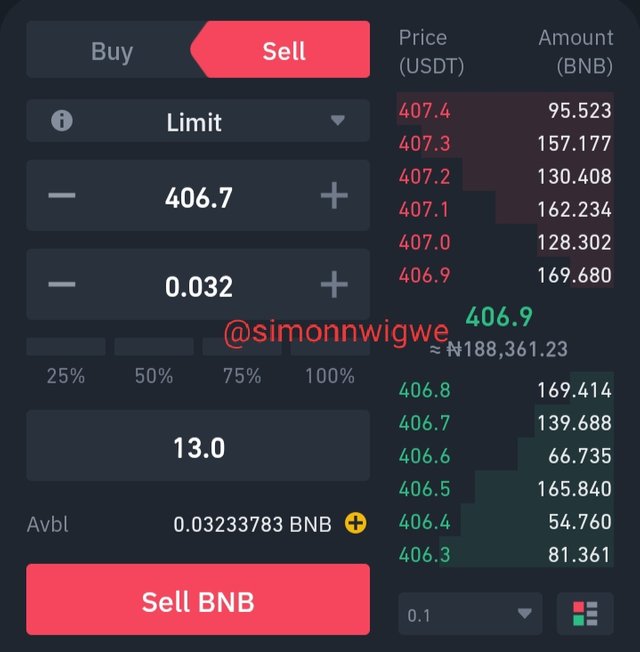
Source
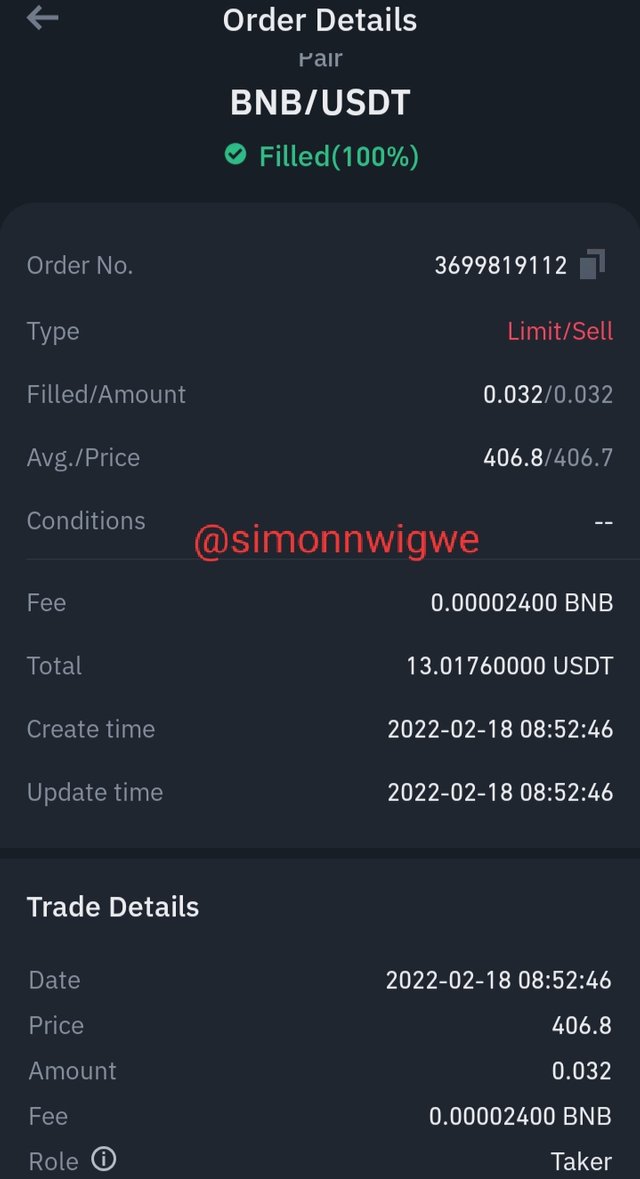
Source
8. What are the advantages and disadvantages of TEMA?
Everything that has an advantage also has a disadvantage. I have also said that no indicator is 100% efficient and because of that it is usually advisable to combine the indicator with other technical indicator or strategy in other to obtain an optimal solution. Below we are going to be looking at the advantages and disadvantages of the TEMA indicator.
Advantages of TEMA indicator
The indicator is a leading indicator hence signal is provided ahead.
The indicator is very easy and simple to read and understand hence it can be used by anyone.
The indicator can be used for both long term and short term trading
Entry and exit points are easily seen just by crossing of TEMA combine on a price chart
The indicator filters noise and lagging and hence produce a more reliable result when compared with other moving averages
Disadvantages of TEMA indicator
Faster reaction to market movement is one major issue with the TEMA because it can mislead traders into entering a false signal trade.
The indicator does not generate a reliable signal when the trade is in a range. It only does that when the trade is trending either upward or downward but in a sideways trade the signal is not always clear.
Due to the fact that this indicator is a leading indicator, traders have to pay more attention to it else they will miss out of the trade.
Conclusion
Moving Averages indicators are usually used by traders both new and old because it is simple to read and understand. The Triple Exponential Moving Average TEMA indicator as we have seen has help to solve some lapses associated with other types of moving average like the simple moving average, exponential moving average etc. We have seen how the TEMA eliminate lagging and noise making the signal more reliable. As I have always said, despite all the good things about this indicator, it should never be used as a stand alon tool when making a real trade. It is recommended that we combine it with other indicators to obtain a better result.
I want to sincerely appreciate the professor in the person of
@fredquantum for such an insightful and educative lecture, sir I do hope to continue learning more from you as the Academy progresses.
