[Crypto Trading With Williams % R Indicator]- Crypto Academy S4W4 - Homework Post for professor @kouba01

Hello guys and to professor @kouba01, I would like to give great thanks for this lecture note for it really guided me in my research with the topic at hand. This week was all about Crypto Trading With Williams % R Indicator. I would be making my research based on the task given by the professor. Lets set the ball rolling.
Question 1
Explain the Williams %R indicator by introducing how it is calculated, how it works? And what is the best setting? With justification for your choice.
The Williams %R Indicator
The idea of the Will Williams %R indicator was built purposely to better trading decisions. It is a technical indicator that works based on momentum. Its idea helps traders in the market to detect overbought and oversold prices in the market of a crypto asset. The other area it also focuses on is showing reversals of trends in the market. This Indicator was designed in the year 1973 by Larry Williams. Unlike other technical indicators that are so difficult to use, this is less difficult to use.
The Williams %R could also be called the Williams Percent Range, the indicator clocks between 0% and then a -100% and as I mentioned earlier measures overbought and oversold levels which further determines the place of entry and exit points in the market.
What we should further about this indicator is that the mark of 0% to -20% in the market will always be said to be an overbought and while the mark -80% to -100% is said to be an oversold in the market.
Now I will be discussing how it is calculated. Larry Williams aside from creating this wonderful indicator also came out with a math formula that could be used to calculate the value for the Williams %R. That is what I would be discussing in my submission. Below is the represented mathematical equation for the Williams %R
Wiliams %R = (Highest High – Close / Highest High − Lowest Low) x -100%
Where:
The Highest High = Highest price in the lookback period, which is typically 14 days
Close = Most recent closing price. Lowest Low=Lowest price in the lookback period, also typically 14 days.
So basically, the Williams %R is calculated based on the price typically taken over the last 14 days or period.
Let’s take an example: Assuming we consider a chart running on a period of 14 days where the Highest high was said to be at $50 and then its close price was at $30 and also the Lowest low of it was found to be $20.
We can calculate the Williams %R
Thus,
Williams %R = ($50 - $30) / ($50 - $20) x -100%
Williams %R = (20) / (30) x -100%
Williams %R = 0.667 x -100%
Williams %R = - 66.7%
As I already mentioned earlier in my summary, where I explained the scale of the Williams %R. You can now know where and what our value means if we put it on the scale. Here it is neither in the overbought or oversold. So, we can say that the market here was a little stable. Traders kept their assets.
The best setting for Williams %R
We have already gone through the indicator and have learned so much about it. The best settings for the indicator and to be used are 14 periods or days. By default, when you apply the indicator, it is set to 14 periods. This was so as the inventor of the indicator made his analysis and realized 14 periods was the best setting for the indicator.
But what other thing we should know is that the best settings could also be dependent on the trading style we are taking into consideration. Some traders would always prefer to use the short timeframes and others would use the long timeframes. This is dependent on the kind of trader. But that notwithstanding, it is always best to use the default until when a trader can locate a period that would best suit his style of trading which would take him through some testing and also confirmations.
Question 2
How do you interpret overbought and oversold signals with The Williams %R when trading cryptocurrencies? (Screenshot required)
Above is my explanation, I had explained the Williams %R and what its readings are. We know that the scale ranges from 0% to -100% where we can see the upper and the lower threshold. Which is stated in the indicator as a range of 0% to -20% as overbought and then a -80% to a -100% as an oversold.
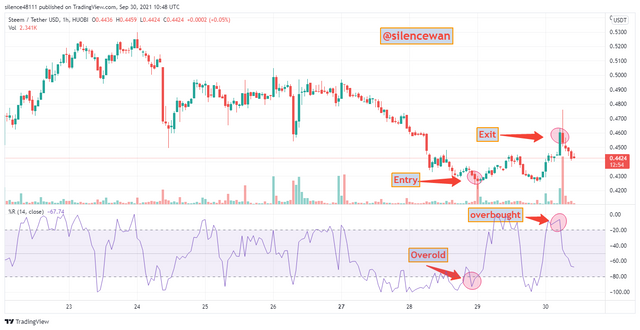
So basically, we know that when we experience an oversold price in the market, it means that the asset could be ready for a buy entry as I have indicated in my chart above,, and then when it hits the overbought it could also mean a sell or exit point. But this is always supposed to be confirmed by the indicator at hand as we know its best settings.
NB: A trader in the market should always exercise some patience, thus allowing a trend reversal to occur after an oversold or overbought has been achieved. This is so because there could be a long trend observed in an oversold or overbought which would always cause some kind of quick sell or quick buy. So, you always wait until there is a trend reversal before you make an entry. Either sell or buy.
Question 3
What are "failure swings" and how do you define them using The Williams %R? (Screenshot required)
The Failure Swings
When using the Williams %R indicator, we can always have such issues which are the Failure Swings. These are cases that occurs the value of the indicator oscillating is not able to meet the lines of the upper and lower threshold. The upper and lower threshold here are the lines of -20% and then that of the -100%. This mostly happens as a result of sideways movement of trends and also from very weak trends movement. This could all cause Failures swings.
So basically, what happens is that, a case where the Williams %R is heading towards the oversold region which is the upper threshold. A Failure swing could cause a trend reversal which or causing a sideways movement of the trend
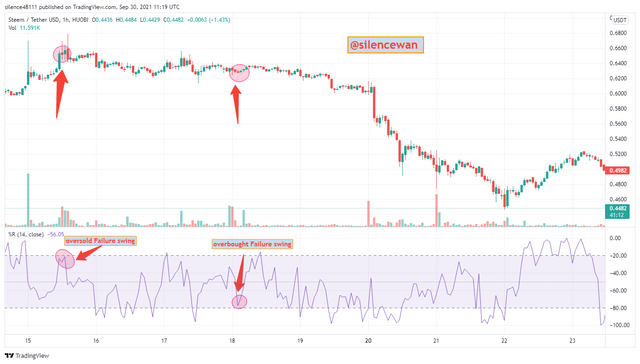
So as can be seen in the chart above, for the case of the overbought, we saw that the price headed towards the lower threshold which is the range of -80% to -100% but a very quick trend reversal occur before that was met which happened at the value of -78.10% thereby causing a Failure Swing in the case of the overbought.
Also, for that of the oversold, a similar thing happened. As the trend was heading towards the upper threshold which is the range of 0% to -20%, there was also a quick reversal of the trend cause a Failure Swing and this also happened at the value of -21.55%.
So with the above mentioned, that is what Failure Swings mean and how they occur in the Williams %R indicator.
Qustion 4
How to use bearish and bullish divergence with the Williams %R indicator? What are its main conclusions? (screenshot required)
Divergence with the Williams %R indicator
For divergence to occur then there is always some kind of difference that happens between the trend movement and also the indicator lines. Divergence results in price movement after trend reversals.
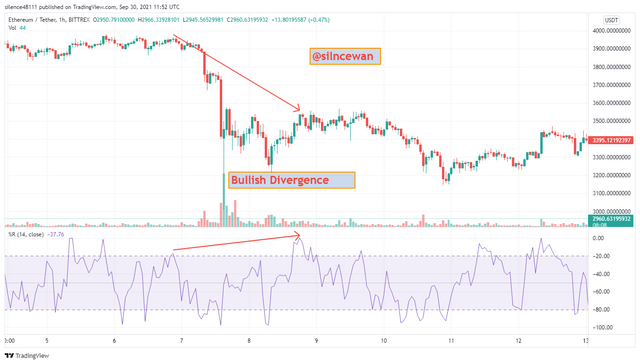
Let’s consider a Bullish Williams %R Divergence
So, for a bullish divergence to occur, then there is always an observation of the indicator following an uptrend as the price of the asset goes donor falls.
It is always said to be a buying opportunity as sellers seem to be weakened and prices heading towards reversal.
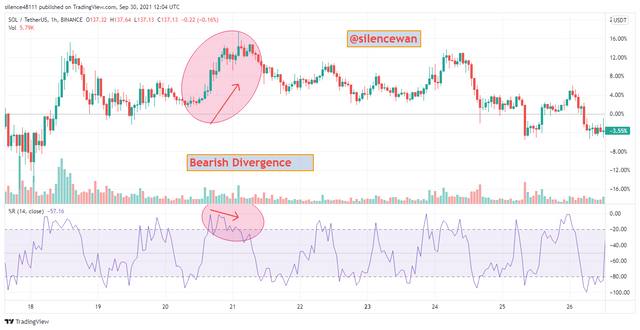
Let’s consider a Bearish Williams %R Divergence
We have seen how the Bullish works, for the case of the Bearish, it mostly occurs when price movement is on rising and the William %R is going on a downtrend. Buyers in this regard get weaker as trend reversal of prices could occur thereby making it a good exit.
Conclusion
Divergence together with the Williams %R is just ways to strengthen the effectiveness of the indicator. This would help traders in spotting movements of trends when they seem not in line as expected and a major factor that could help traders in their trades in the market.
Question 5
How do you spot a trend using Williams %R? How are false signals filtered? (Screenshot required)
Spotting trends using Williams %R
We have already gone through a lot of scenarios and we know that, the Williams %R indicator can be used to spot trend reversals and trends movement. This movement and reversals is observed with the help of the scaling on the indicator. But sometimes we have to take all chances into consideration.
Using a single indicator is mostly not advisable cause of some lags. That is the more reason we would be introducing the combination of the Williams %R and that of the Exponential Moving Average EMA.
So, the EMA would mostly find and then filter out all false signals available in the chart. Both are taken under its default settings that is to 14 periods.
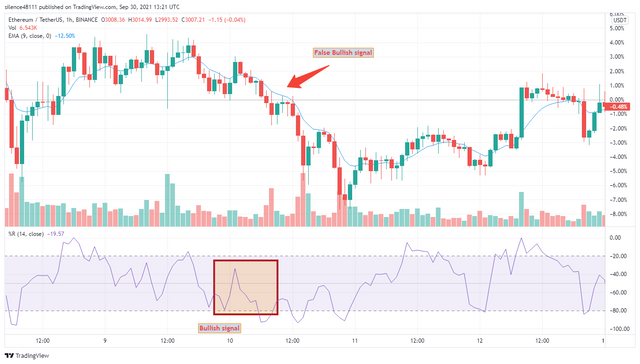
Detecting False signals with the Williams %R and the EMA. We can see that all though the indicator line headed towards the lower threshold which is the -80% mark and a trend reversal. But take a look at the EMA, the EMA line is above the price of the asset. Which makes us detect a false signal there. The price shouldn’t serve as resistance to the EMA for a good trend.
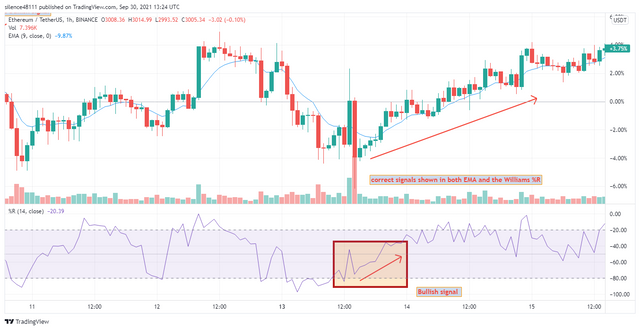
From the chart above, you can clearly see that, as the line of the indicator of the Williams %R moved towards the lower threshold region which is the -80% line, in which we consider it to be an oversold. There was also a quick trend reversal which could mean that there was a bullish trend suspected and you can see that it has clearly been confirmed by the EMA as the moving line of the EMA quickly fell below the price movement and served as a point of resistance to the price movement. So basically, this is how trends are spotted when using the Williams %R indicator with the EMA.
Question 6
Use the chart of any pair (eg STEEM/USDT) to present the various signals from the Williams %R indicator. (Screen capture required)
I would be presenting the various signals using the chart of STEEM/USDT.
Let’s take first, Buy Signal
With the help of the Williams %R indicator and that of the EMA, I would gladly show in the chart where to pick up a buy entry. We already know that, for a buy entry to occur, it should happen immediately after an oversold has occurred. Thus, after the line of the Williams %R indicator moves above the -80% line and then a trend reversal above the it. We could locate our buy entry at that point.
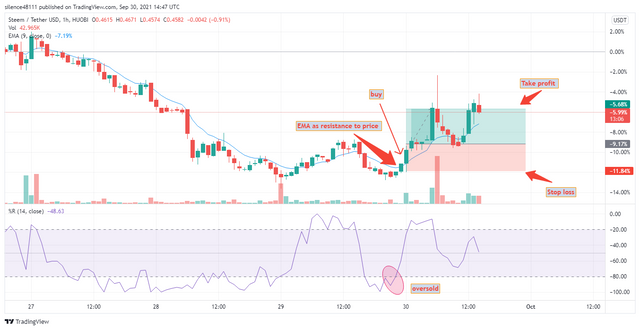
I have used a chart of STEEM/USDT and we have seen in my chart above, using the Williams %R indicator. I was able to locate my buy point as the line of the indicator hit the -80% which is taken as an oversold and a quick reversal above it. This way I was able to notice that a bullish trend had occurred which will also represent a buy entry point.
The EMA helped me confirmed that there were no false signals as I was finding a suitable point for my buy entry.
We have seen in my chart that, immediately the quick trend reversal, the EMA moving line formed or served as a point of resistance to the price which also confirms my entry point. I used a risk reward ratio of 1:2
We again do for Sell Signal
Again, we know that, for us to locate a sell signal using the Williams %R, we would look carefully to find a place where there was an overbought price. Thus, the line of the Williams %R indicator would move above the -20% line. So, I would use it in line with EMA so I could ignore false signals. Also set to its default settings.
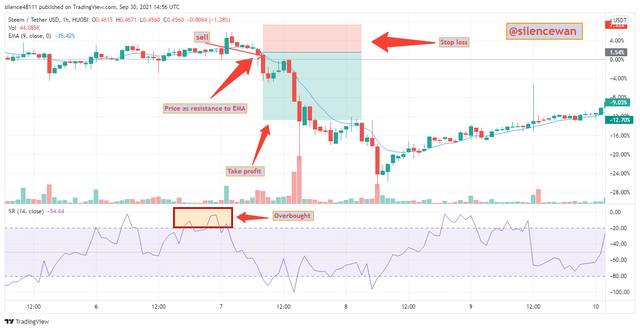
In my chart above you can see clearly that, I was able to locate my overbought. Where the line went above the -20% and a quick fall below it. This represented a bearish trend reversal, which could make sellers come into the market now.
Now the presence of the EMA was to reduce false signals a give us a very good selling point. You can see that as it reached an overbought and then fell below it.the EMA went above the price movement. So, allowing price to form a resistance to EMA which totally justifies our entry. I also used a risk reward ratio of 1:2 in this chart again.
CONCLUSION
This has been one of the indicators I have really liked based on the easy way to use of it. The Williams %R indicator is a technical indicator that helps in determining price overbought and oversold as its keeps oscillating. This indicator we have leaned previously that it was created in the year 1973 by Larry Williams.
We have also learnt about the indications involved in the indicator and what they represent. The indicator is scaled from 0 to -100% where 0 to -20 means an overbought and -80% to -100% means an oversold.
This indicator has actually been my favorite one upon learning it.
I would like to give great thanks to professor @kouba01 for always bringing onboard to the steemit crypto academy search nice indicators that helps traders in their daily trades.
Thanks once again for the week has been great professor.
Hi @silencewan
Thanks for participating in the Steemit Crypto Academy
Feedback
Fairly done. Your article lacked an in-depth analysis in regards to trading using the William %R indicator. Kindly put more effort into your work.
Total| 6/10
I spent over 6 hours on this task. I need clarification on where I did not meet demands of the question asked by professor @kouba01.
Cause looking at the works he has marked and mine. I’ve not really seen much difference to the compliance of the task.
I really need further clarification. If I’m further marked down with much justification I would be grateful. But this is not okay.
In depth analysis was giving here from the work carried out. The various tasked given was all checked systematically. So I do not understand why my whole work was concluded as such if there has been various questions asked.
If you could be clear I would be grateful
I have participated in a lot of class with professor @kouba01. And I have always taken much time in his works due to how delicate they are. So I’m really not quite certain about this.
Hello professor @yohan2on. I’ll be glad if you could point specifically where I was able to meet demands in using the Williams %R indicator.
I really feel I placed much efforts in this task.
If you could please let me know where I lacked technical analysis I would be grateful.