CRYPTO ACADEMY SEASON 3 WEEK 7 / STOCHASTIC OSCILLATOR AND PARABOLIC SAR / HOMEWORK POST FOR PROFESSOR @ lenonmc21

Today am here to present home work task for prof @lenonmc21 .The lesson was so simple to comprehend,Without wasting much time i would like to start my work immediately.
Define in your own words what is the Stochastic Oscillator?
Stochastic Oscillator: Can be simply define as an indicator which is purposely used in technical analysis,Which displays the power of price movement at a small period of time.This also help all traders to check if the price of an assest has overbought or oversold.This also shows all the previous history on market to give a gesture, consequently they utilize closing prices and place of price in a specified period of time.In the year 1950,A man called George Lane put up this indicator.With the Stochastic Oscillator is very needed is getting all the trend reversal on market and is very important to all traders.Usually the use of % k and % D lines is use to display if the assets has being overbought or oversold. 14 time periods is the suggested time period for Stochastic Oscillator on market.

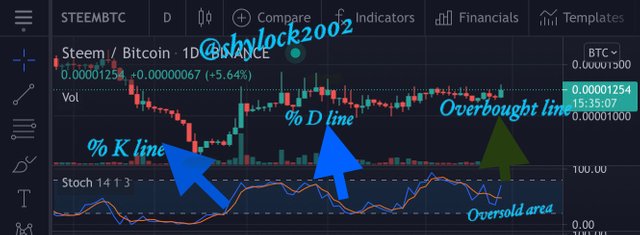
Explain and define all components of the stochastic oscillator (% k line,% D line + overbought and oversold limits).
% K line
Usually people use to call it the speedy of fast Stochastic Oscillator,They constitute the new price momentum of their values.Due to the movement of the % K line over the % D line trade sign are made.To get the % K,You will subtract the lowest price from the last closing price,And you will divide with lowest price substract highest price and you time by 100.This is simple represented as
%K =(Last closing price - Lowest price) / (Highest price - Lowest price) x 100.
% D line
People usually call it the signal line,Combine with our K line they will give rise to signal for all trades,But this line is not fast as the % K line,It is also a intermittent moving average.This line is very useful because it gives signals to their trades.
OVERBOUGHT LIMIT.
This is the facing of oversold.Whenever we say an assests has been overbought we mean stochastic oscillator has been seen in the line of 80 to 100.This is to show the turnaround of the bullish trend is about to happen.This also help to monitor all the assest condition on market before you start your trading.
OVERSOLD LIMIT.
When we say oversold limit it means the indicator has being able to propose an assest has oversold and is about to have a lift up in the price value.Whenever the reading of % K is less than 20 we set up the oversold limit.The buying signal is cause whenever the value goes below 20 spot and later goes above the 20 spot.

Briefly describe at least 2 ways to use the Stochastic Oscillator in a trade.
- Support and resistance.
Stochastic Oscillator is really helping trading in so many ways,That is helping them have an idea to their contributions and request areas.It also give a hints to all the traders about contributions and request area of an assests.
- Stochastic crossover
Is really giving rise to signal for it trade.Is mostly the crossing from one side to the other of % k and % D line.Whenever the % K line extend above the % D line in a oversold area it causes a buy in signal,Whiles whenever the % K line extend below the % D line in overbought area a signal in sell matters.

Define in your own words what is Parabolic Sar?
Parabolic Sar Is a tool usually used by traders to carry out their technical analysis. J. Welles Wilder Jr is one who created this indicator.The indicator is also use for checking trend reversal power of a new time trend,It is also very important in the appearance and close point tips of the trade.Parabolic Sar reveals to be a broken line on the price on market chart of an assest.It usually reveal up or down of the price bar determining on the new trend on market chart.Whenever the price bar is up the chart there is a bearish trend whiles whenever the price bar is down the chart there is a bullish trend.

Explain in detail what the price must do for the Parabolic Sar to change from bullish to bearish direction and vice versa.
As I stated,Parabolic Sar bullish is drawn down the price bar.To make Parabolic Sar swap from bullish direction to bearish the price must be able to be in contact or touch the parabolic sar.This will make the uptrend moving to swap it way to a bearish trend.This will lead the trend to move from bullish to bearish trend.
As I stated, Parabolic Sar bearish is drawn from up the price bar.To make the parabolic sar swap from bearish to bullish direction the price must be able to be in contact or touch the parabolic sar upwards down.This is going to show a sign in the reversal of the in progress trend.

Briefly describe at least 2 ways to use Parabolic Sar in a trade?
- MAKING EXIT POINT.
When it comes to parabolic Sar is always use for detecting when the bullish trend is reversed to a bearish trend.When it get to this level it means the price of the assest is about to drop.When your try to trade at this moment is either you make profit or you end a loss.
- FOLLOWING THE TREND
Parabolic sar is recommended as one of the good indicator for following assests.It is precisely use for a bullish or bearish market trend.It also use for regulating the direction of an assest in specific period of time.Whenever the price bar is put below the chart price is a bullish trend whiles whenever the price bar is put above the chart price is a bearish trend.

PRATICALS
You first need to click on this link this will help you to add stochastic oscillator to your chart.
After clicking on the link,A new page will appear.I will be showing screenshot below.

You will then click on the setting icon,Located at the top left corner on my screenshot.I will be showing screenshot below.

After clicking on the setting icon,A small pop up menu will display and choose chart.I will be showing screenshot below.
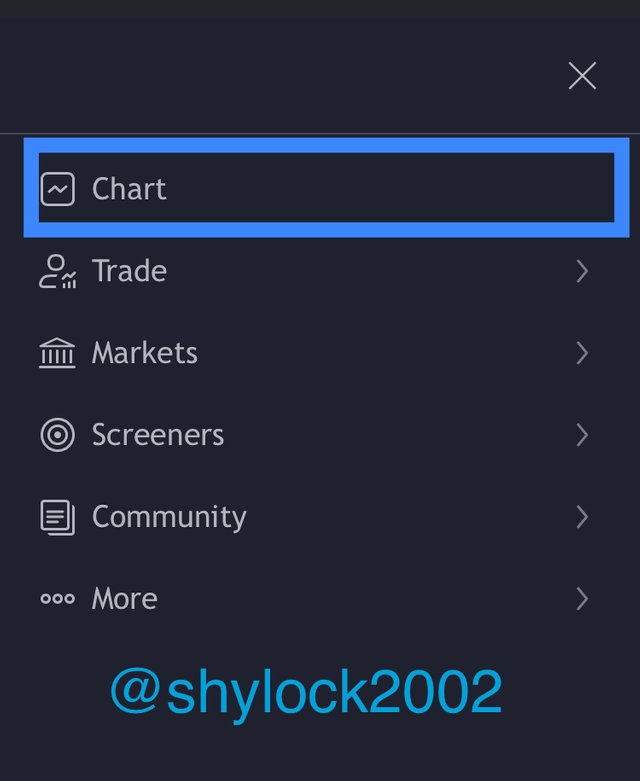
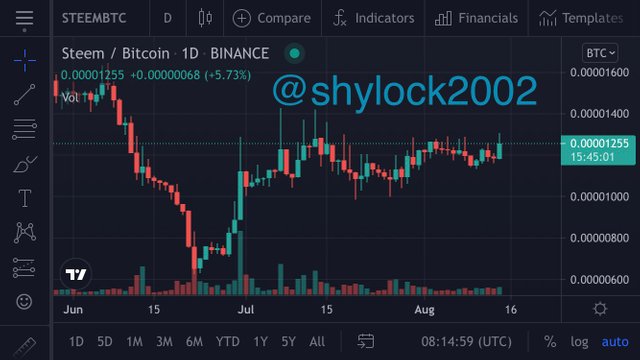
After clicking on the chart,I will display your chart page.I will be showing screenshot below.
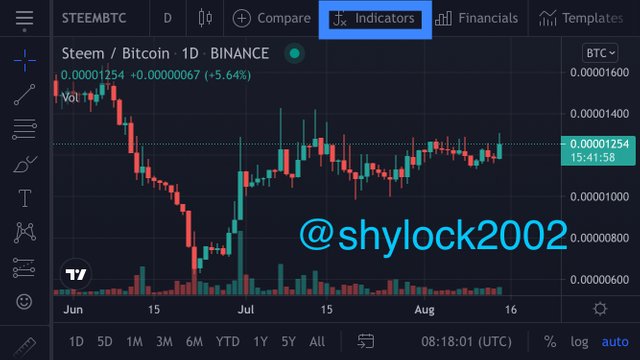
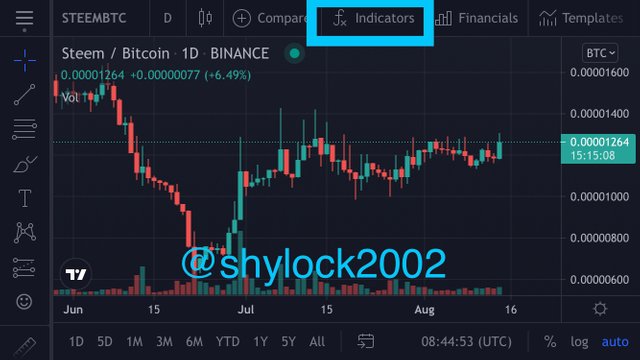
You will then locate Fx(indicator and strategy) on top of your chart and click on it.I will be showing screenshot below.
After clicking on the Fx a pop up menu will display,You will then search for stochastic in the searching box and clicking on.I will be showing screenshot below.
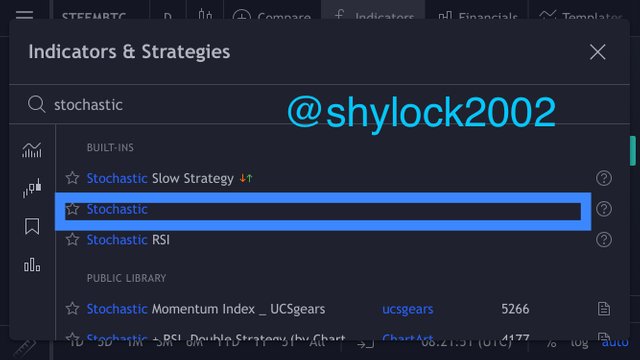
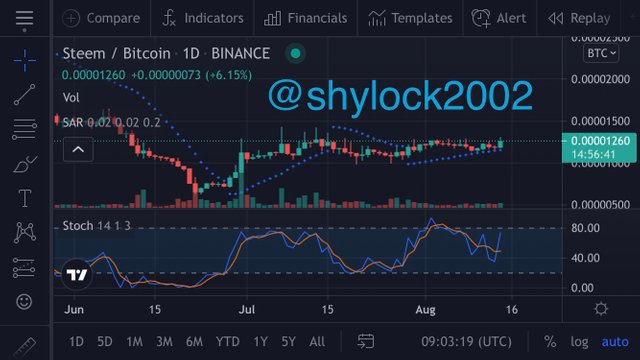
After clicking on the stochastic it will be added to my chart,I will be showing screenshot below.

PRATICALS
Before you can add Parabolic Sar,You need to click on chart,And look for Fx(indicators and strategic) from the top of your chart and click on it.I will be showing screenshot below.
After clicking on the Fx,You will then search Parabolic Sar in the searching box and click on it.I will be showing screenshot below.
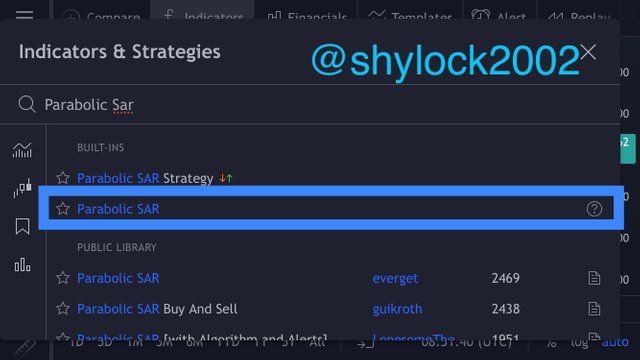
After clicking on it,I will be added to your chart.I will showing screenshot below.
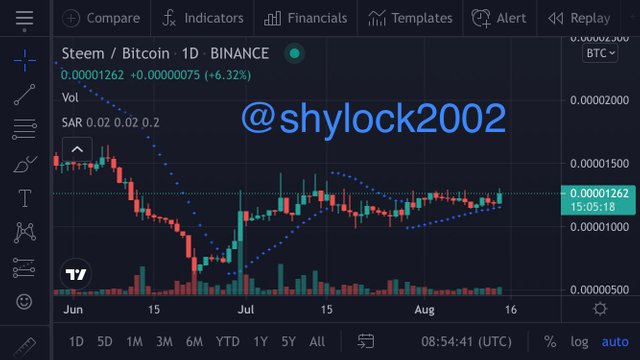
You all can see from my picture above.The short blue lines under the price chart is term as bullish trend,While the short blue line up the price chart is term as bearish trend.

PRATICALS

CONCLUSION
A very big thanks to prof @lenonmc21 .For such a great lesson.I have really learn a lot.Due to the help of this lesson I can now add my own indicators to my chart.