Support and Resistance Breakouts - Crypto Academy / S6W3 - Homework post for pelon53
Hello everyone and welcome back. Another week of this learning series has been started and we all are very keen and excited to learn and explore new facts about the crypto world. In this lesson, the professor @pelon53has taught us about the "Support and Resistance Breakouts". This is my homework task.
.png)
Question 1
Explain in detail the advantages of locating support and resistance on a chart before trading.
The support and the resistance are the important price levels where the selling pressure and buying pressure is visible and price of the assets is expected to move back to its previous original direction. The buying and selling pressure get generated because of aggregation of the particular sort of the orders at these points/levels. The number of the times, the price reacted around these price levels before is use to determine how strong the support and resistance level is. The resistance and support are the best level where the traders can take best trading decisions to enhance their profit and decrease the lose ratio. There are basically three types of the support and resistance level in the crypto market which can be used for this regard.
The traders should have knowledge enough to locate the support and resistance level because these are the price reversal points where the price of coin can start moving in opposite direction. Locating the support and resistance level help the traders a lot to do the best trading decisions at best time to get the high profit.
The support and resistance level also help the traders to find the key price point in the market. The price rise up or goes down. It all because of the traders behavior toward the crypto world. Identifying the key price points helps the traders to take the best trading decisions at the best timing. The price tend to react at the resistance and support level. When we combine other indicators with support and resistance, we get more accurate, appropriate and effective results.
.png)
.png)
Not only this, the support and resistance actually produce the useful trading signals for the traders. The traders can utilize those signals to get the high gain.
.png)
- Resistance Level
The resistance level is an area where the price stop increasing up further, the buying pressure expected to pause and price is expected to bounce back. At this level, the sellers enter into the market and stop price increasing more, a lot of pending selling orders get executed because of which, price start moving in opposite direction and trend get reverse. This is the level where the buying pressure pause, the selling pressure increase which prevent the price to move further in upward direction. Because of consolidation of a large number of selling orders at the resistance level, the price bounce back resulting in trend reversal.
Breaking the resistance level in possible only with large number of the buying orders. When the buying pressure get high, price increase and the bullish movement start. The traders should take the important trading decisions at time of breakout of resistance level.
.png)
The strength of the resistance level depend on the time frame within which the resistance level identified. When the resistance level identified for short time period, it is usually unaffected. But when the resistance level is identified for large time frame, it is more effected.
.png)
The support is an area where the price stop decreasing up further, the selling pressure expected to pause and price is expected to bounce back. At this level, the selling pressure get exhausted and the buyers enter into the market and stop price decreasing more, a lot of pending buying orders get executed because of which, price start moving in upward direction and trend get reverse. This is the level where the selling pressure pause, the buying pressure increase which prevent the price to move further in downward direction. Because of consolidation of a large number of buying orders at the support level, the price bounce back resulting in trend reversal.
Breaking the resistance level in possible only with large number of the selling orders. When the selling pressure get high, price decrease and the bearish movement start. The support level get break then. The traders should take the important trading decisions at time of breakout of resistance level.
.png)
The strength of the support level depend on the time frame within which the support level identified. When the support level identified for short time period, it is usually unaffected. But when the resistance level is identified for large time frame, it is more effected
.png)
Question 2
Explain in your own words the breaking of supports and resistances, show screenshots for the breaking of a resistance, use another indicator as a filter.
The breaking of the resistance/support level is known as the breakout of resistance/support level. The resistance and support are the levels between which the price move when it is in ranging zone. At this point, the price have no clear direction. It moves up and hit the resistance level. The sellers push back the price downward. The price bounce back to support level. The buyers again pull the price upward and price push back to upward direction. Again it hit the resistance and continue its cycle. Nor buyers, neither sellers are in control at this point. But when the buyers or sellers enter into the market with high pressure, the price just breakout the support/resistance level and move in a particular direction. Thus the breakout occur.
After breakout a new trend is start. So the breakout are the trend reversals and have very good opportunities for the traders to place the trading orders. The breakout of support and resistance level produce very useful trading signals. These are the points where price is tend to react. So the traders should get the reversal points very sharply in order to get the high profit.
- Breakout of the resistance level
The resistance level is an area where the price stop increasing up further, the buying pressure expected to pause and price is expected to bounce back. At this level, the sellers enter into the market and stop price increasing more, a lot of pending selling orders get executed because of which, price start moving in opposite direction and trend get reverse. This is the level where the buying pressure pause, the selling pressure increase which prevent the price to move further in upward direction. Because of consolidation of a large number of selling orders at the resistance level, the price bounce back resulting in trend reversal.
Breaking the resistance level in possible only with large number of the buying orders. When the buying pressure get high, price increase and the bullish movement start. The traders should take the important trading decisions at time of breakout of resistance level.
The strength of the support level depend on the time frame within which the support level identified. When the support level identified for short time period, it is usually unaffected. But when the support level is identified for large time frame, it is more effected.
The above is the chart where the price was first moving in ranging zone. There was no clear direction. Then price break the support level and started moving downward. The downtrend started after that breakout. This is the best time to exit from the market.
- Break and Retest of A Resistance Zone with RSI indicator
In the below screen short, The price was just moving in ranging zone. There was no clear direction. The buyers and sellers had the same control. No one was dominant on the market. The sellers were pushing the price downward while buyers pulled the market upward. Thus having the same potential, market was just moving between the support and resistance level.
The the buyers enter into the market with great potential and broke the resistance level. Now the price started moving above the resistance level. Now the resistance level will serve as the support level. The price will again come back to retest the breakout toward the support level which was the resistance level before the breakout. When the price will come back to retest the breakout, the trend reversal will be confirmed. I have added to RSI to explain it with more clarity.
.png)
In the ranging zone, the price was below the 50 bands. When the price broke the resistance level, the RSI also started moving above the 50 bands which provide the buying opportunity and provide the uptrend signals. When the price come back to the previous resistance level to retest the breakout, it will confirm the breakout. Moreover, the RSI upward movement will also confirm it. Now when price will start moving again upward, we will place the buy order at the buy candles near to the support level or when the previous high would be break
Question 3
Show and explain the break of a support, use an additional indicator as a filter, show screenshots.
The support is an area where the price stop decreasing up further, the selling pressure expected to pause and price is expected to bounce back. At this level, the selling pressure get exhausted and the buyers enter into the market and stop price decreasing more, a lot of pending buying orders get executed because of which, price start moving in upward direction and trend get reverse. This is the level where the selling pressure pause, the buying pressure increase which prevent the price to move further in downward direction. Because of consolidation of a large number of buying orders at the support level, the price bounce back resulting in trend reversal.
Breaking the resistance level in possible only with large number of the selling orders. When the selling pressure get high, price decrease and the bearish movement start. The support level get break then. The traders should take the important trading decisions at time of breakout of resistance level.
.png)
The strength of the support level depend on the time frame within which the support level identified. When the support level identified for short time period, it is usually unaffected. But when the support level is identified for large time frame, it is more effected.
Break and Retest of A Support Zone with RSI indicator
In the below screen short, The price was just moving in ranging zone. There was no clear direction. The buyers and sellers had the same control. No one was dominant on the market. The sellers were pushing the price downward while buyers pulled the market upward. Thus having the same potential, market was just moving between the support and resistance level.
The the sellers enter into the market with great potential and broke the support level. Now the price started moving above the support level. Now the support level will serve as the resistance level. The price will again come back to retest the breakout toward the resistance level which was the support level before the breakout. When the price will come back to retest the breakout, the trend reversal will be confirmed. I have added to RSI to explain it with more clarity.
.png)
In the ranging zone, the price was above the 50 bands. When the price broke the support level, the RSI also started moving below the 50 bands which provide the selling opportunity and provide the downtrend signals. When the price come back to the previous support level to retest the breakout, it will confirm the breakout. Moreover, the RSI upward movement will also confirm it. Now when price will start moving again downward, we will place the sell order at the sell candles near to the new resistance level or when the previous low would be break.
Question 4
Explain what a false breakout is and how to avoid trading at that time. Show screenshots.
The break out are the points when the price break the support and resistance level and start moving in opposite direction. Breakouts are actually the trend reversal spots. The traders can make the best trading decisions when the breakout occurs. There are two types of the breakouts.
- False Breakouts
- Successful Breakouts
- Successful Breakout
The successful breakout occur when the price start moving in the expected opposite direction after the breakout occur. When the price break the support level and start moving in downward direction, it is said that the successful breakout occur. When the price break the resistance level and start moving in upward direction, it can be says that the successful breakout have been occurred.
In the below chart, i have identified a successful breakout. The price was moving between the support and resistance level. The price kept bouncing back and pulling up and kept on moving between these two levels. But then it broke the resistance level and started moving upward direction. The uptrend occur. This is successful breakout. The traders can have great profit by utilizing this breakout and trend reversal spot. In successful breakout, the price move in direction of the breakout.
The break out are the points when the price break the support and resistance level and start moving in opposite direction. Breakouts are actually the trend reversal spots. The traders can make the best trading decisions when the breakout occurs. There are two types of the breakouts.
- False Breakouts
- Successful Breakouts
- False Breakout
When the price break the support or resistance level and expected to move in opposite direction. But when it again start moving in the previous direction, the false breakout occur. The false breakouts are occurred because of the moves of the whales and big hand investors when they want to make their own benefit by trapping the small traders.
- Successful Breakout
The successful breakout occur when the price start moving in the expected opposite direction after the breakout occur. When the price break the support level and start moving in downward direction, it is said that the successful breakout occur. When the price break the resistance level and start moving in upward direction, it can be says that the successful breakout have been occurred.
In the below chart, i have identified a successful breakout. The price was moving between the support and resistance level. The price kept bouncing back and pulling up and kept on moving between these two levels. But then it broke the resistance level and started moving upward direction. The uptrend occur. This is successful breakout. The traders can have great profit by utilizing this breakout and trend reversal spot. In successful breakout, the price move in direction of the breakout.
The following is the false breakout occurrence where the price broke the support level and started moving downward direction. The downtrend was expected and coin was assumed to move in direction of breakout. But the coin started moving opposite direction to the breakout and continue its previous movement direction. This was the false breakout
.png)
Below is another false breakout which i have been found on the chart of a coin. The price was in the uptrend. The coin price was moving between the resistance and support level. Then the price broke the resistance but came back again to downward and started moving in ranging zone. Then it broke the support and move downward.
.png)
The following is the false breakout occurrence where the price broke the support level and started moving downward direction. The downtrend was expected and coin was assumed to move in direction of breakout. But the coin started moving opposite direction to the breakout and continue its previous movement direction. This was the false breakout
Now we have two types of the false breakouts resistance false breakout and support false breakout.
Resistance/Bullish False Breakout
The bullish false breakout is one when the price break the resistance level but fail to continue their movement in upward direction. After the break of the resistance level, the coin is expected to rise up. But when, instead of moving up, coin start falling again down continuing its previous trend, it is known as the bullish false breakout where the coin is not able to continue its bullish movement after the bullish breakout.
In the above screen short, the price broke the resistance and now the uptrend was expecting. But after a bit upward movement, more sellers with high potential entered into the market and coin started moving downward back to its previous direction. The coin couldn't continue its direction following the resistance breakout.
Support/ Bearish False Breakout
The bearish false breakout is one when the price break the support level but fail to continue their movement in downward direction. After the break of the support level, the coin is expected to decline. But when, instead of moving down, coin start rising again up continuing its previous trend, it is known as the bearish false breakout where the coin cannot continue to move in the its bearish breakout direction .
In the above screen short, the price broke the support and now the downtrend was expecting. But after a bit downward movement, more buyers with high potential entered into the market and coin started moving upward back to its previous direction. The coin couldn't continue its direction following the support breakout.
The false breakout can bring a heavy disaster for the traders. When the traders take the important trading decisions after the occurrence of the resistance or support breakout and that breakout switch into false breakout, then the traders face lose of their capital. For this, we should always use some other indicators along with support and resistance to get the effective and authentic signals. I have combined the volume indicator and RSI to filter out the false breakout and to confirm the rest breakout.
I have used the RSI and volume indicator below. The price was in the ranging zone at first. The price was moving between the support and resistance zone. Whenever it hit the resistance, it got bounce back and started moving downward, whenever it got hit by the support level, it pulled upward and thus it continued it motion between these two levels. But then the coin break the resistance level and move upward direction. This indicate the trend reversal and start of new trend. The coin started rising after the breakout.
The success of the breakout was confirmed by the volume indicator. Before the breakout, the volume of the coin was low. There was no high on the volume. But then the breakout occur and we can see that the breakout was confirmed by the volume indicator too as the volume indicator show the great volume.
When moving upward, the RSI cross the 50 level and the volume indicator also showing the great volume in the upward sense, we should make an entry. I set the stop lose, take profit and execute my buy order because the RSI is above 50, so it would be best to enter into the market to have the high profit when price will reach up.
.png)
The below is another coin which was trending in ranging zone. The price was moving between the support and resistance zone. Whenever it hit the resistance, it got bounce back and started moving downward, whenever it got hit by the support level, it pulled upward and thus it continued it motion between these two levels. But then the coin break the support level and started moving in downward direction. This indicates the trend reversal and start of new trend. The coin started falling after the breakout.
The success of the breakout was confirmed by the volume indicator. Before the breakout, the volume of the coin was low. There was no high on the volume indicator. But then the breakout occur and we can see that the breakout was confirmed by the volume indicator too as the volume indicator show the great volume.
When moving downward, the RSI cross the 50 level(confirming the downtrend) and the volume indicator also showing the great volume in the downward sense, we should make an entry. I set the stop lose, take profit and execute my sell because coin is declining and if i don't sell my coin now, i would have a heavy lose.
.png)
Question 5
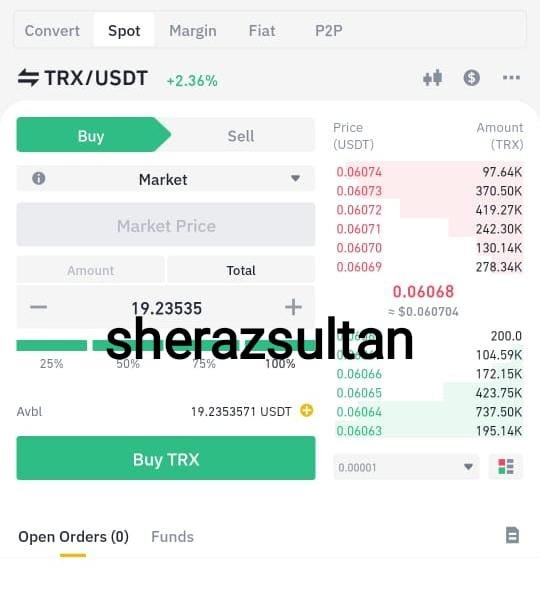
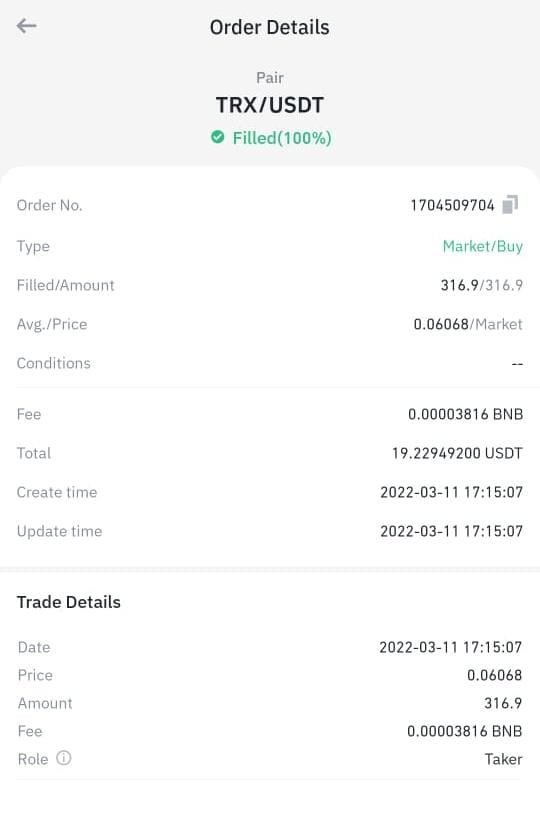
On a demo account, execute a trade when there is a resistance breakout, do your analysis. Screenshots are required.
The below is the screen short where the price of coin was moving in ranging zone between. Then the buyers enter in more potential and they broke the resistance level. A new high was formed. Now the uptrend is expected after the bullish breakout. The resistance has now turned into the support level. Then the price will come back downward to retest the support level to confirm the bullish breakout. When it retest, the bullish breakout got confirmed.
.png)
Now we should place an order. For this we will wait for the bullish candle to appear at the retest point. The bullish candle presence indicate that the buyers are buying the coin and the uptrend is expected now. We should also make an entry by setting the stop lose and take profit.
Question 6
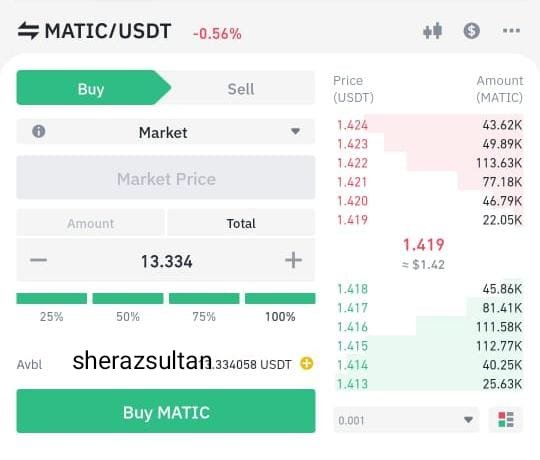
In a demo account, execute a trade when there is a support break, do your analysis. Screenshots are required.
The below is the screen short where the price of coin was moving in ranging zone between. Then the sellers enter in more potential and they broke the resistance level. A new low was formed. Now the downtrend is expected after the bearish breakout. The support has now turned into the resistance level. Then the price will come back downward to retest the support level to confirm the bearish breakout. When it retest, the bearish breakout got confirmed.
.png)
Now we should place an order. For this we will wait for the bearish candle to appear at the retest point. The bearish candle presence indicate that the bearers are buying the coin and the downtrend is expected now. We should also make an entry by setting the stop lose and take profit. Or we can place the order when the coin make a low high while retesting the resistance level.
.jpeg)
Conclusion
Resistance and support are the point where price ten to react fastly. The support and resistance level are created because of the traders behavior in the market. I have explained the support and resistance level, the advantage of support and resistance level and false breakout. We should be very careful about the false breakouts. Some strategy should be adopted in order to safe from lose because of the bullish or bearish false breakout. I have made a strategy by combing the Volume and RSI indicator.
I have also explained how the false breakout occur in bearish and bullish scenarios. I enjoyed learning the concepts from today's lecture. Thanks to professor @pelon53 for this amazing effort.