Dynamic Risk Management in Cryptocurrency Trading
|
|---|
Hope you all are doing well and good and enjoying the best days of your life. This is me @shahid2030 from Pakistan and you are here reading my post. You all are welcome here from the core of my heart.
This is my participation in a contest Dynamic Risk Management in Cryptocurrency Trading organized in SteemitCryptoAcademy by @crypto-academy.
Question 1: Foundations of Risk Management. Explain the principles of risk management in cryptocurrency trading. Discuss key practices such as position sizing, stop-loss placement, and diversification, with examples relevant to the Steem/USDT market. |
|---|
Risk Management is the most important thing, especially when it comes to crypto market where the market is too much volatile. You may see too much fluctuations with in the prices in short period of time. Risk Management in crypto actually means; identifying, assessing, and mitigating potential losses while maximizing gains. It can be achieved using different principles.
1. Position Sizing
First thing is position sizing. It means managing the amount of capital you are allocating in a single trade. It should always be the amount that you can efford to lose, so to avoid significant lose.
Method: Set a percentage you want to allocate on a single trade. It may be 2% or 3% of your total investment. Expert traders avoid to to exceed it from 5%. Example; You have $2000 in your portfolio you want to open a long trade on STEEM/USDT, with just 2% of your capital buy it only of $40.
2. Stop-Loss Placement
Stop loss is a point where we want to get exist of of the trade, by accepting a small amount of Lose. Those who don't use stoploss are mostly seen liquided by the market. According to me to prevent liquidation or significant lose stoploss is the most important thing.
Method: Always keep stoploss near the important levels. In long trade keep it below the important level, while in short trade keep it above important levels. Be important levels we mean, trend line, support or resistance or other important pattern in the market. Example we want to go long on STEEM/USDT, the current price is $0.26. Our Analysis says we have important support at 0.23, so we should keep our stoploss below this level (somewhere at 0.2280).
3. Diversification
This is another important method of decreasing significant loses. By diversification we means, spreading our portfolio in different assets. In it we avoid putting all our portfolio just in one coin, instead we buy many solid and strong projects coins we are sure about.
Method
Divide your portfolio into different parts; first a large amount should be for coins with large marketcap, second should be for small market cap high potential coins and third should be for meme coins (. a small amount). Example I have have $1000 I will keep $550 for top alt coins, $300 for small market cap and something $150 for meme coins.
Some other best strategies
Risk-Reward Ratio: the best risk to reward ratio is 1:1 and 1:2. You open a trade and you keep your stoploss at $5 lost, then your Take profit (TP) should be at $10(1:2) profit or at least $5 (1:1)
Complete Market Analysis: Combine technical analysis (support, resistance, important chart patterns) and fundamentals analysis (STEEM latest updates) and use them parallel.
Emotional Discipline: Don't allow emotions to get control over you, instead take emotions in your control. Always try to avoid impulsive trading decisions driven by fear or greed.
Question 2: Calculating Risk-Reward Ratios. Using historical. Steem/USDT data, demonstrate how to calculate the risk-reward ratio for a trade. Provide a practical example, including entry and exit points, to highlight how this metric guides decision-making. |
|---|
The risk to reward ratio (RRR) is a metric we generally use in trading to compare the potential profit of a trade to its potential loss. We decide our trade in a way that, our profit is always more than the lost. It depends; some people keep it 1:1, some keep it 1:2 and some pro traders keep it up to 1:5. Their is a specific formula calculation risk to reward ratio, which is.
Risk to reward ratio = total lost ÷ Total profit.
Historical Steem/USDT data to determine Risk to Reward Ratio.
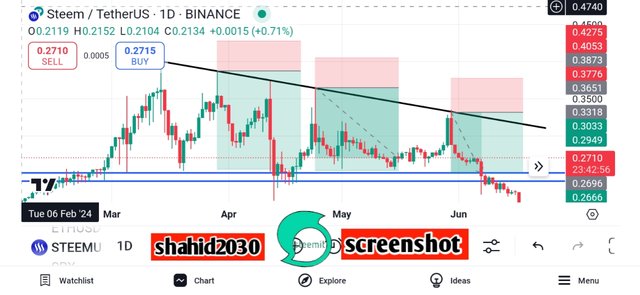
This is the one day time frame Chart of STEEM/USDT. Steem at that zone was in downtrend. It highly respected that trend line, 5 times. I have figured out 3 trade with best entry and exit points.
| First trade |
|---|
| Trade nature: Short trade |
| Entry: $0.38 |
| Stoploss: $0.42 |
| Take profit (target): $0.25 |
| Risk to Reward Ratio (RRR): 1:3.2 |
| Second Trade |
|---|
| Trade nature: Short trade |
| Entry: $0.36 |
Stoploss: $0.40
Take profit (target): $0.25 |
Risk to Reward Ratio (RRR): 1:2.8|
| Third Trade |
|---|
| Trade nature: Short trade |
| Entry: $0.33 |
| Stoploss: $0.37 |
| Take profit (target): $0.25 |
| Risk to Reward Ratio (RRR): 1:2.1 |
These are three short trades on daily time frame with exact entry point, stoploss, take profit and a well managed risk to reward ratio. Here our target for all the trades are $0.25 because we have an important level there (support). Price has always shown a huge respect to it. Our stoploss based on previous high, it is kept above it in each trade.
Question 3: Leveraging Volatility Indicators. Analyze how volatility indicators like Bollinger Bands or Average True Range (ATR) can be used to manage risks in volatile markets. Use a chart to illustrate how these tools inform stop-loss adjustments and position sizing. |
|---|
Volatility indicators like Bollinger Bands and Average True Range (ATR) are the best trading tools that provide critical insights into market volatility, helping traders manage risks effectively in volatile markets. Let's have an overview of both of them using practically on STEEM/USDT Chart.
Bollinger bands
Bollinger bands generally consist of three lines; an average line (middle band), upper band and lower band. Usually people trade it, when the price touch Lower band they go for long position and when it touch upper band they go for short. Let me use my own three strategies on it.
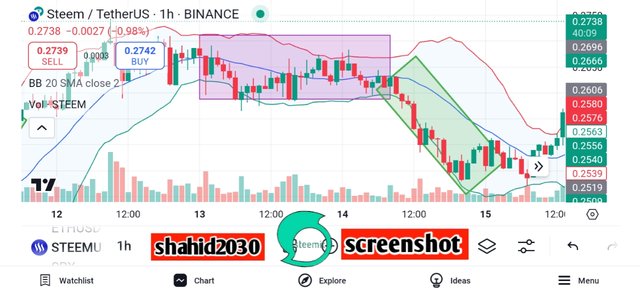
First strategy If the price touch a lower band, it strat moving upward and you see an increase in volume too, you may go for a long position. You can see a practical example in this chart. Same will be the case for short position, if the price touches the upper band, and you see a raise in volume ( indicates people interest) you can still confirm a down move.
Second strategy
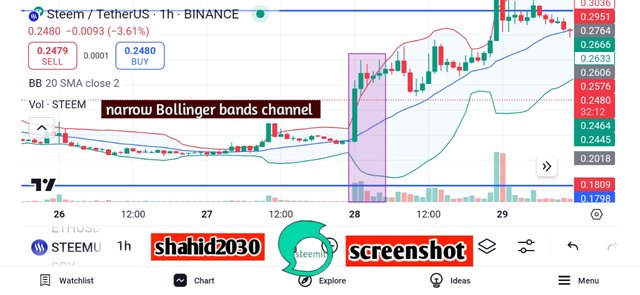
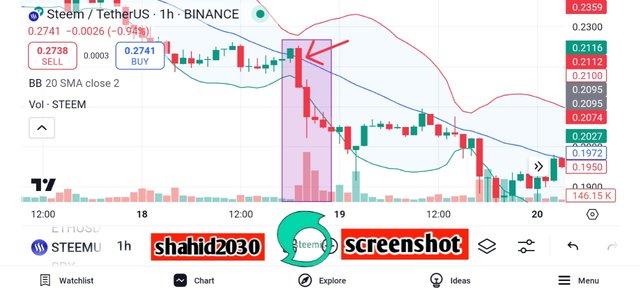
If you see a narrow or shrink Bollinger bands, wait for it's next move. If it moves upward with increasing volume, a confirm long trade and if it moves downward with increasing volume, a short trade is confirm. See here an example of short trade in the chart.
Third strategy
In Bollinger bands the middle line act as a 20 days moving average. It shows the average price of a coin in past 20 days. If this line is break in downward direction with increasing volume, a short trade is confirm, see in this chart. Same should be the senerio for long, if price break it in upward direction with increasing volume, long position is confirm.
Managing Risk through Bollinger bands in a volatile market
In volatile market always keep your stoploss near to the lower band in an uptrend or the upper band in a downtrend. You may exist with 1:1 target if achieved. Try to avoid trading in narrow or squeeze Bollinger bands zone.
Average True Range
ATR measure the market range (higher and low) over a specific period of time, reflecting the market volatility. Most of the trader use it to calculate their stoploss from the entry point.
ATR using strategy Art shows us the market volatility, a high ATR means high volatility in the market. Currently STEEM is in a highly volatile zone with an ATR of 0.0423. How can we use this ATR's Data now?
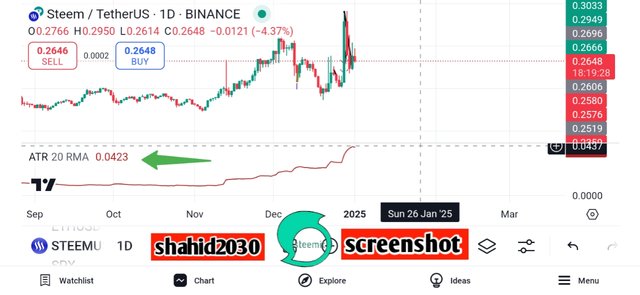
It's a daily chart of STEEM/USDT, the ATR show every day candle has an average difference of $0.0423. our stoploss should be at least the double of ATR price (2×0.0423 = 0.0846) same should be our TP1. Example steem price is $0.28, so according to current ATR our stoploss should be somewhere at $0.20 and Take profit at $0.36 (1:1).
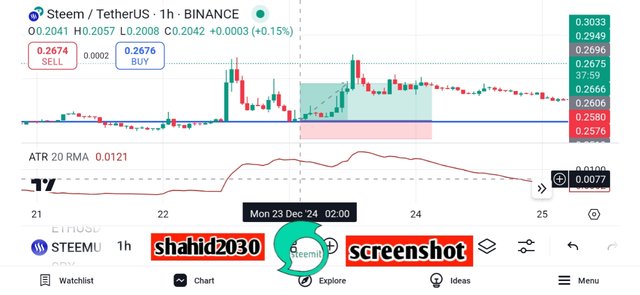
Let's find another strategy This is for short term trading (intraday trading). This is STEEM/USDT 1 hour chart (past). ATR price is 0.121 so we can predict our stoploss (0.0121×2= 0.0242). Our entry point is at $0.20, stoploss is $0.18 and take profit is at $0.2448.The take profit is predicted according to ATR daily time frame Data.
What we have done is, we first watched Steem's daily ATR data, which is 0.0423. Now for a scalper it is needed to keep take profit equal to daily ATR price. In this case our entry point is 0.20 and take profit is 0.244 ( equal to ATR price, 0.0423). It is done so because we ATR predict us that this coin can take a 0.0423 points move on an average.
Question 4: Developing a Risk-Adjusted Strategy. Design a trading strategy for Steem/USDT that incorporates risk-adjusted principles. Explain how your approach adapts to different market conditions, such as sharp price swings or periods of consolidation. |
|---|
We make strategies we think are more profitable and less risky. Those strategies fit best according to our mind and trading techniques. Let me share a best trading strategy for STEEM/USDT.
Key Components of the Strategy
Market condition assessment: Try to avoid trading in volatile market. Use ATR to measure market volatility for you. For taking trading using ATR we may go through the way I have explained above. Do proper analysis; find support and resistance levels and most important is to identify trends. Use tools like EMA, Bollinger bands and ADX to identify trend. Remember never go against trend.
Risk management: Keep in mind a specific percentage of your portfolio for each trade ( 2%, 3%) like that. Identify the best entry zone, Stoploss and take profit using analysis tools. Maintain best reward ratio, in my case I will suggest 1:2.
Apply all these things on Steem/USDT and let's see what's the result. Let me apply it on live Steem/USDT pair.
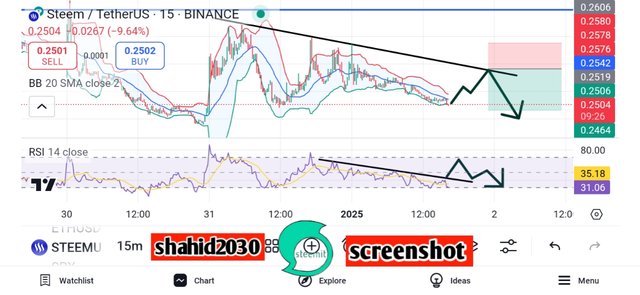
This is STEEM/USDT Chart on 15 minutes. Steem on 15 minutes is in downtrend. RSI also indicates a down trend. Though steem is in oversold region, but we can't go against trend (risky). We will wait Steem price to touch trend line and we will go for short trade. ***Our entry point could be; 0.27, stoploss at 0.29(previous high) and take profit at 0.24 ( previous low). This is 1:1.6 trade.
Adapting to Market Conditions
Sharp Price Swings (High Volatility): Use breakout strategy; enter your trade when price of the assets breaks above or below key levels (support , resistance, trend lines or key chart patterns) with strong volume confirmation. Bollinger Bands, and Fibonacci can give best identification of breakout.
Risk Adjustment: Use low leverage, tighten stoploss and reduce position size.
Periods of Consolidation (Low Volatility): In range trading we can do best scalping using small amount. Buy at support and sell at resistance during the ranging zone. Many key tools like Stochastic oscillators and RSI will help us here.
Risk Adjustment: Stoploss should be above or below the key levels, market is unvolatile you may go with slight high position and take instant profit and wait for another best entry.
Question 5: Lessons from Real-Life Scenarios. Discuss a real-life or hypothetical scenario where poor risk management led to significant losses. Reflect on what could have been done differently and propose key takeaways for improving future strategies. |
|---|
In trading you may come up with many unwanted situation, and because of it's volatility it happens many many times. I have done some losses too, due to my poor risk management. LUNA crush hitted me badly, as it was a massive crush. I have kept almost all my portfolio there when I saw it's price is down without any proper research and analysis. It happened to me because of greed, poor psychology and poor management. I have lost all my portfolio in it.
The market was dumped intentionally by manipulator. It was a complete article based it, how few people took loan from LUNA owner and then how they use it against him. They took loan from DO Kwon of almost billion dollars worth of LUNA and then sell all at once. It increase the selling pressure, which led LUNA to decrease it's price. DO Kwon then start buying LUNA with his own stable coin USTC. It led to depeg in USTC and the situation got out of control for Terra LUNA team, results in a huge market crash.
Now those who have read everything properly and managed the risk they were safe. Even they got profit out of this situation, by shorting BTC and LUNA.
What Could Have Been Done Differently
Proper research and analysis: I could have analyze the market betterly to understand things. Their was speculation in the market, but I was unaware of that.
Note: Never ever trade with doing proper analysis and research. Don't let your emotions (FOMO or greed) to get control over you.
Proper risk management: Yes I would gain too much profit, if LUNA went to it's old position, but I should have gone through with a proper risk management. Poor risk Management resulted in liquidation of my portfolio.
Note: Risk management is the key principle in trading. In such risky matters trade that amount you can efford to lose.
Diversification: Diversification (spreading portfolio in different assets) could protected me that time. I would only lost my money in Luna, other would be safe.
Note: Never ever put all your portfolio in one asset. Any bad incident (like Luna crash) will result in liquidation of your account. Diversification always helps in minimizing lost ratio.
This is all about my blog for today, hope you guys have enjoyed reading it. See you soon with a new amazing and interesting topic, till take care.

| I would like to invite: @goodybest, @ripon0630, @beemengine, @svm038, @tommyl33, @alejos7ven, @janemorane, @rme, @pathanapsana, @stef1, @ashkhan to participate in this Contest |
|---|
Your presence here means alot
Thanks for being here
Regard shahid2030

