Steem with Elliott Wave Theory
Yey! This post will be the entry for the second week of Season 20 of the Steemit Engagement Challenge! Cryptocurrencies being my passion for trading, I am also passionate about Blockchain Technology, and therefore, it befits me well to broaden my knowledge with the Elliott Wave Theory. This competition presents me with a great chance to improve on my technical analysis by applying this popular theory on the Steem token market. I am much interested in getting from other participants as well as sharing with them my ideas.
.png)

Question 1: Describe the Five Impulsive Waves of Elliott Wave Theory

Elliott Wave Theory Elliott Wave Theory, developed by Ralph Nelson Elliott in the 1930s, is a type of technical analysis that deals with wave patterns in the price chart. The first part of any correct sequence represents impulsive waves and the remaining shows corrective waves.
Five Impulsive Waves
Wave 1: The first move in the direction of a trend. This typically happens with the market sentiment still bearish and everyone else not recognizing just yet that a new trend is taking place.
Wave 2: Wave 2 will retrace some of Wave
Wave 2: This is usually accompanied by a correction up to but not surpassing the origin of Wave 1. The market sentiment remains to the downside with most feeling as though the previous trend is still in tact.
Wave 3: Typically the longest and strongest wave, Wave 3 travels with volume and momentum in the direction of the trend. This wave is typically recognized as the primary trend, and it signals a bullish market sentiment.
Wave 4: This is a correction wave and it moves the portion of Wave 3. This is generally milder than Wave 2 and is quite often sideway action.
Wave 5: The last wave in the direction of the primary trend. This often involves diverging price with indicators such as RSI or MACD which will display a new high to the price. The second one is euphoric sentiment, and this path is usually speculative driven by an excessive optimization in the market.
Factors that Most Distinguish the Impulsive Waves from Corrective Waves
Mode: Impulsive waves travel along the direction of the predominant trend, while corrective waves travel in the opposite direction.
Components: Impulsive waves comprise of five sub waves, every corrective wave consists of three sub waves.
Power: There is usually a larger momentum and volume of activities within an impulsive wave than there is in a corrective wave.
Market psychology: Strong trends dominate during impulsive waves, while there is only a relatively shallow pull back during the consolidation wave – the corrective wave.
Let us apply this to the STEEM/USDT trading pair:
This pattern has provided fair allotment towards active trading in the STEEM/USDT trading pair too. The order progress within word groups progressively distills and strengthens the content.
When applied to this example, as if you have already been given an understanding of the impulses. Let’s analyze how that works for the STEEM/USDT trading pair.
Wave 1: Out of nowhere, let’s say that STEEM has started to which remains at the top line, then moves to dollar 20, and after that PLAN CHANGES ROUSE RATIONS increases & remains again at the top line of dollar 30. This initial move is likely not recognized as the beginning of a trend in the best among the traders.
Wave 2: Then STEEM moves back down to settle at dollar 25. Most of the traders will be thinking that the last downward trend is still in action.
Wave 3: The STEEM trades at 0.50 again with heavier volume which confirms the beginning of the new uptrend.
Wave 4: The STEEM consolidation level settled at dollar 40 which is also depicted lower correction than wave 2 where the corrective pullback is less severe guided by the principle.
Wave 5: Finally, when STEEM trades at dollar 60, the upper edges have been well defined by the trend indicators but the indicators are diverging and this suggests that the trend is about to finish.
Thus, except for dividends receipts, the sell trading strategies also get further risks within the active STEEM/USDT. These waves’ scope assists a trader in apportioning commodities sister trades structures and thus entering and exiting engagements at much more optimal intersections further enhancing their trading margins.

Question 2: Identify Impulsive and Corrective Waves on a Steem Chart
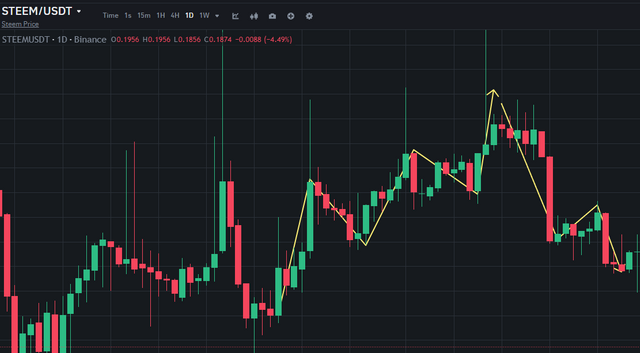
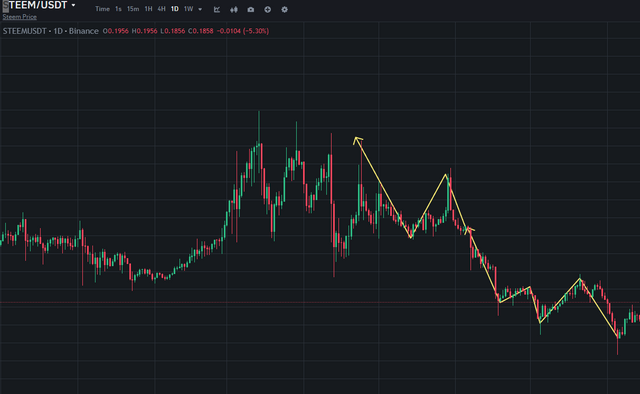
Using a historical Steem price chart, identify the impulsive and corrective waves over a given period. Explain why certain waves are impulsive and others corrective. For this analysis, use a daily or weekly time frame.

 |
|
Impulsive and corrective waves are distinguishable by their direction: impulses move in the direction of the larger trend, while corrections move against it.
They felt like well studied,directed changes with the existing trend (impulsive waves) There are five sub-waves: three advancing (1, 3, and 5) and two correcting (2 and 4). Those waves reveals the emotions of Market and Momentum, supporting price to increasing soo much in accordance with trend. For illustration purposes, a five-wave pattern on the chart of Steem could see the price rise from $0.10 to $0.50 in an impulsive spike, which would align with strong bullish interest as shown in the daily Steem chart below:
On the other hand, Corrective waves, move against the trend and typically consist of three sub-waves; A, BThese two (2) and C. These waves represent a pause or continuation in the market when the price only goes back to former rapid growth. Counter trend move: These are usually short-lived and not as potent, represent a pull-back in sentiment against the prevailing trend For example, an impulsive rise from $0.10 to $0.50 and a 3 wave corrective pattern retraces the price back down to $30 would only show as a temporary pullback before price continues on with the trend.
Having this understand wave traders can make good entries and exits according to the market phase of the trend.

Question 3: Explain the Alternation Rule in Corrective Waves

Application of the Rule for Alternation
Simple vs. Complex: Each wave theory has its limitations. In this case, if Wave 2 is a simple correction (subdivided in, for example, a sharp zigzag), then Wave 4 is likely to be a more complex correction(such as flat or triangle). So, if Wave 2 is complex, Wave 4 would correspond to be simple.
Depth and Duration: Furthermore, the alternation theory states that if Wave 2 is deep and sharp, the wave 4 will be shallow and sideways, and so on.
Example of Application in Practice
On a daily Steem chart:
Wave 2: If Wave 2 is a simple zigzag retracement from $ 0.5 to $ 0.3 where a down move to $ 0.3 forms, Wave 4 would comprise horizontal movements perhaps between $ 0.40 and $ 0.45 of the order of flat or triangle.
Wave 4: In contrast, when Wave 2 is a complex corrective move, Wave 4 will be a minor pullback.
This way of looking at things helps traders to predict with more precision what the next corrective waves will be like and to make better trading decisions.
Simple vs. Complex: if Wave 2 is a simple correction (e.g. sharp zigzag), Wave 4 should be a complex correction (e.g. flat or triangle). On the contrary, if Wave 2 is complex, Wave 4 would be more likely simple. 2. Depth and Duration: The rule of alternation also proposes that for instance if Wave 2 is deep and sharp then Wave 4 will be shallow and sideways and vice versa.
Example
On a daily Steem chart: - Wave 2: If Wave 2 traces from $0 50 to $0 30 for example in a simple zigzag the retracement of $0 30 to $0 30 will be very sharp and difficult and Wave 4 formation could attract around $0.40-$0.45 levels in the form of complex forms such flat or triangle.
Wave 4: In contrast, if Wave 2 is a complex correction then Wave 4 may turn out to be a very simple, shallow retracement.
With the assistance of the alternation rule, traders would be able to assess better the forthcoming corrective waves and improve their trading know-how.


Question 4: Plot a Trading Scenario for Steem Based on Elliott Waves

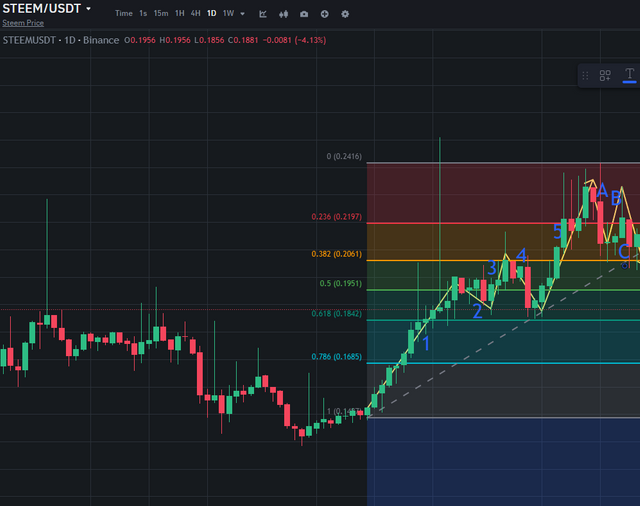
A trading plan with targets and a stoploss can be set on a chart using the Elliotz wave theory with a 1-2-3-4-5 impulse wave structure we have drawn green channel and label it as A-B-C for our correction. The strategy will be as follows.
Wave 1 - Entered at the start of wave 1. Fibonacci retracement at the 0.618 level for an entry.
Wave 2: Anticipate a bounceback. Sell half as profits at the 0.382 Fibonacci level.
Wave 3: Re-enter at the end of Wave 2. This is usually the strongest wave. Use the 1.618 Fibonacci extension for an exit target.
Wave 4: Anticipate another retracement. Exit partially at the 0.5 Fibonacci level.
Wave 5: re-enter at the end of Wave 4. Exit at the 2.618 Fib extension.
A-B-C Correction:
- Wave A: Exit at the start of Wave A to avoid losses.
• •Wave B: Re-Enter for a Short-Term Trade• •Exit at Wave A’s 0.618 Fibonacci Retracement.
- Wave C: Avoid trading during Wave C. Wait for the correction to complete.
It is a strategy which makes use of levels from the Fibonacci sequence to enter and exit a trade, so that you profit from both impulse and corrective waves.


Question 5: Analyze Steem's Current Market Trend Using Elliott Waves
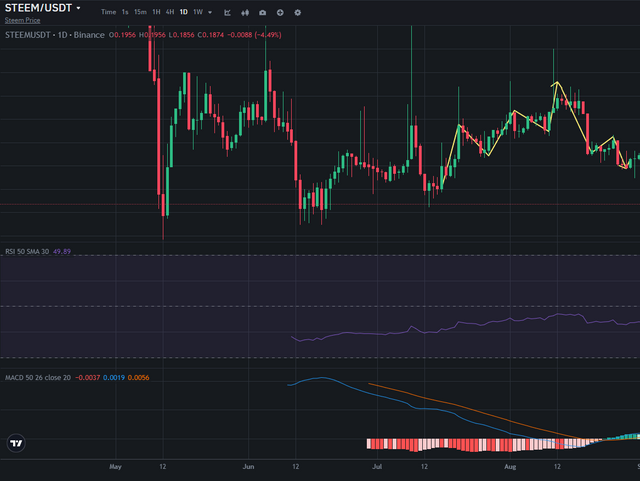
In the beginning, I will calculate a wave cycle and use some technical indicators like RSI, SMA or WMA to make some financial predictions.
current wave cycle
Based on the latest price movement it appears that Steem is in correction phase after the 1-2-3-4-5 impulse wave is complete as we see sequence lower highs and lower lows which is usually a characteristic for A-B-C corrections.
Technical indicators
Of course, the Relative Strength Index (RSI) is the first indicator to consider:
If the RSI is below 50 it means the downward momentum is strong and if it is 30 or below it indicates that the price is oversold and you are probably on the bottom of that wave.
- Moving Average:
- 50-Day Moving Average: Steem price cannot rise above 50-day MA which strongly indicates its bearishness.
200-Day Moving Average: The price is still below the 200-day MA, which also indicates the market's long-term trend is bearish.
Next possible movement
- Wave A: It has been picked with a big decline as a prominent sign.
Wave B: This is a short-term recovery potential that could retrace to 50% or 61.8% of the decline of Wave A.
Wave C:- will come next which will push this wave below the lowest point of wave A.
strategy
Entry: When the RSI is oversold and the price just broke the higher low at the 61.8% retracement of the last impulse wave.
Exit: Exit the market if wave B is at the top, or wave A refers to the Fibonacci sequence when the last impulse wave retraces 50%. Short the market again at the start of Wave C.
This analysis combines Elliott wave theory with RSI and moving averages to analyze the trend of the STEAM market in detail.


reading my content. I am ending today's content here wishing everyone good health.
I invite you to support @pennsif.witness for growth across the whole platform through robust communication at all levels and targeted high-yield developments with the resources available.
 Click Here
 Thanks for reading the Post
02/0!/2024
Thanks to everyone here is an invitation @mostofajaman @simonnwigwe & @josepha
The End |
|---|

X promote link : https://x.com/Shahari73599011/status/1837861988640477700?t=BNKxxKAwuRZ8UkQdrAVSzw&s=19
Upvoted. Thank You for sending some of your rewards to @null. It will make Steem stronger.
Wave are clear. The prices are very well analyzed which is appropriate. All in all great wishes for you.
Thank you very much for your valuable comments.
Trading Steem with Elliott Wave Theory helps us to determine the trend of the Steem market. We can analyse the entry and exit zones with the help of the impulsive and corrective waves. We can make our decision accordingly by seeing the current waves. You have presented your post well. Best of luck.
I agree with you. Thanks for stopping by and leaving a nice comment.
You are welcome
Your post has been rewarded by the Seven Team.
Support partner witnesses
We are the hope!
TEAM 4
Congratulations! Your post has been upvoted through steemcurator06. Good post here should be..thank you so much for your support ma'am.