Introduction to the Principles of Crypto Analysis - Crypto Academy S4W7 - Homework Post for @imagen
Hello community, I am delighted to be a part of this frenetic lesson but our lecturer today. The crypto currency world without analysis would be like building castles in the air since for every asset bought, sold or traded, there should be proper knowledge of it. The details of the work imposed by the lecturer, is below.
 designed made with canvas
1.) What are the differences between Fundamental Analysis and Technical Analysis? Which one is used most often?
The concept of analysis, could be likened, to a case of a builder over a particular piece of land where he needs to study the topography, plan, and concept of the land. Here he'll know the kind of building the land, supports including every other factor about it. The same applies to crypto currencies,trading, buying and selling of coins are not efficient and profit maximising until they are well analyzed for and studied so as to know how to benefit no matter the market position.
In the aspect of crypto currencies, there are two types of analysis including the fundamental, and technical analysis
Fundamental analysis could be seen as a very cogent aspect of analysis which includes, utilization of market news of both intrinsic and outside factors to deduce the worth of an asset and then compare it with its actual worth in the market space. This movement, is meant to check if a currency is undervalued or over valued in the market and when its undervalued, we get long of it (buy) and when it's over valued, we go short of it.
Technical analysis could be seen as an analysis of charts since its based on the total study of the previous market charts of an asset. This completes the fact that technical analysis is sourced from past data.
In other words while considering data like its road map, white paper and projects in fundamental analysis,in technical analysis, we just look at charts majorly. The charts are formed by the price opens, closes, highs and lows.
The Distinctions between the Fundamental and Technical analysis include that :
Fundamental analysis are done for investments that aren't for short term, the main reason why the intrinsic value of currencies are considered,technical analysis on the other hand, is done for short term investments which are just simply read from price charts
Technical analysis aims to skim the market ie study the market lightly since its just for trading of assets while the fundamental analysis studies deeply since its for long
For fundamental analysis,study of intrinsic value is considered while for technical, price charts and patterns are the considered factors
When it comes to fundamental analysis, information relied on, is both past and present data while in technical analysis, it's mainly technical ie the past data charts and patterns

2.) Choose one of the following crypto assets and perform a Fundamental Analysis indicating the objective of the Project, Financial Metrics and On-Chain Metrics.
The currency I'm considering for this project, is the Sol
 source
Solana is a digital working software platform that is meant to produce great transactions speed without being centralized. At some point it optimizes, the Proof of history mechanism.
Here comes the native token which we're considering, Sol which is used solely, in the payment of transactions fees and staking on the platform. It offers to their validators and users, the right to vote in times of decision making in the system and even upgrades on the blockchain.
The Sol platform was founded in 2017 by Anatoly Yakovenko who was a member of Qualcomm before he found this platform. Partners like Chainlink, Project Serum, FTX, civic, dfuse etc are all with the Sol project and better growth of the platform is expected
Objectives of Solana :
- The Sol coin is bent on showing that there are groups of platform, using the combination to create a blockchain. Secondly, the native token, Solana, is used for payment on the blockchain and other smart contracts including other payments, known as lamports around the blockchain.
Road map of Solana :
The system of Solana is mainly edifued and updated and the final end of the road leads to the full mainnet release.
The Solana system launched, a better version of its mainnet after a public funding project brought up $1.76 million in auctions of the native token and felt it comfortable, to work with its mainnet in beta stage which allows for smart contracts and transactions of native token but a major restriction was reward for validators which was lacking and so the system seeks to upgrade to one.
The Solana system finally seeks to upgrade their system and get to the full mainnet version which would implement the potential inflation schedule.
 source
 source
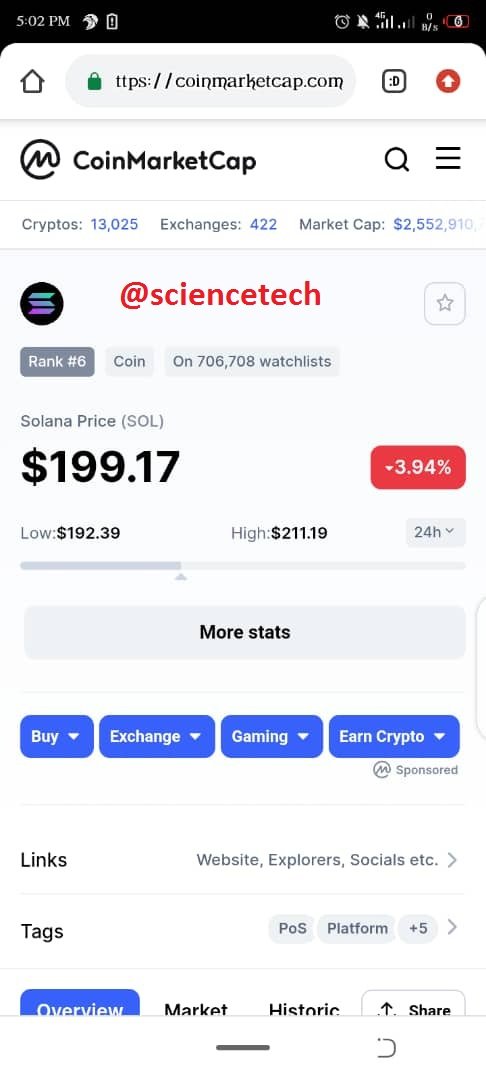
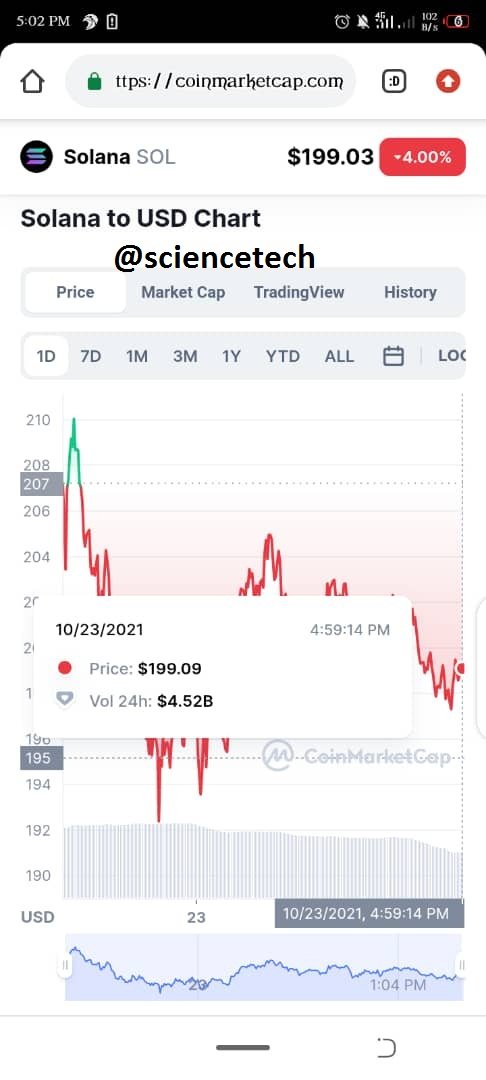
The Solana token, is valued at $199.26 with its market cap at $59, 990,728, 915.48, trading volume at $4, 558, 659, 136. 39, Circulating supply as 300,823, 808, total supply as 488,630, 611 and max supply as 488, 630,611

3.) Make a purchase from your verified account of at least 10 USD of the currency selected in the previous point. Describe the process. (Show Screenshots).
Open the binance and login to your account
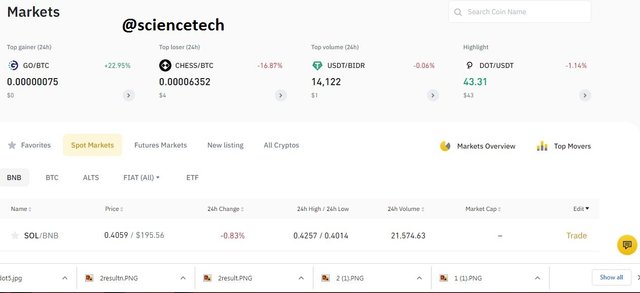
click on the market to see the coin pairs
 source
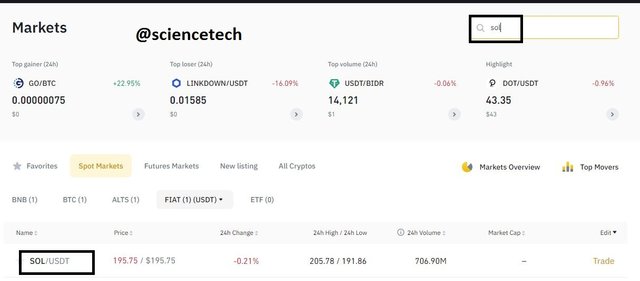
- search for the pair you wish to exchange for me I will be using the SOL/USDT pair
 source
- Click on buy and the market chart would be displayed
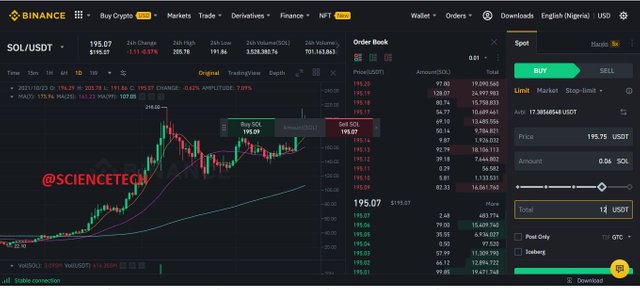 source
- I will be making a purchase worth 12 usdt of the SOL coin
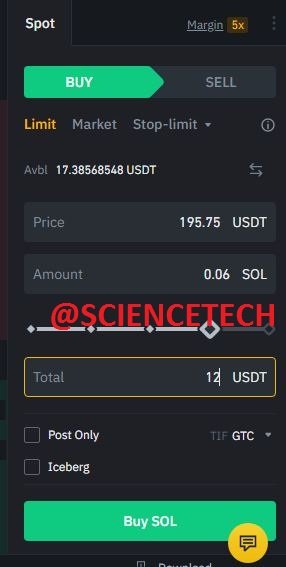 source
- below is the details of the completed order
 source
4.) Apply Fibonacci retracements to the previously selected asset with a 4 hour time frame on the platform of your choice. Observe the evolution of the price at 24 and 48 hours, did it go up or down in value? Look to identify resistance and support levels. (Show Screenshots at 0, 24 and 48 hours of purchase where the date and time are observed).
From the SOL/USDT chart on a 4hour time frame, I placed my support and my resistant line which I used to determine where to draw my fibonacci retracement with that, I placed a trade with the hope of a reverse seeing it has reached the resistant line. below is the chart of my 0 hour
 source
24hours later, I opened the chart and discovered that the price was heading towards another resistance which made me incure some loses.
 source
48 hours later on the chart, I observed that the chart has reached the major resistance and has done what I expected earlier which is a reversal heading towards the 61.8% on the fibonacci retracement to that effect I feel I made was that I entered the trade either to early or my resistance was too low
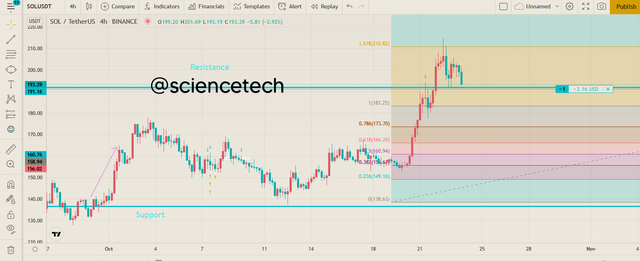 source
5.) What are Bollinger Bands? How do they apply to Crypto Technical Analysis? With which other tool or indicator do you combine Bollinger Bands to analyze a Crypto? Justify your answer.
What are Bollinger Bands?
There are several agents/instruments of analysis and the Bollinger bands, are not left out of it. The Bollinger bands are basically, instruments of technical analysis explained by an arrangement of lines that express movement of price level being plotted negatively and positively from the simple moving averages of an asset's price but can be pushed to the interest of traders, holders and investors of the asset
How do they apply to Crypto Technical Analysis?
The Bollinger bands are very strategic, in their contribution to the market analysis of the coins since they perform a major task which is, that they help calculate a currency /token's volatility and explains when the currency had been bought in excess or sold in excess. This knowledge proffered now helps, in decision making as a trader since we now know when to go long or short of a coin
With which other tool or indicator do you combine Bollinger Bands to analyze a Crypto? Justify your answer.
.PNG) source
sourcefor this section I will be using the bollinger band with the RSI. There are some conditions that should be met in order to determine an entry position using the bollinger band and the RSI
If the price crosses above the moving average which is the middle band and the price crosses the 50 level of the RSI with this two conditions in place, you can execute a buy order
Also if the price crosses below the moving average which is the middle band and the price moves below the 50 level of the RSI in a downward trend, it is an indication for sell if they two conditions are met
source
FOR REVERSAL TREND
when the price touches the upper band and the price is overbought this will possibly lead to a trend reversal which means it may head downwards
If the price touches the lower band and is at the oversold position of the RSI this will possibly lead to an upward reversal and it is a good time for a buy entry
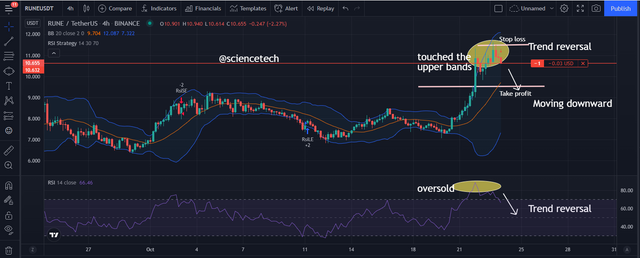 source
 source
CONCLUSION
Building castles in the air, would never be the dream of a trader and that's the need for analysis.
Knowing the ground roots of a project about to be embarked on, gives a lot of risk reduction and thus applies in crypto currencies.
Fundamental analysis and technical analysis of projects help in making right decisions since both indicators, project study, Bollinger bands etc, always point out the right steps to take in the market
I really thank @imagen for this wonderful lecture and I thank you all for reading my post
Gracias por participar en la Cuarta Temporada de la Steemit Crypto Academy.
Continua esforzandote, espero seguir corrigiendo tus asignaciones.
@imagen @sapwood - this person appears to be having some problems passing Achievement Task 1 (Verification) in the Newcomers Community. Might be worth monitoring that...
cc @cryptokannon
@sapwood , please what do I do because I am very confused at this point
All my efforts for the week was not curated
please talk to me sir, let me know my next move, if I should write for this week or hold on?
Yes, he has provided photoshopped/falsified photos/images in the introduction post.
Original
Photoshopped
Further, he did not provide the additional information(Kannon has asked this user to give a handwritten copy of steemit account name and the recent date on a piece of paper).
Thank you.