Steemit cryptoacadmey Homework post for @cryptokraze | dynamic resistance and support for trading
In this post, I will be submitting my homework task for professor @cryptokraze.


1 - What do you understand about the Concept of Dynamic Support and Resistance? Give Chart Examples from Crypto Assets. (Clear Charts Needed)
We all use resistance and support levels to trade but the support and resistance levels I have been using until now(this lecture) was static or you can say was fixed but there are dynamic support and resistance levels too.
As the name suggests, dynamic resistance and support levels are the levels that move along with the price, these dynamic levels can be spotted with the help of EMAs(Exponential Moving Averages).
EMA keeps the trader updated by providing the price of an asset for every period.
Dynamic Support
Dynamic support levels are the levels from which price bounces back and starts moving in an upward direction again. The difference between the dynamic and static support levels is that static support is fixed but dynamic support changes or moves along with the price.
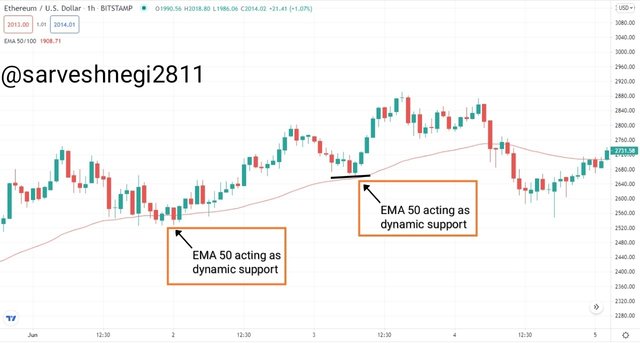
Chart example for support level using EMA 50:
In the chart below you can see that I have chosen ETH/USD pair to spot support levels using EMA 50, it can be seen that whenever the price reaches or touches the support level it bounces back from the support level and started moving upward again.

Dynamic Resistance
Dynamic resistance levels are the levels from which price bounces back and starts moving in a downward direction again. The difference between the dynamic and static resistance levels is that static resistance is fixed but dynamic resistance changes or moves along with the price.
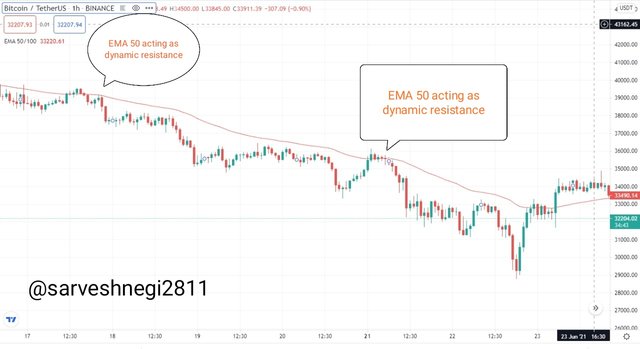
Chart example for resistance level using EMA 50:
In the chart below you can see that I have chosen Bitcoin/USDT pair to spot resistance levels using EMA 50, it can be seen that whenever the price reaches or touches the resistance level it bounces back from the resistance level and started moving downward again.
2- Make a combination of Two different EMAs other than 50 and 100 and show them on Crypto charts as Support and Resistance. (Clear Charts Needed)
We have seen how EMA can act as a support and resistance as well but to be more sure about the trend and any other relevant information regarding trading, we use a combination or a pair of EMA to:
(1) Minimize risk or loss
(2) Perfect entry and exit points
So I have used a pair other than EMA 50 and EMA 100 which is EMA 40 and EMA 81.
EMA 81: it works as same as EMA 100 to serve as support and resistance, can be used for 1 day or 1-week chart.
EMA 40: it can come in handy because of its period which is neither too long nor too short.
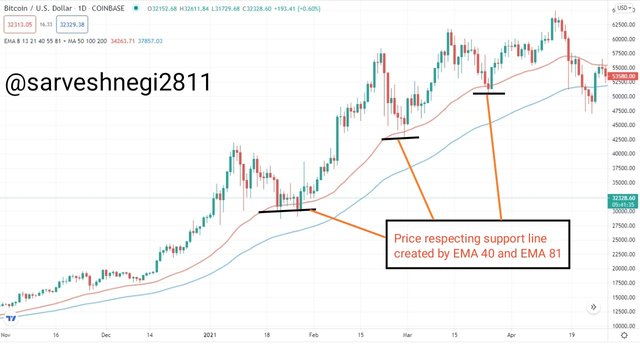
Dynamic support using EMA 40 and EMA 81
Dynamic support levels are the levels from which price bounces back and starts moving in an upward direction again.
It can be seen that whenever price reaches EMA 40 and EMA 81, price started moving upward again, which shows that the price respects the support created by EMA 40 and EMA 81.
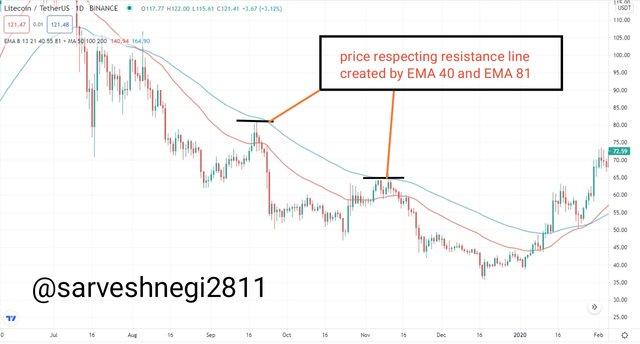
Dynamic resistance using EMA 40 and EMA 81
Dynamic resistance levels are the levels from which price bounces back and starts moving in downward direction again.
It can be seen that whenever price reaches EMA 40 and EMA 81, price started moving downward again, which shows that the price respects the resistance created by EMA 40 and EMA 81.
So i have used a combination or a pair of EMA 40 and EMA 81 to show resistance and support level.
3 - Explain Trade Entry and Exit Criteria for both Buy and Sell Positions using dynamic support and resistance on any Crypto Asset using any time frame of your choice (Clear Charts Needed)
Trade entry using a combination of EMA 50 and EMA 100
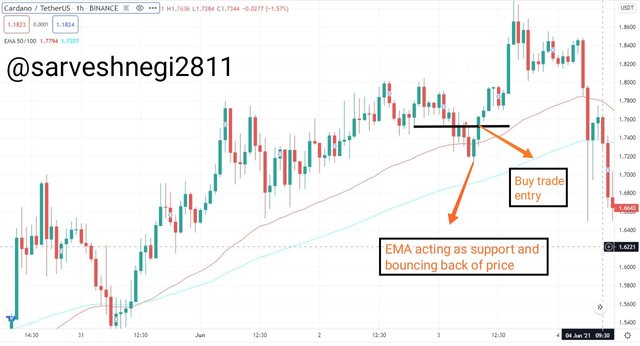
We enter a market to trade and make a profit by selling our holdings or buying assets, everyone wants to make a profit and to make a profit, one can buy an asset when the price of the asset is low or sell his holdings when the price is high. This is obvious and a common thing that anyone knows but very few knows how and where to enter the market? So now I will be talking about trade entry criteria using dynamic support and resistance levels via a combination of EMA 50 and EMA 100.
(1) Buy entry criteria:
Steps to enter a buy trade are as follow:
(A) Add EMA 50 and EMA 100 in the price chart of any crypto asset. (If you are using "Trading view", you can go to the "fx" section for indicators and strategies and can choose EMA 50 and EMA 100.
(B) Both EMA(50 and 100) must be below the price or the price must be above both the EMAs(50 and 100).
(C) Wait for the price to move downward and touch or reach EMA 50( we must not enter the buy trade at this moment because sometimes a stronger trend can break both the support levels created by EMA 50 and EMA 100).
(D) Now, wait for the price to move upward again after touching or crossing the EMA 50(as I stated earlier price bounces back from the support level and starts moving in the upward direction again).
(E) When you see a confirmation about the price touching or crossing EMA 50 and then started moving in an upward direction again, you can place a buy order just above the EMA 50.
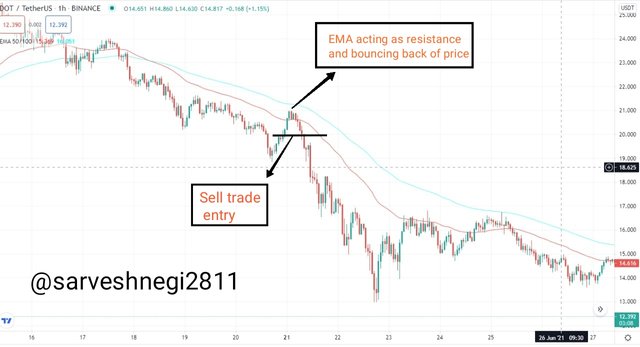
(2) Sell entry criteria:
Steps to enter a sell trade are as follow:
(A) Add EMA 50 and EMA 100 in the price chart of any crypto asset. (If you are using "Trading view", you can go to the "fx" section for indicators and strategies and can choose EMA 50 and EMA 100.
(B) Both EMA(50 and 100) must be above the price or the price must be below both the EMAs(50 and 100).
(C) Wait for the price to move upward and touch or reach EMA 50( we must not enter the sell trade at this moment because sometimes a stronger trend can break both the resistance levels created by EMA 50 and EMA 100).
(D) Now, wait for the price to move downward again after touching or crossing the EMA 50(as I stated earlier price bounces back from the resistance level and starts moving in the downward direction again).
(E) When you see a confirmation about the price touching or crossing EMA 50 and then started moving in a downward direction again, you can place a sell order just below the EMA 50.
Trade exit using a combination of EMA 50 and EMA 100
After entering a market one should always know one's exit point otherwise one should suffer a loss of multiple folds or miss a profit that could have hit easily. We can exit at a suitable position using EMA 50 and EMA 100.
Exit criteria for buy position using EMA 50 and EMA 100:
(1) Buy exit criteria:
Steps for buy trade exit are as follow:
(A) We must place our stop loss to avoid the loss so that we don't suffer a loss if our trade goes in the wrong direction or our setup is invalid.
(B) Position of stop-loss must be below the EMA 100.
(C) When the price reaches our stop loss levels we must exit the trade and understand that our setup was invalid.
(D) Take profit level must be placed too so that we can take profit if our trade goes in the direction we predicted.
(E) Take profit level must be greater than or equal to 1:1 (Risk to reward ratio), this ratio can vary from trader to trader.
(F) Exit the trade when our take profit level gets hits.
Exit criteria for buy position using EMA 50 and EMA 100:
(2) Sell exit criteria:
Steps for sell trade exit are as follow:
(A) We must place our stop loss to avoid the loss so that we don't suffer a loss if our trade goes in the wrong direction or our setup is invalid.
(B) Position of stop-loss must be above the EMA 100.
(C) When the price reaches our stop loss levels we must exit the trade and understand that our setup was invalid.
(D) Take profit level must be placed too so that we can take profit if our trade goes in the direction we predicted.
(E) Take profit level must be greater than or equal to 1:1 (Risk to reward ratio), this ratio can vary from trader to trader.
(F) Exit the trade when our take profit level gets hits.
4 - Place 2 demo trades on crypto assets using Dynamic Support and Resistance strategy. You can use lower timeframe for these demo trades (Clear Charts and Actual Trades Needed)
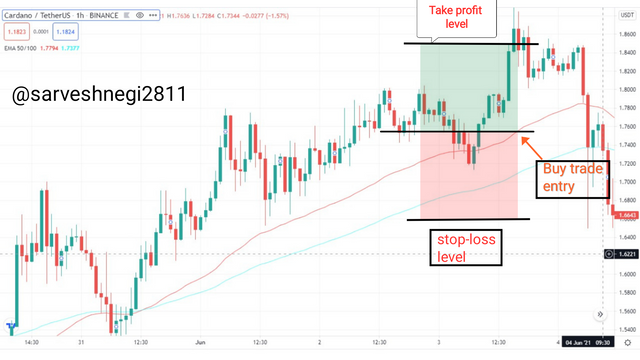
(1) First dema trade using a combination of EMA 50 and EMA 100
I have used a time frame of 1 hr and the crypto asset pair I used is XMR/USD. I have executed a buy trade.
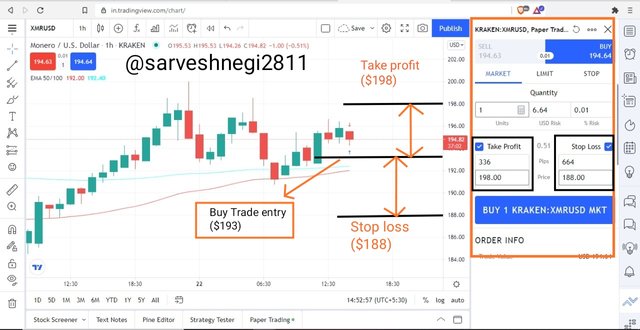

Details of my trade
Buy trade entry: $193
Take profit level: $198
Stop loss level: $188
I have set my reward risk ratio to 1:1, as tou can see in the chart above.
198-193= 5
193-188 = 5
You can see the ratio is set to 1:1.
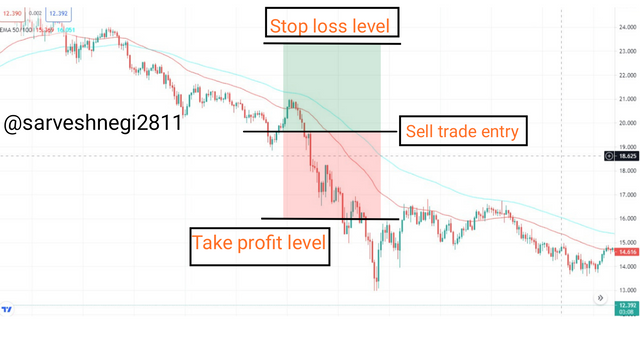
(2) Second demo trade using a combination of EMA 50 and EMA 100
I have used a time frame of 1 hr and the crypto asset pair I used is DOT/USDT. I have executed a buy trade.
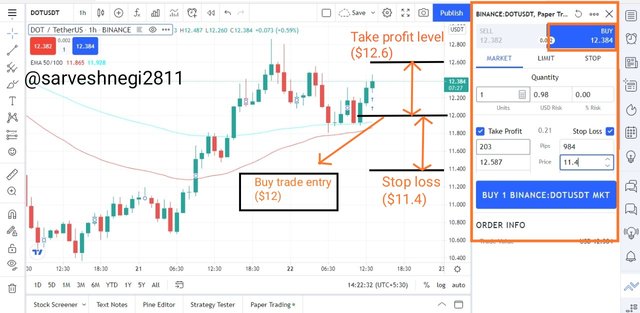
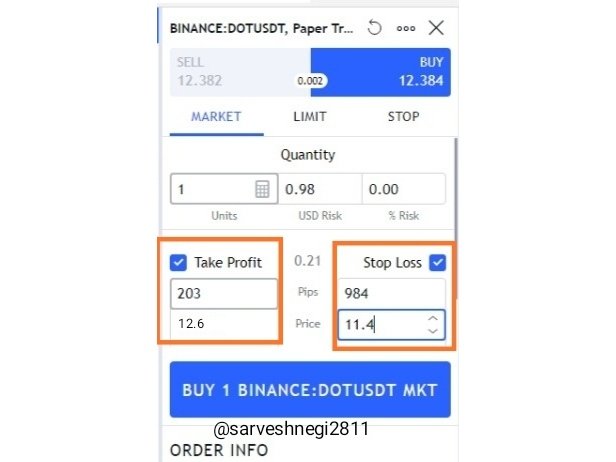
Details of my trade
Buy trade entry: $12
Take profit level: $12.6
Stop loss level: $11.4
I have set my reward risk ratio to 1:1, as tou can see in the chart above.
12.6-12 = .6
12-11.4 = .6
You can see the ratio is set to 1:1.
Conclusion
In a nutshell, this is a very good technique or use of indicators to trade using dynamic resistance and support levels via EMAs, I was able to see the price respecting support and resistance created by EMAs, I was able to find buy and sell trade entries along with the buy and sell trade exits, I have positioned my stop loss and take profit level and set my risk-reward ratio to 1:1 and finally, I was able to place demo trades using EMA 50 and EMA 100.
That waa all from my side
Thank you
For the attention of @cryptokraze.
Dear @sarveshnegi2811
Thank you for participating in Steemit Crypto Academy Season 03 and making efforts to complete the homework task. You got 10/10 Grade Points according to the following Scale;
Key Notes:
We appreciate your efforts in Crypto academy and look forward for your next homework tasks.
Regards
@cryptokraze
Thank you professor @cryptokraze.
You have been upvoted by @sapwood, a Country Representative from INDIA. We are voting with the Steemit Community Curator @steemcurator07 account to support the newcomers coming into Steemit.
Engagement is essential to foster a sense of community. Therefore we would request our members to visit each other's post and make insightful comments.
Thank you