Steemit cryptoacademy homework task for professor @kouba01
Hey steemians
In this post i will be submitting my homework task for professor @kouba01.


Q-1. Discuss your understanding of the ADX indicator and how it is calculated? Give an example of a calculation.
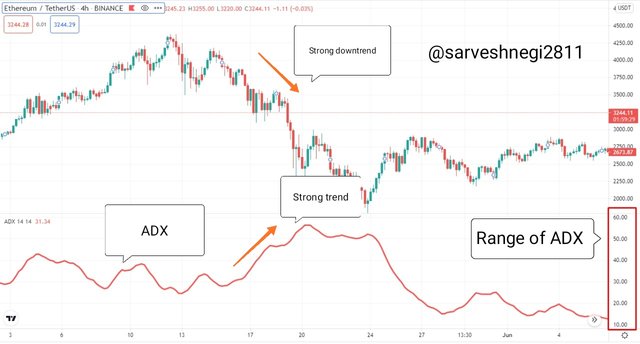
ADX is an acronym that stands for "Average Directional Index", Average Directional Index is a "non-directional" and "lagging" indicator used by traders to trade via technical analysis of any crypto asset due to its ability to tell about the "Strength of a trend" and ADX when combined with "DI+" and "DI-" further tells us about the direction of the trend.
Now I have used the two terms above, Lagging and Non-directional and I think these two terms might intrigue you.
Lagging indicator: You can get a clear idea by the name that it lags from the real price or real trend or in other words, ADX provides a signal or tells us about the strength of a trend only after the starting of the trend.
Non-directional Indicator: By non-directional indicator it means that it doesn't matter whether the trend is upward or downward, it will only show the strength of the trend regardless or irrespective of the direction of the trend. It will give the value of 50 for a strong trend in an uptrend and so in downward too.
J. Welles Wilder is the one behind the idea of the ADX indicator, he developed the ADX completely in 1978, due to the versatility of ADX in the 20th century, ADX was quite popular amongst the traders and was the first choice of any trader that was looking for the strength of a trend.
As I mentioned above, the ADX is an indicator that tells us about the strength of a trend but ADX has a range that lies between "0 to 100" and can be categorised into 4 ranges based on the strength of a trend.
(1) 0 to 25: If ADX is showing a value between 0 to 25, it means that there is no trend or a weak trend
(2) 25 to 50: If ADX is showing a value between 25 to 50, it reflects the presence of a trend in the market.
(3) 50 to 75: If ADX is showing a value between 50 to 75, it reflects the presence of a strong trend in the market.
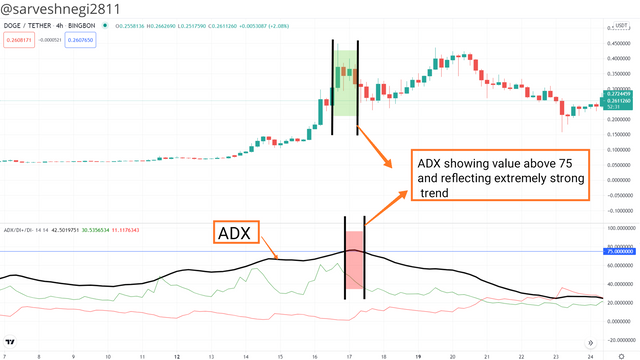
(4) 75 to 100: If ADX is showing a value between 75 to 100, it reflects the presence of an extremely strong trend in the market. (extreme volatility)

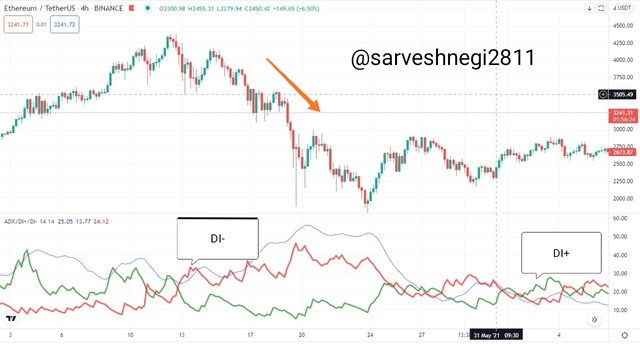
So by looking at the value of ADX we can easily determine the strength of a trend but what about the direction of the trend?? So to know about the direction of the trend ADX is used in conjunction with DMI(DI+ and DI- curves).
For now, we can understand only:
(1) When "DI+" is above "DI-": It reflects an uptrend, the strength of that uptrend can be determined with the help of ADX.
(2) When "DI+" is below "DI-": It reflects a downtrend, the strength of that downtrend can be determined with the help of ADX.
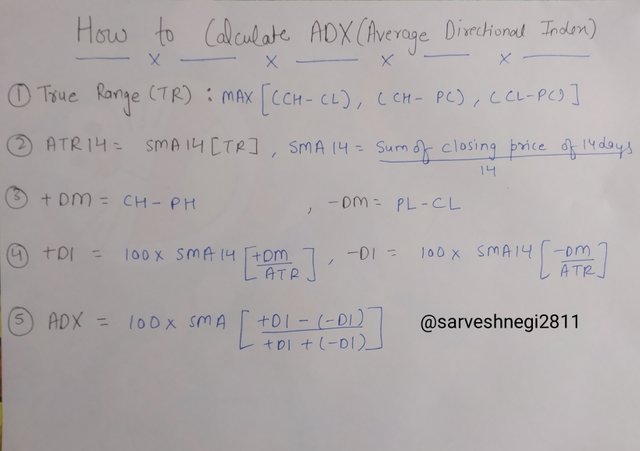
Calculating ADX is a cumbersome procedure as it involves calculating different parameters and then using them in conjunction to find ADX.
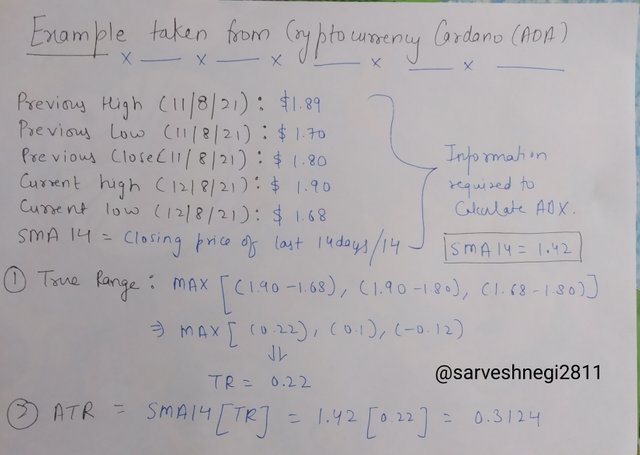
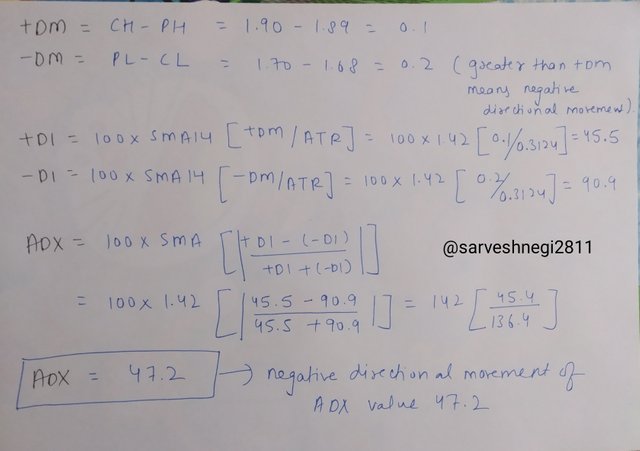
I have taken the crypto asset, Cardano, to calculate ADX and used Coinmarketcap to know the current high, current low, previous high, previous low and previous closing price. I have also used Coinmarketcap to determine SMA14 by using the previous closing price of 14 days and taking their average.
I get to know that the direction of movement is negative and the value of "ADX is 47" which reflects a strong trend.
Q-2) How to add ADX, DI+ and DI- indicators to the chart, what are its best settings? And why? (Screenshot required)
Steps to add ADX, DI+ and DI- indicator to the charts are as follow:
I am using the Trading view for this purpose.
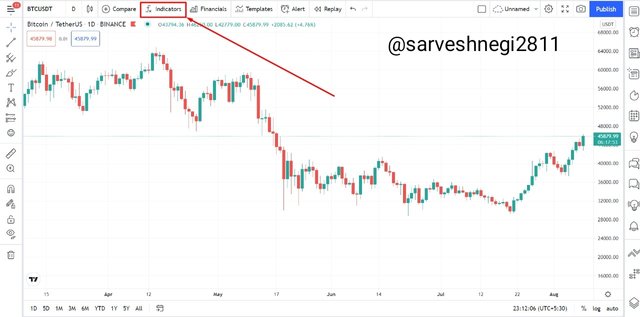
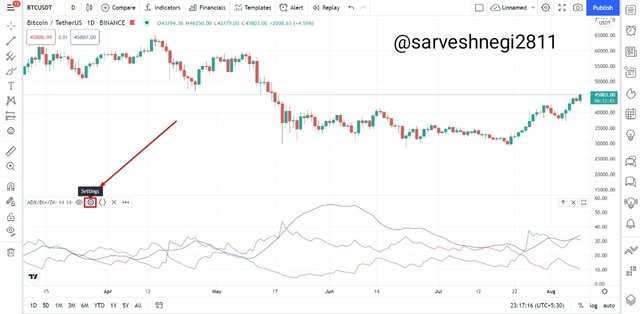
(1) Open the chart of any asset you want to apply the ADX, DI+ and DI- indicator on and click on fx for applying strategies and indicators.
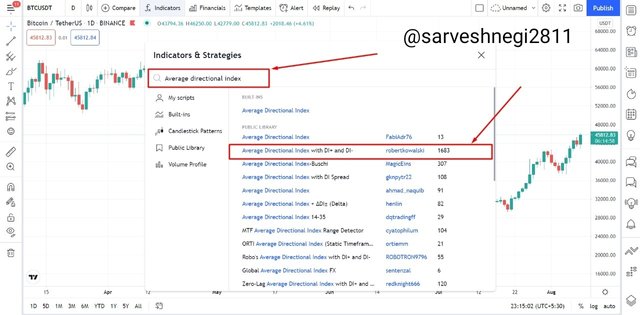
(2) Now type "Average Directional Index with DI+ and DI-" in the search bar and click on it.
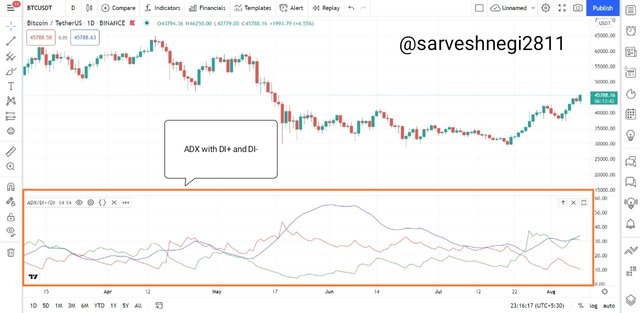
(3) Now you can see the ADX, DI+ and DI- indicator applied on the chart.
Settings of ADX with DI+ and DI- indicator
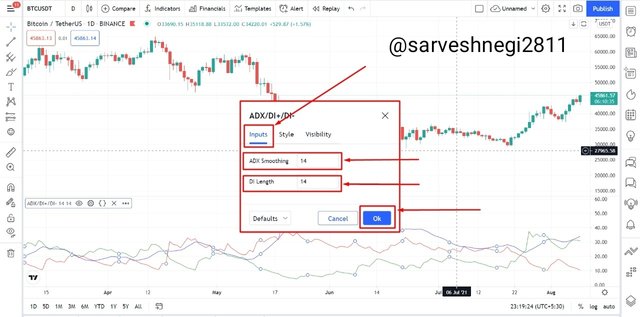
(1) Inputs: in the inputs section, you can see ADX smoothing[it is the smoothed average or mean of the difference of both the DIs(DI+ and DI-)] and DI length(periods).
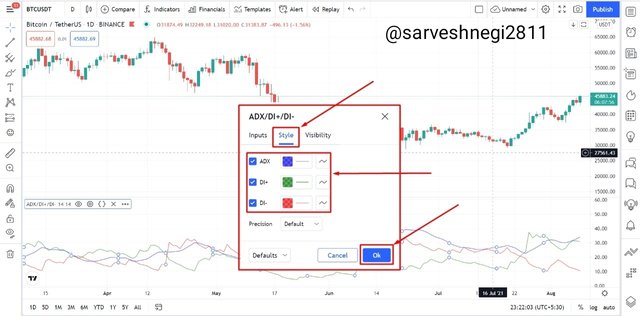
(2) Style: in the style section, you can change the colour of the ADX curve, DI+ curve and DI- curve as per your convenience.
The setting of an indicator varies with the trader, some traders think of default settings as the best and some traders change the default settings according to their trading style.
The default setting of ADX is set to focus on the last 14 periods.
To show which setting is best I will be changing the number of periods and then see how the indicator reacts to the price, the period I will be taking are 7(lower period) and 28(higher period than default)
(1) Period of 7: I am using a period of 7 and will look at what and how properly it indicates the strength of a trend and the point is that I am using a period that is less than the default settings period.
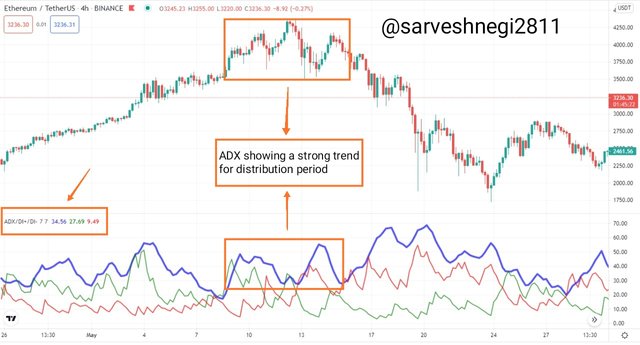
From the above chart of ETH/USDT, it can be seen that the ADX is reacting to every small movement of price making value of ADX more susceptible(sensitive). For a small movement in the price, ADX is reflecting a value of more than 25 showing a strong trend.
I have spotted a distribution region at the top of the price chart, distribution region has very little volatility due to equal control of buyers and sellers in the market but the ADX is showing a value of more than 25 for the distribution region.
My advice for someone who is using a period of 7 is to use another indicator in conjunction with ADX to get sure of the strength of the trend and to filter false signals and get advantage of quick signals provided by ADX for a period of 7.
(2) Period of 28: I am using a period of 28 and will look at what and how properly it indicates the strength of a trend and the point is that I am using a period that is greater than the default settings period.
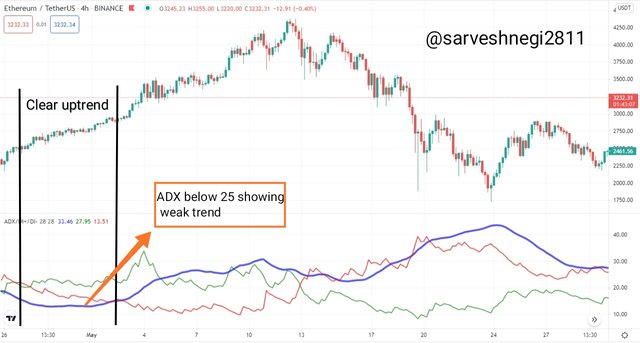
From the above chart of ETH/USDT, it can be seen that the reaction time of ADX to price movement has been reduced as we already know that ADX is a lagging indicator(provides signal only after price already started moving) but in the case of a period of 28, it becomes more lagging indicator.
I have spotted a region where a clear and strong uptrend can be seen easily but the ADX is showing a value of less than 25 and as soon as half of the uptrend has reached ADX started showing a value greater than 25.
A greater period like 28 can counter false signals and protect traders from false signals but ADX has become more lagging by using a greater period of 28. Providing a signal after half of the trend is gone make traders less profit in a trade.
(3) Period of 14: I am using a period of 14 which is set as a default period and will look at what and how properly it indicates the strength of a trend and the point is that I am using a period that is default settings period.
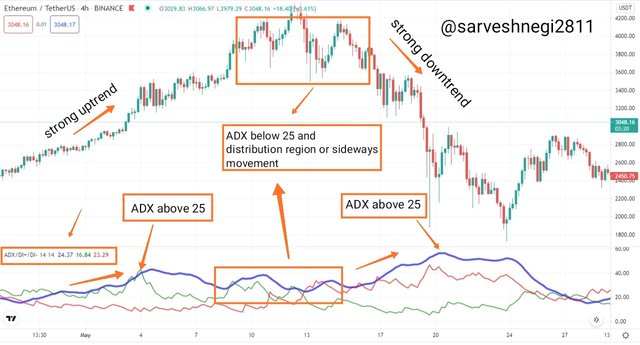
From the above chart of ETH/USDT, it can be seen that the reaction time of ADX to price movement is nearly proportional considering that ADX is a lagging indicator. The default setting period of 14 will give you a proper time to enter the trade unlike in period 28 where the signal is given by ADX after the half trend is gone.
Now comparing the default setting period of 14 to the period of 7, you can see the difference in volatility in the charts, period 7 is very volatile and provides false signals whereas the default setting period gives you an accurate and precise signal about the strength of the trend.
So If I were to choose I will choose an intermediate period that is not too greater not too small considering the reaction time of ADX and false signals. In my opinion, the default setting period(14) is the best one for swing trading when seen by comparing with a lower and greater period owing to its ability to faster reaction time than a greater period and tackle false signals better than lower period.
Well, the best settings can vary from trader to trader according to their trading style, as a swing trader uses a lower time frame of 1 minute or 5 minutes, it will be beneficial for him/her to use a greater ADX period(50-100) to remove unnecessary noise and false signals generated because of high susceptibility of ADX. The same can be said for the swing traders, for them, the best period can be 14-30 with another indicator in conjunction to make entry and exit in a trade.
Q-3) Do you need to add DI+ and DI- indicators to be able to trade with ADX? How can we take advantage of this indicator?
Do we need to add DI+ and DI- indicator in conjunction with ADX to trade?
As I mentioned above ADX is an indicator that tells us about the strength of a trend, not the direction of the trend, which makes ADX an indicator that must be used in conjunction with the indicator that tells us about the direction of the trend.
Using only ADX is like, I am running very fast in a race with blindfolds on but the point is I don't know whether I'm going in the right direction or not and for that I need someone to guide me in the right direction so that I can plan accordingly and win the race. The same is the case with ADX, it will tell you the trend is strong irrespective of the direction of the trend but adding DI+ and DI- gives or tells you the direction of that trend.
How DI+ and DI- works in conjunction with ADX?
DI+ and DI- will cross each other and then one of the curves will start moving above the other curve giving rise to a direction of the trend. The more the difference between the DI+ and DI- curves, the more the value of ADX.
By using DI+ and DI- in conjunction with ADX, we can get the direction of trend via DI+ and DI- and the strength of that trend can be determined with the help of ADX.
For more information, I will be talking about how can we take advantage of these indicators when used in conjunction with each other.
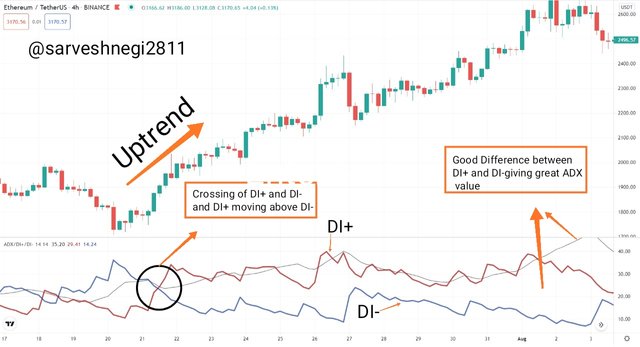
(1) When DI+ and DI- cross and DI+ goes above DI-:
In this case, when DI+ and DI- cross each other and DI+ goes above the DI-, an uptrend starts or an uptrend can be seen.
Now, how strong or how long will that uptrend be? So to answer that we are using ADX in conjunction with DI+ and DI- to know about the strength of that uptrend.
ADX value between 0-25: No uptrend or weak uptrend
ADX value between 25-50: Strong uptrend
ADX value between 50-75: Very strong uptrend
ADX value between 75-100: Extremely strong uptrend(might happen when a composite man(Wyckoff's method) tweets or advertises for an asset).
So by looking at the ADX one can easily know about the strength of the uptrend and can enter the market and accordingly set up his stop loss and take profit level to make a trade.
The more the difference between the DI+ and DI- curves, the more the value of ADX.
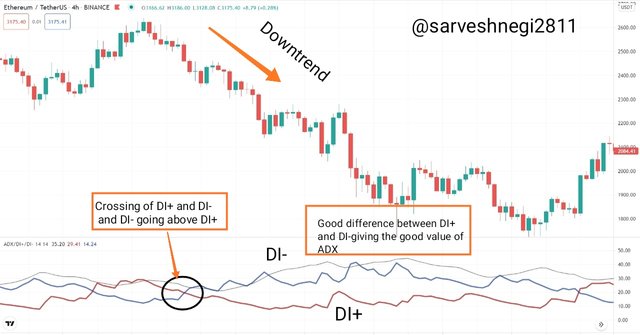
(2) When DI+ and DI- cross and DI+ goes below DI-:
In this case, when DI+ and DI- cross each other and DI+ goes below the DI-, a downtrend starts or a downtrend can be seen.
Now, how strong or how long will that downtrend be? So to answer that we are using ADX in conjunction with DI+ and DI- to know about the strength of that downtrend.
ADX value between 0-25: No downtrend or weak downtrend
ADX value between 25-50: Strong downtrend
ADX value between 50-75: Very strong downtrend
ADX value between 75-100: Extremely strong downtrend(might happen when a composite man(Wyckoff's method) criticise crypto asset ).
So by looking at the ADX one can easily know about the strength of the downtrend and can enter the market at a profitable level and buy assets.
The more the difference between the DI+ and DI- curves, the more the value of ADX.
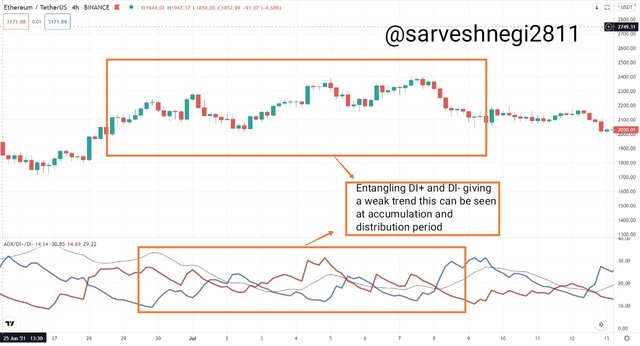
(3) Entangled DI+ and DI-:
When DI+ and DI- curves are entangled with each other it shows no trend or two periods can be seen:
(1) Accumulation period(after which an uptrend starts)
(2) Distribution period(after which a downtrend starts)
You can take advantage of the accumulation and distribution phase by buying assets at lower prices and selling assets at a higher price.
Note: As I have shown you with the third point curves DI+ and DI- usually entangles with each other very often due to the susceptibility towards the market, so the crossing of DI+ and DI- can not be considered as a buy signal, sell signal or a confirmed reversal.
Q-4)What are the different trends detected using the ADX? And how do you filter out the false signals? (Screenshot required)
ADX is an indicator that tells you about the strength of a trend irrespective of its direction whether it's up or down. The range of the ADX can be divided into 4 parts:
(1) 0 to 25: If ADX is showing a value between 0 to 25, it means that there is no trend or a weak trend.
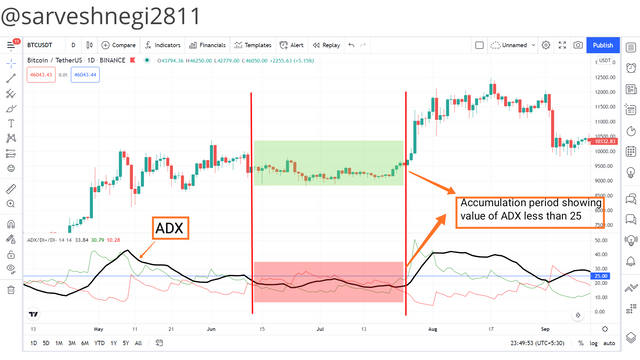
This range of 0-25 represents the accumulation(slowly buying of assets) and distribution(slowly selling the asset) period.
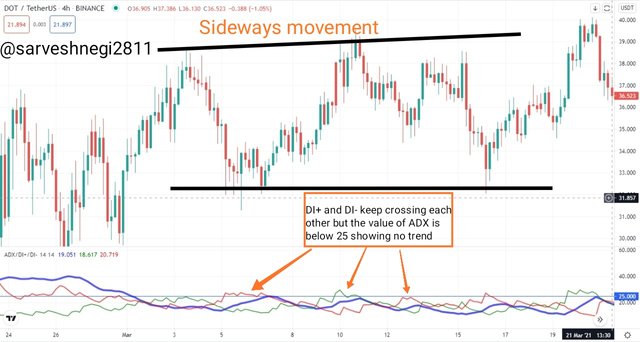
These accumulation and distribution periods can be spotted easily as there is a sideways movement of the price and the value of ADX is below 25.
(2) 25 to 50: If ADX is showing a value between 25 to 50, it reflects the presence of a strong trend in the market.
As soon as ADX cross the value of 25 and goes above it confirms a trend and the direction of the trend can be determined by using DI+ and DI- curve, we should wait for the ADX to go above 25 to make a move in the market.
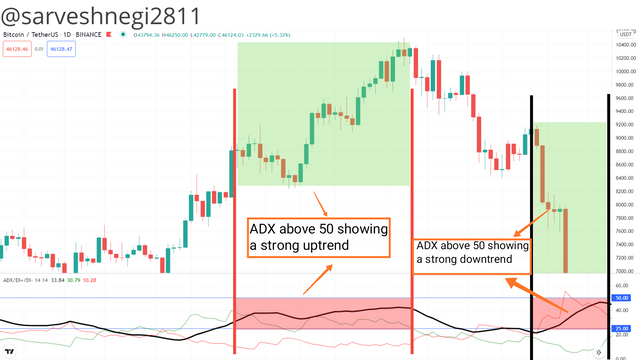
(3) 50 to 75: If ADX is showing a value between 50 to 75, it reflects the presence of a very strong trend in the market.
When ADX goes above the range of 50 it reflects a very strong trend due to the buying or selling of assets in mass or a greater volume, new support and resistance level get created, we can apply BRB(break retest break strategy) and MSB(market structure break) strategy when the value of ADX is above 50 to make a profit while trading.
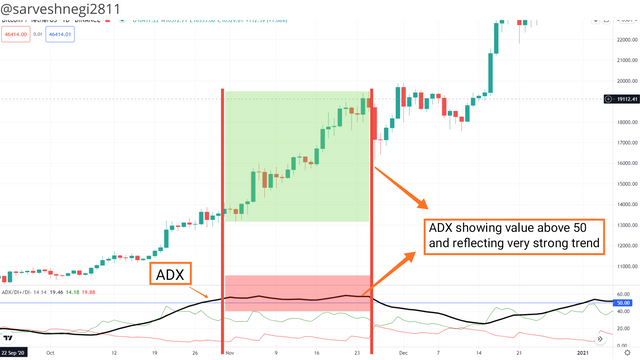
(4) 75 to 100: If ADX is showing a value between 75 to 100, it reflects the presence of an extremely strong trend in the market. (extreme volatility)
It shows very high volatility in the market for any reason and that reason could be a tweet by a famous person(Composite man in Wyckoff's method) in favour of an asset or a tweet criticising an asset.
The more the difference between the DI+ and DI- curves, the more the value of ADX.
You can also see the above point getting in work, in a weak or no trend DI+ and DI- entangle with each other and thus the value of ADX is below 25.
in a strong trend DI+ and DI- curves are at some distance from each other and thus the value of ADX is above 25.
In a very string trend DI+ and DI- are at significant distance from each other and thus the value of ADX is above 50.
In an extremely strong trend DI+ and DI- curves have large gap between them and thus the value of ADX is above 75.
Nothing is perfect in this world and the same goes for the ADX indicator, it doesn't matter how accurate and how handy the ADX indicator is, there are some false signals always and to counter those false signals we can use many ways.
I will be talking about 3 ways to tackle false signals:
(1) Using DI+ and DI- in conjunction with ADX:
Some traders claim and think of crossing of DI+ and DI- as a sign of buying, selling and a reversal, but it is not completely true or the case here. Due to the high susceptibility of DI+ and DI- curves, they react very fast and provided the same via indicator to any change in the price in a period.
How can we filter the signal made by the crossover of DI+ and DI-
As we all know that when DI+ and DI-/cross each other and one of them goes above another to give rise to a trend but that trend is not confirmed until or unless ADX provides a value that tells that the strength of the trend is strong.
(a) Crossing of DI+and DI- and then DI+ goes above DI-:
This is the condition of an uptrend and many traders think of it as a buying signal and enter the market but instead of entering the market traders must look for the strength of that uptrend via ADX, by doing this one can be confirmed of the trend and make a profit.
(b) Crossing of DI+and DI- and then DI+ goes below DI-:
This is the condition of a downtrend and many traders think of it as a selling signal and leave the market but instead of leaving the market traders must look for the strength of that downtrend via ADX, by doing this one can be confirmed of the trend and make a profit by leaving the market at right time.
(2) By using a time frame that is not very small:
I have already mentioned that while using a smaller time frame we face a lot of wrong signals because of the higher susceptibility of ADX for smaller periods than the default settings.
How can we filter the wrong signals produced by a smaller period of ADX?
To filter wring signals produced by ADX for a lower period, we can:
(a) Use another indicator in conjunction(in the next part)
(b) Avoid using a lower period(this part)
In the example below, you can see that I have provided two charts, one with a period of 7 and the other with a period of 14(default settings).
It can be seen via the examples given below that the ADX with period 7 is providing a large number of false signals that can make traders take the wrong trade and suffer a loss. Due to the high susceptibility to a smaller change in the market for ADX of period 7 it provides high volatility with lots of false signals.
While using ADX of period 14, you will not see a single false signal that can make you take the wrong step and suffer a loss, so it is always advisable to use a period that is not too small and if you are using a small period, you must use ADX in conjunction with another indicator to get confirmation of the trend.
(3) By using any other Indicator in conjunction
It is advisable to always use another indicator to trade as it reduces the risk of loss and increases the chance of getting a profit.
How can we filter the wrong signals produced by ADX by using RSI in conjunction?
I'm using RSI along with ADX to filter wrong signals produced by ADX(14 periods)
Condition for overbought in RSI indicator: when the value of RSI goes above 70, an asset is considered to be overbought. Overbought means the demand is exceeding the supply.
Condition for oversold in RSI indicator: when the value of RSI goes below 30, an asset is considered to be oversold. Oversold means the supply is exceeding the demand.
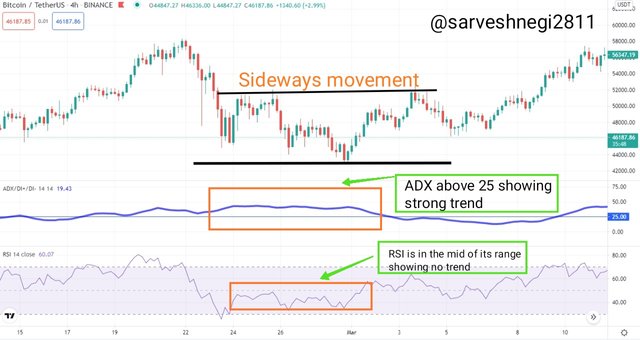
As it can be seen in the example below, the value of ADX is above 25 reflecting a strong trend but the RSI is in the middle at level 50 showing no trend and the same can be seen for the price as the price is moving sideways without any trend.
So by using RSI in conjunction with ADX, we can filter the false signals produced by ADX.
So I have stated above the three methods to filter the false signals in ADX indicator.
Q-5) Explain what a breakout is. And How do you use the ADX filter to determine a valid breakout? (Screenshot required)
Breakout refers to the breaking of previous resistance and support level and going above and below it making new resistance and support levels.
Breakouts can be fake and valid as well. First, we will be talking about the valid breakout. Now a breakout can either break the previous resistance and support level but how I would know that it will break the previous resistance and support.
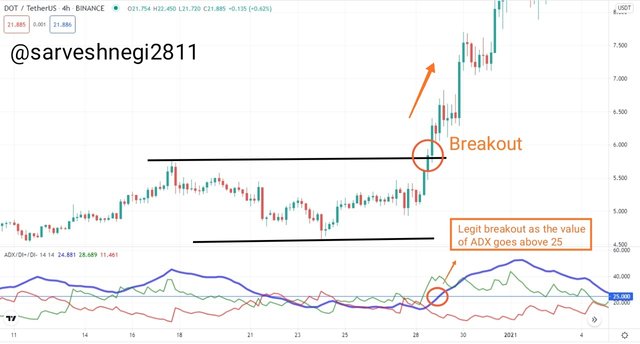
(1) Breakout in the upward direction: it means that the price has broken the previous resistance level and went above it making new resistance.
How to confirm a valid breakout in the upward direction?
Two conditions must fulfil to confirm a valid breakout in the upward direction:
(a) DI+ must be above DI-.
(b) ADX must move above the level of 25(strong trend) after staying in the level below 25 for a period.
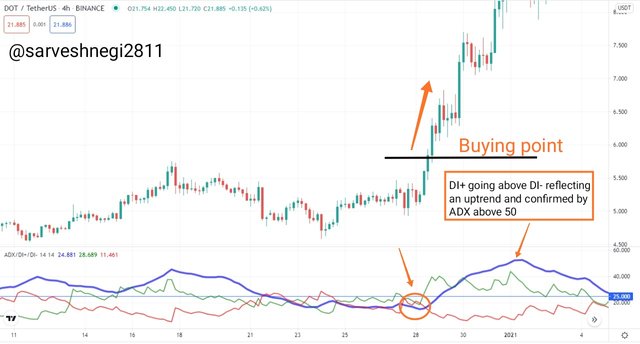
In the example below, you can see the value of ADX was below 25 for a certain time and we can call that period "accumulation period" and as soon as the value of ADX moves above 25, a breakout can be seen in the upward direction breaking previous resistance.
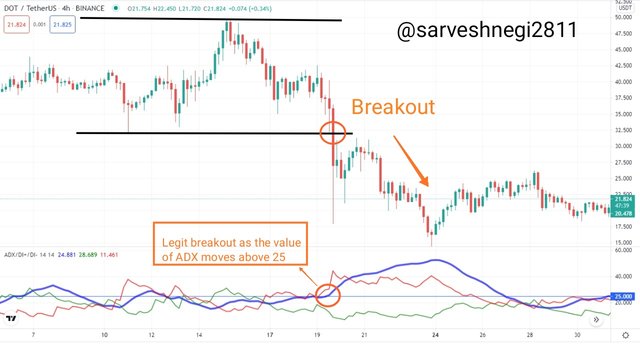
(2) Breakout in the downward direction: it means that the price has broken the previous support level and went below it making new support.
How to confirm a valid breakout in the downward direction?
Two conditions must fulfil to confirm a valid breakout in the downward direction:
(a) DI+ must be below DI-.
(b) ADX must move above the level of 25(strong trend) after staying in the level below 25 for a period.
In the example below, you can see the value of ADX was below 25 for a certain time and we can call that period "distribution period" and as soon as the value of ADX moves above 25, a breakout can be seen in the downward direction breaking previous support.
We have already talked about how to recognise a valid breakout via ADX, now we will be talking about how can we know that a breakout is fake.
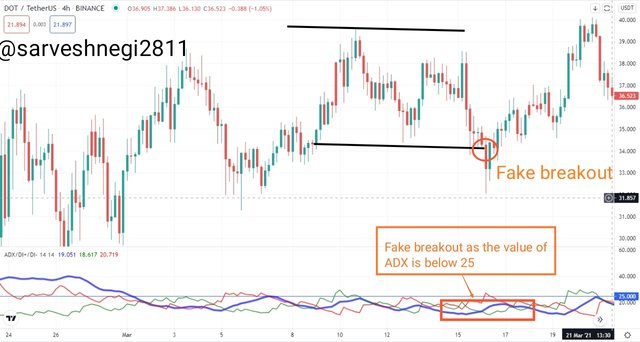
Condition for a fake breakout
(1) There is only one condition for a fake breakout and that is if for a breakout, the ADX value is below 25 irrespective of the crossing of DI+ and DI- curve, the breakout is considered as a fake breakout as the trend will be very weak and the price will not be able to break the previous resistance and support levels.
In the example below, you can see a fake breakout as the breakout appears to be breaking the previous support level to go below it but the value of ADX is below 25 reflecting a weak trend and a fake breakout. You can also see that the price started moving upward again after that fake breakout that satisfies our condition.
So I have shown all the necessary screenshots required to filter valid breakouts using ADX.
Q-6) What is the difference between using the ADX indicator for scalping and for swing trading? What do you prefer between them? And why?
Using ADX for scalping trading
Scalping trading is a type of trading that is used by traders to earn little profit in a short time frame as short as one minute or five minutes.
Using ADX for scalping trading can be beneficial as the ADX will tell us about the direction of the trend but the only problem with the shorter time frame is that the ADX reacts very fast to every price movement that has been made in the market in that shorter time frame. In other words, sensitivity or susceptibility of ADX increases inversely to the time frame, higher the susceptibility and shorter the time frame used for trading.
To tackle this problem one can increase the period of ADX as we did in the earlier question, using a higher period of ADX will overcome the susceptibility in the scalping trading. We can set our period of ADX to 100 to avoid false signals and unnecessary noise that will generate while scalping trading.
Furthermore, we can use another indicator in conjunction with ADX to be sure about the trend, I would prefer to use RSI, slow stochastic,ATR and MACD in conjunction with ADX to be sure about the trend and my entry and exit point while scalping trading.
How can we use RSI and ADX in combination for scalping trading?
We must set the period of ADX to 100 for a lower time frame of 5 minutes and we will use a fast RSI(2) in conjunction with ADX to trade in the lower time frame of 5 minutes.
ADX with a period of 100 will remove all the unnecessary noise and false signals whereas Fast RSI will be used to take entry after confirmation from the following candles.
(A) Sell signal:
Condition for sell signal:
DI+ must be below DI- and the value of ADX must be above 25.
Entry: We will take entry at the next bearish candle after the RSI reached the level of the overbought zone(70).
Take profit or exit: When DI+ starts moving upward, crossing DI- and goes above DI-.
(B) Buy signal:
Condition for Buy signal:
DI+ must be above DI- and the value of ADX must be above 25.
Entry: We will take entry at the next bullish candle after the RSI reached the level of the oversold zone(30).
Take profit or exit: When DI- starts moving upward, crossing DI+ and goes above DI+.
Using ADX for swing trading
Swing trading is a type of trading that is used by traders to earn a good profit in a time frame of few hours(2&4). The most used time frame for swing trading is the 4 hr time frame.
Unlike Scalping trading, we don't need to increase the value of ADX to 100 to reduce the false signal, as a period of 20 will work better for a time frame of 4 hours. Because sensitivity or susceptibility of ADX increases inversely to the time frame, the higher the time frame and the shorter the period of ADX used used for trading.
In comparison to scalping trading, swing trading is very much easier provided that the trader knows how to place trades and remains patient to place the trades.
Just to be more sure and not relying completely on ADX, we can use a pivot point indicator to see resistance and support level or we can use EMA that can work as resistance and support(that I came to know about through professor @cryptokraze homework task).
How can we use EMA and ADX in combination for swing trading?
We must set our period of ADX to a value that will benefit us and for me, it will be a period of 20.
(A) Sell signal:
Condition for sell signal:
DI+ must be below DI- and the value of ADX must be above 25.
Entry: We will take entry at the next bearish candle after the price bounce back from the resistance created by EMA.
Take profit or stop loss exit: When DI+ starts moving upward, crossing DI- and goes above DI-. Our stop loss must be positioned just above the entry point.
(B) Buy signal:
Condition for Buy signal:
DI+ must be above DI- and the value of ADX must be above 25.
Entry: We will take entry at the next bullish candle after the price bounce back from the support created by EMA.
Take profit or stop loss exit: When DI- starts moving upward, crossing DI+ and goes above DI+. Our stop loss must be positioned just below the entry point.
What do I prefer and why?
If I were to choose between scalping and swing trading via ADX, I would go for swing trading as it is already free of false signals and unnecessary noise that will generate while scalping trading.
Another reason for choosing swing trading is that it is more reliable than scalping irrespective of the time taken by swing trading and as long as time is considered, I would choose to spend more time in swing trading than losing more money in scalping trading.
My third reason would be the time frame used in scalping trading which is very low, being a confused and slow learner, I think I would not be able to make the right decision regarding perfect entry and exit points in that smaller time frame.
In a nutshell, ADX is an indicator that tells you about the strength of the trend and when used in conjunction with DI+ and DI- curves it tells about the direction of the trend too, a setback of ADX indicator is that it is a lagging indicator.
The value of ADX varies from 0 to 100 which is divided into 4 sections of 0-25(weak trend), 25-50(strong trend), 50-75(very string trend) and 75-100(extremely strong trend). ADX is none directional indicator that means it is irrespective of the direction of the trend it will show only the strength of the trend.
Traders trade according to their trading style but the default settings of ADX which includes a period of 14 is the best setting if you are a swing trader and if you are a scalp trader you can change it accordingly.
ADX also filters the fake breakout by showing or reflecting the weak trend in the value of ADA, and different indicators can be used in conjunction with ADX to filter false signals in ADX.
And at last, I just want to say that like every other indicator ADX has its demerits but when it comes to determining the strength of a trend ADX is one of the best indicators is have ever used.
Thank you
That was all from my side
For the attention of @kouba01
Hello @sarveshnegi2811,
Thank you for participating in the 7th Week Crypto Course in its third season and for your efforts to complete the suggested tasks, you deserve a 10/10 rating, according to the following scale:
My review :
Excellent article which outlines the topic in detail. It was well-written and contained sound, practical answers which confirm your good understanding of the questions asked.
Thanks again for your effort, and we look forward to reading your next work.
Sincerely,@kouba01
Thank you professor @kouba01