Steemit Crypto Academy | Season3|Week 2: The Market Structure Break(MSB) strategy for trading reversals - Homework task for @cryptokraze
Hey steemians
In this post I will be submitting my homework task for @cryptokraze.


1 - What do you understand about Market Structure?
It is all thanks to the volatility of the cryptocurrency market that causes different types of trends and patterns in a price chart and these trends or patterns constitutes or structures a market.
So if we go for a definition we can say that Market Structure is just action of price lines that show the movement of the market and make a pattern that leads to a trend, it doesn't matter whether the trend is upward or sideways or downward. Nothing is certain in the world of cryptocurrency but we can keep track of the movement of the market and can predict the future price.
The market structure for different trends:
There are mainly 3 trends:
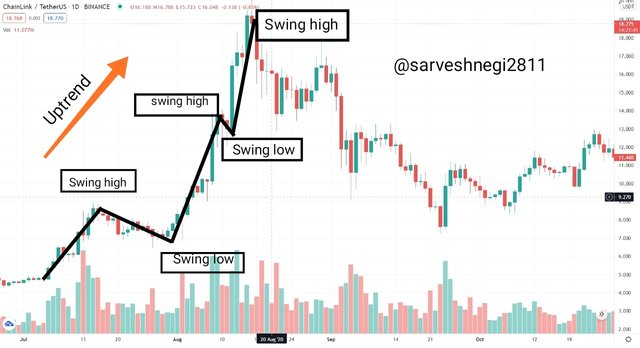
(1) Uptrend: As the name suggests when the price is going in an upward direction and making a specific pattern that constitutes highs and lows waves.
Spotting of Market structure for Uptrend:
There will be a wave that is starting the trend in an upward direction known as a swing high and then a small downward wave called swing low, following these waves there will be another wave in the direction of swing high but this wave will be higher than the previous swing high and this wave is called Higher high(another swing high but higher than the previous one) and then there will appear a wave in a downward direction but higher than the previous swing low and these waves constitute a zig-zag pattern.
There could be many waves in an uptrend until a wave that is lower than the previous high appears.

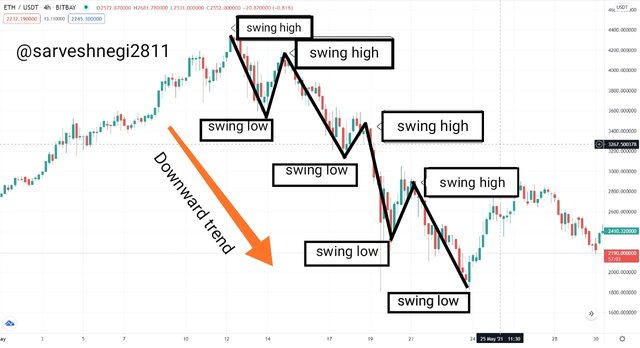
(2) Downtrend: As the name suggests when the price is going in a downward direction and making a specific pattern that constitutes highs and lows waves.
Spotting of Market structure for Downtrend:
There will be a wave that is starting the trend in a downward direction known as a swing low and then a small upward wave called swing high, following these waves there will be another wave in the direction of the swing low but this wave will be lower than the previous swing low and this wave is called Lower low(another swing low but lower than the previous one) and then there will appear a wave in an upward direction but lower than the previous swing high and these waves constitute a zig-zag pattern.
There could be many waves in a downtrend until a wave that is higher than the previous low appears.
(3) Sideways: When the price is moving sideways and not having so much movement, in some theories this period is said to be an accumulation period or distribution period.
The lecture is about Market structure break strategy to trade reversal and I don't see any point in spotting a sideways trend, but for some information, some highs and lows of equal length taking place between a particular resistance and support level constitutes a sideways trend.
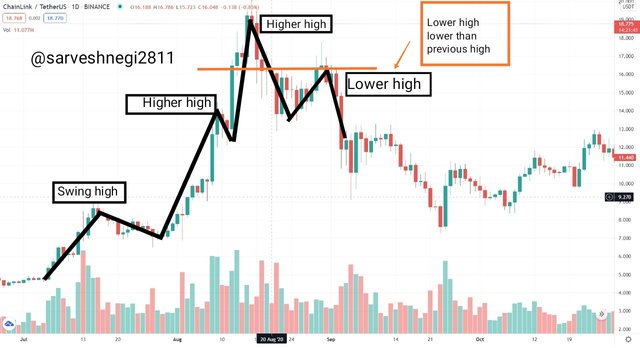
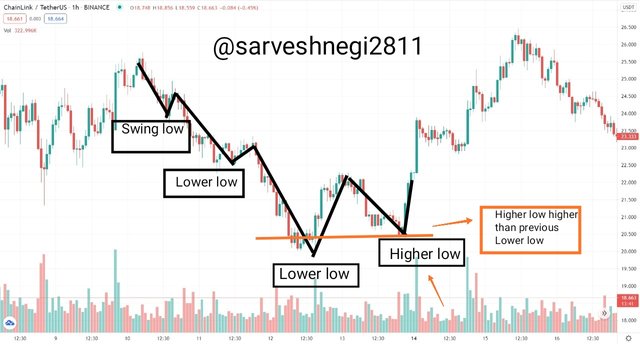
2 - What do you understand about Lower High and Higher Low? Give Chart Examples from Crypto Assets.
Life has its up and down phases and it will never be remaining in one of the phases, sometimes it's going good and sometimes it's bad. The same is the case here while looking at a price chart, sometimes it's up and sometimes it's down, but it will never be in the same direction of the trend.
Lower high
As I mentioned above, an uptrend is a result of continuous swing highs and lows that are higher than the previous highs and lows, but when a correction happens in the market, corrective waves appear in the opposite direction of the trend of the market So you can think of a "Lower high" as corrective waves that are lower than the previous swing high and thus lead to the break of an uptrend. As these waves just formed after the Higher high(the highest point of an uptrend), these waves are found at the peak of an uptrend.
Higher low
A downtrend is a result of continuous swing lows and highs that are lower than the previous swing highs and lows but at the time of correction in the market, corrective waves appear in the direction opposite to the trend of the market. We can think of "Higher low" as corrective waves that are higher than the previous swing low and thus leads to the break of a downtrend. As these waves just formed after the Lower low(the lowest point of a trend) so these waves are found at the bottom of a downtrend.
3 - How will you identify Trend Reversal early using Market Structure Break?
The reversal in trend is something that can cause anyone a loss of multiple folds, so it becomes important for any trader to know about the procedure of trend reversal.
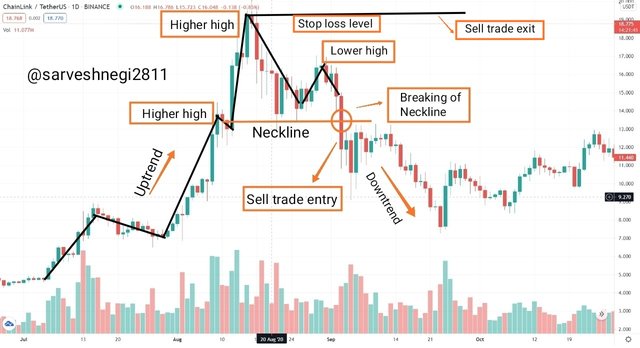
To identify an uptrend reversal early:
Three conditions must be fulfilled to confirm an uptrend reversal and these conditions are:
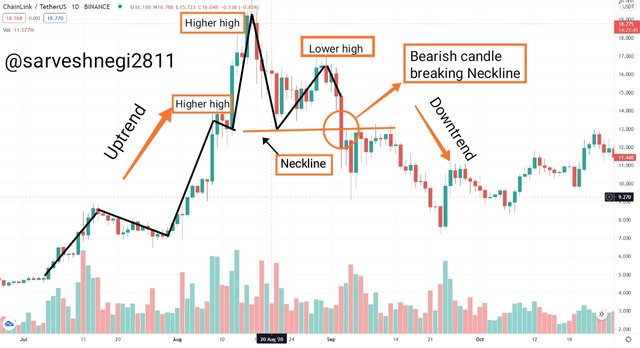
(1) Appearance of a lower high at the peak of the price chart.
(2) Set neckline at the level where price bounces back and give rise to lower high.
(3) Look for a candle(bearish) that crosses or breaks the neckline.
In the example below you can see a clear change in trend from upward trend to a downward trend.
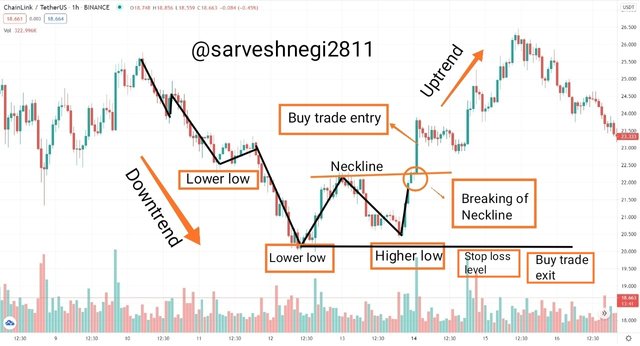
To identify a downtrend reversal early:
Three conditions must be fulfilled to confirm a downward trend reversal and these conditions are:
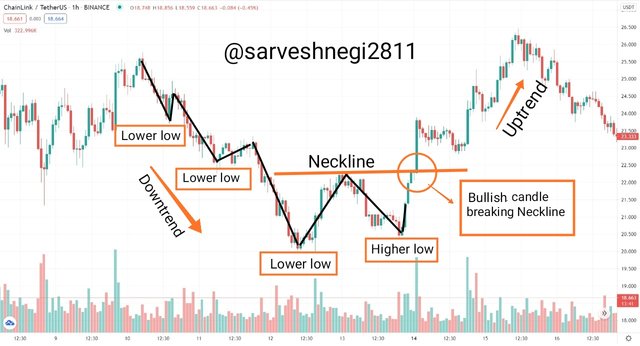
(1) Appearance of a Higher low at the bottom of the price chart.
(2) Set neckline at the level where price bounces back and give rise to a Higher low.
(3) Look for a candle(bullish) that crosses or breaks the neckline.
In the example below you can see a clear change in trend from downward trend to an upward trend.
4 - Explain Trade Entry and Exit Criteria on any Crypto Asset using any time frame of your choice.
We enter a market to trade and make a profit by selling our holdings or buying assets, everyone wants to make a profit and to make a profit, one can buy an asset when the price of the asset is low or sell his holdings when the price is high. This is obvious and a common thing that anyone knows but very few knows how and where to enter the market? So now I will be talking about trade entry criteria.
One can enter the market for two purposes:
(1) Buy an asset
(2) Sell holdings
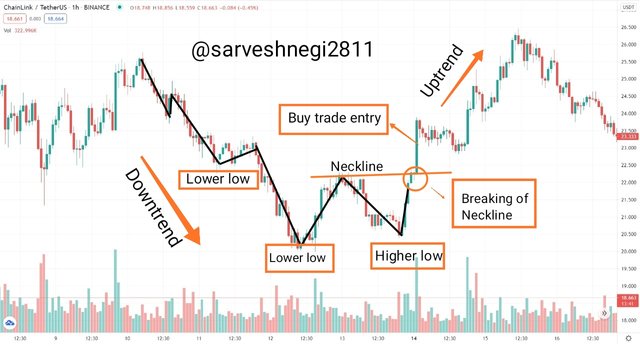
(1) Buy entry criteria:
(a) As I mentioned above everyone wants to buy assets at a low price so the trend must be downward.
(b) Appearance of a Higher low after a series of continuously lower lows.
(c) Position the neckline at the level from where a price bounces back and make a Higher low.
(d) Look for a bullish candle to break the neckline, this breaking of the neckline causes the reversal in trend and that's why it is called Market structure break.
(e) Enter the market for a buy trade at a level above the breaking of the neckline level.
Example is given below:
(2) Sell entry criteria:
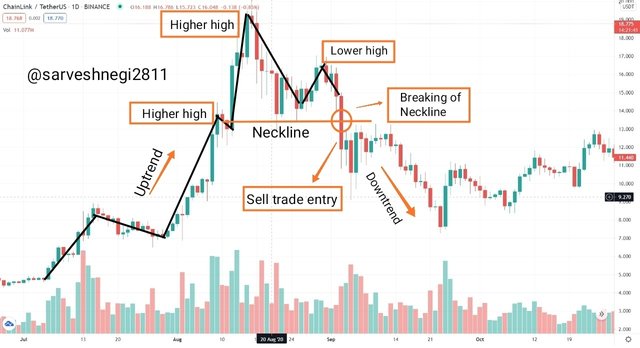
(a) As I mentioned above everyone wants to sell assets at a high price so the trend must be upward.
(b) Appearance of a Lower high after a series of continuously Higher highs.
(c) Position the neckline at the level from where a price bounces back and make a Lower high.
(d) Look for a bearish candle to break the neckline, this breaking of the neckline causes the reversal in trend and that's why it is called Market structure break.
(e) Enter the market for a sell trade at a level just below the breaking of the neckline level.
Example is given below:
After entering a market one should always know one's exit point otherwise one should suffer a loss of multiple folds or miss a profit that could have hit easily.
So a trader exits a trade in 2 conditions, the first one is when he hits his target and the second when the trade is going in the wrong direction and the trader is losing.
So in the exit criteria, I will be talking about:
(1) Trade exit criteria when trade is in the loss.
(2) Trade exit criteria when trade is in the profit.
(1) Trade exit criteria when trade is in the loss.
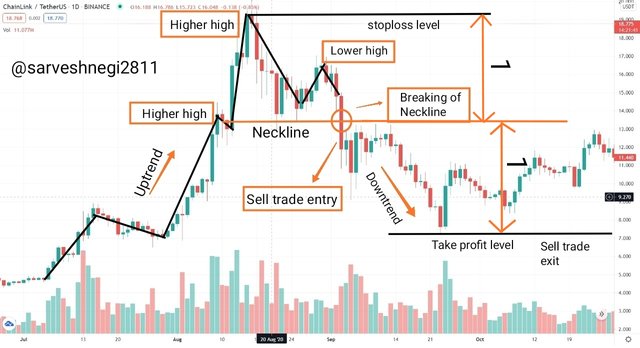
(a) A stop-loss must be there all the time so that when our trade goes wrong, we can exit at the stop-loss level.
(b) Position of stop-loss:
- For Buy trade: Must be below the Higher low level.
- For Sell trade: Must be above the Lower high level.
(c) If the price crosses the stop loss level, we should understand that our strategy failed or was wrong and exit the market.
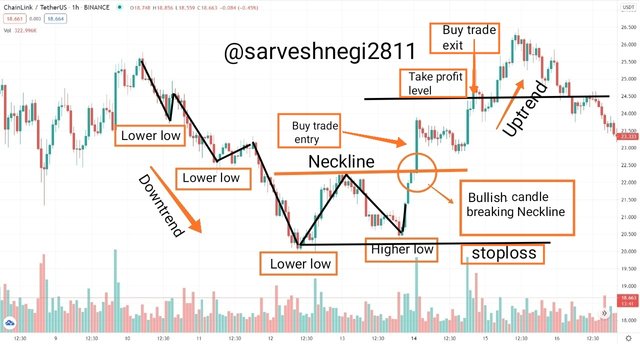
(2) Trade exit criteria when trade is in profit.
(a) A take profit level must be there all the time so that when our trade goes in the direction we desired or predicted, we can book that profit at take profit level and exit the trade.
(b) Take profit level must be greater than or equal to 1:1 (Risk to reward ratio), this ratio can vary from trader to trader.
(c) Wait for the price to reach the take profit level then book your profit and exit the trade.
5 - Place 2 demo trades on crypto assets using Market Structure Break Strategy. You can use lower timeframe for these demo trades
First demo trade using market structure break strategy.
I have used a time frame of 1 hr and the crypto asset pair I used is SOL/USDT. I have executed a sell trade.
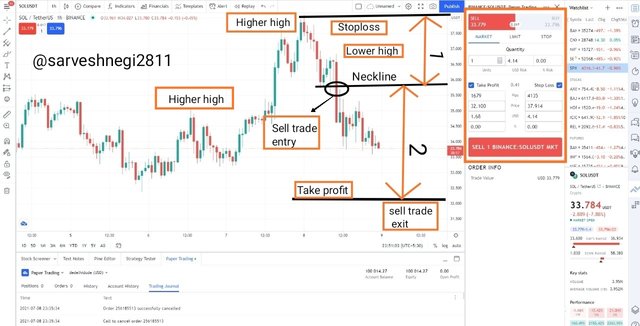
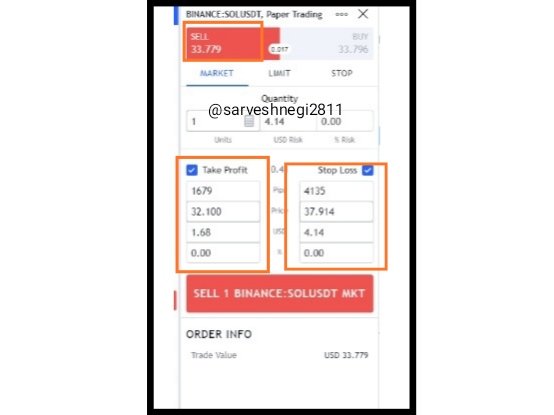
Details of my trade:
Sell trade entry: 35.900 USDT
Neckline: 36.000 USDT
Stoploss: 37.914 USDT
Sell trade exit: 32.100 USDT
I have chosen a risk to reward ratio of 1:2(approx), it is an approximation as I didn't have that much command now but i tried my best to make it a risk to reward ratio of 1:2.
Demo trade 2 using market structure break strategy.
I have used 1 hr time frame and the pair I used was ETHBTC. I have executed a sell trade for this pair.
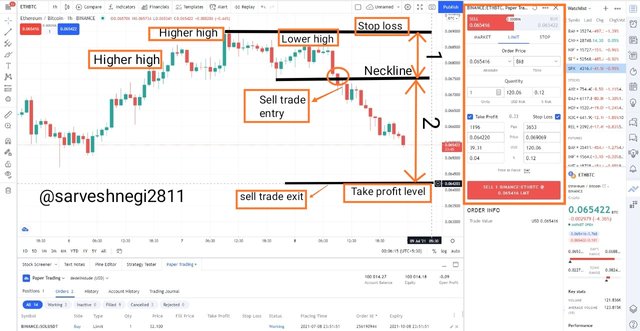
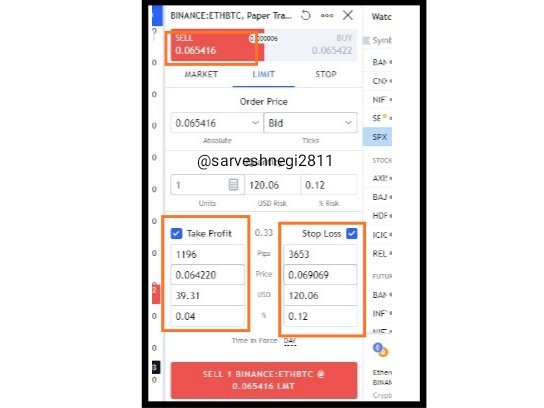
Details of my trade:
Sell trade entry: 0.067400
Stoploss: 0.069069
Sell trade exit: 0.064220
Neckline: 0.067500
I have chosen a risk to reward ratio of 1:2, as I was able to get the right entry point and neckline level.
Due to your lecture I was able to spot reversal and position neckline, trade entry and exit level and all this helps me to place these 2 trades.
Conclusion
In conclusion I just want to say that at first i was thinking of this strategy a cumbersome one but after trying to understand and going through you lecture again and again I was able to dine this homework. This strategy is very good to identify or spot the trade reversals and gives you perfect entry and exit levels and when understood it is easy to apply.
Thank you
That was all from my side
Hope you like it
For the attention of @cryptokraze.
Congratulations! Your post has been selected as a daily Steemit truffle! It is listed on rank 21 of all contributions awarded today. You can find the TOP DAILY TRUFFLE PICKS HERE.
I upvoted your contribution because to my mind your post is at least 1 SBD worth and should receive 26 votes. It's now up to the lovely Steemit community to make this come true.
I am
TrufflePig, an Artificial Intelligence Bot that helps minnows and content curators using Machine Learning. If you are curious how I select content, you can find an explanation here!Have a nice day and sincerely yours,

TrufflePigYou have been upvoted by @sapwood, a Country Representative from INDIA. We are voting with the Steemit Community Curator @steemcurator07 account to support the newcomers coming into Steemit.
Engagement is essential to foster a sense of community. Therefore we would request our members to visit each other's post and make insightful comments.
Thank you