[Heikin-Ashi Trading Strategy]-Steemit Crypto Academy | S4W2 | Homework Post for @reddileep
Hey steemians,
In this post i will be submitting my homework task for professor @reddileep.
1- Define Heikin-Ashi Technique in your own words.

Heikin-Ashi technique is a technique used for performing technical analysis of a price chart of an asset and then use it for placing trades in the market to make a profit.
Heikin-Ashi is a Japanese translation for Average bar or pace which means that the pattern made using Heikin-Ashi runs at an average pace and gives a smooth pattern, unlike normal candlestick patterns where volatility can be seen.
Heiken-Ashi uses the information of the previous candle and then form the next candle accordingly by taking the average of the data of the previous candle. So you can say Heiken-Ashi is a two-period average.
Now the data that is required to form the next candle in the Heiken-Ashi technique is:
(a) Opening price of the previous candle
(b) Closing price of the previous candle
(c) The Highest point or price of the previous candle
(d) The Highest point or price of the previous candle
So by taking the average of the previous candle a next candle generates or forms and thus it leads to the formation of a smooth pattern with clear trends unlike in a normal candlestick pattern.
Note: Heiken-Ashi is a 2-period average so it will not lag as much as other moving averages because the smaller the period the smaller the lag.
Now, all the candles are related to each other in the Heiken-Ashi technique unlike in a normal candlestick pattern, so the Heiken-Ashi indicator or chart tells us about the clear indication of the trend in the market.
We can clearly see:
(a) A strong trend
(b) Trend reversal
(c) Indecision or sideways trend
We can also see all of the abovementioned trends in a normal candlestick chart but by using or taking the average in Heiken-Ashi these trends can be seen clearly.
Munehisa Homma was the one who developed or created the Heiken-Ashi chart to get a clear view of the market in the 1700s, he is also the developer or inventor of candlestick charts. It was quite shocking for me when I got to know that he developed the Heiken-Ashi chart in the 1700s without using any modern tools, What is your opinion on it?
In a nutshell, using the Heiken-Ashi indicator or chart we can get a clear view of the chart along with the trends without any volatility and noise in the chart of an asset and all this is made possible by taking data from the previous candle and averaging it.
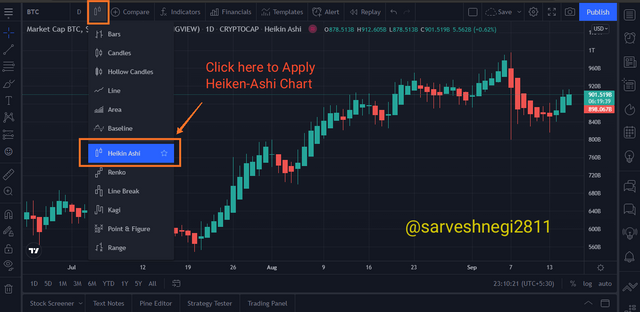
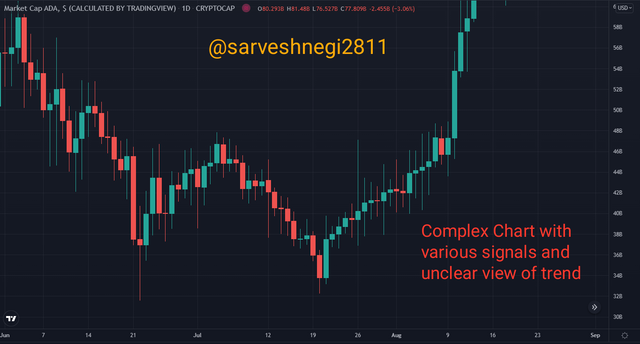
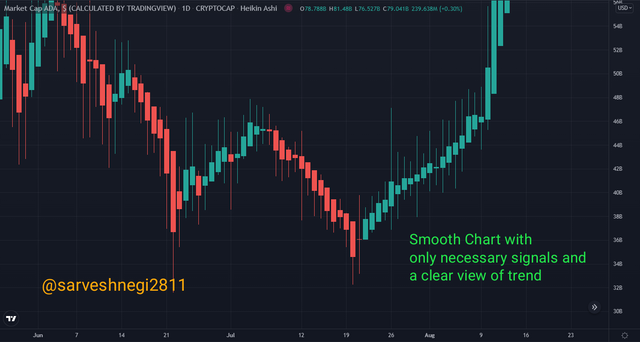
2- Make your own research and differentiate between the traditional candlestick chart and the Heikin-Ashi chart. (Screenshots required from both chart patterns)
| Candlestick chart | Heiken-Ashi |
|---|---|
| Candlestick chart looks complicated and thus unable to give a clear view of trends. | Heiken-Ashi chart looks smooth and gives a clear view and indication of trends. |
| Candlestick chart | Heiken-Ashi |
|---|---|
| Candlestick chart is more susceptible to any change in the market. | Heiken-Ashi chart is less susceptible to any change in market and provides a smooth pattern or trend. |
| Candlestick chart | Heiken-Ashi |
|---|---|
| The Candlestick chart doesn't give a clear idea or view of trends. | Heiken-Ashi chart gives a clear view of trends and thus helps in trading. |
| Candlestick chart | Heiken-Ashi |
|---|---|
| In the candlestick chart, the next candle starts from the closing of the previous candle. | in the Heiken-Ashi chart, the next candle is formed based on calculations. |
| Candlestick chart | Heiken-Ashi |
|---|---|
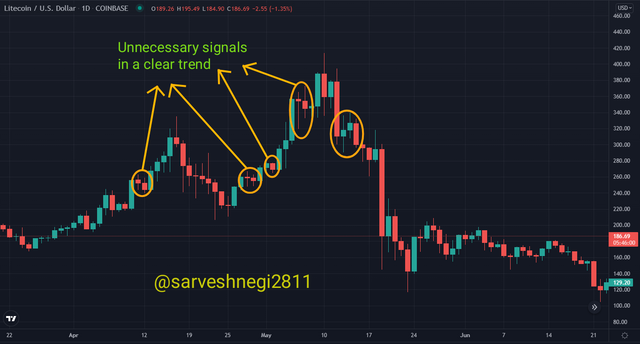
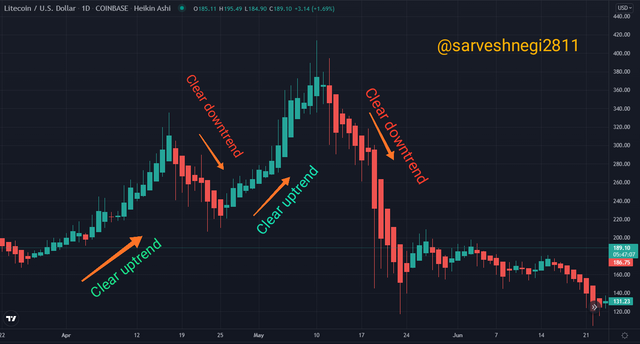
| Noises and fluctuations can be seen easily in the candlestick chart in the form of bearish and bullish candle in a clear uptrend and downtrend. | Noises and fluctuations can not be seen easily in the Heiken-Ashi chart because of the calculation involved and averaging the data of previous candle. |
| Candlestick chart | Heiken-Ashi |
|---|---|
| In candlestick chart, current candles shows the recent or updated price of an asset which also serves as the closing price of the candle. | But in Heiken-Ashi chart, it is not important that the current candle shows the recent or updated price of an asset because of the averaging of the data, and that's why it sometimes comes with two price scales. |
| Candlestick chart | Heiken-Ashi |
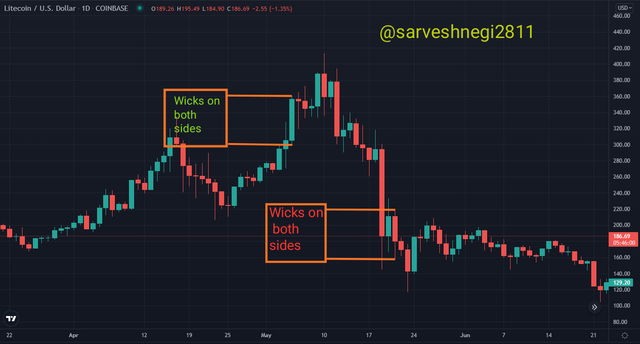
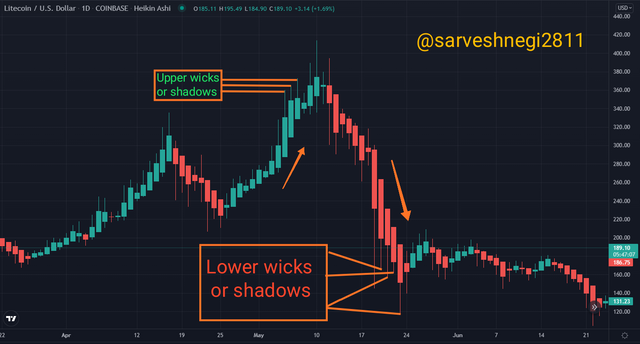
|---|---|
| Candles in Candlestick chart possess shadows or wicks in both side of the candle. | In Heiken-Ashi, candles in strong uptrend has wicks or shadows in upward direction and in strong downtrend candles has wicks or shadows formed in downward side or direction. |
So i have stated the difference that i have faced during my encounter with Heiken-Ashi chart or technique and the parameters of difference are also stated.
3- Explain the Heikin-Ashi Formula. (In addition to simply stating the formula, you should provide a clear explanation about the calculation)
There are 4 types of calculation involved in the Heiken-Ashi technique and these calculations are:
(A) Heiken-Ashi Opening Price
(B) Heiken-Ashi Closing Price
(C) Heiken-Ashi High Price
(D) Heiken-Ashi Low Price
(A) Heiken-Ashi Opening price: Opening price is the price at which the very first trade of the day took place. In the Heiken-Ashi technique or indicator, the Heiken-Ashi Opening price depends upon the opening and closing price of the previous day or candle.
Simply put, we should take the arithmetic mean of the opening and the closing price of the previous candle and we can get the Heiken-Ashi opening price for the current candle.
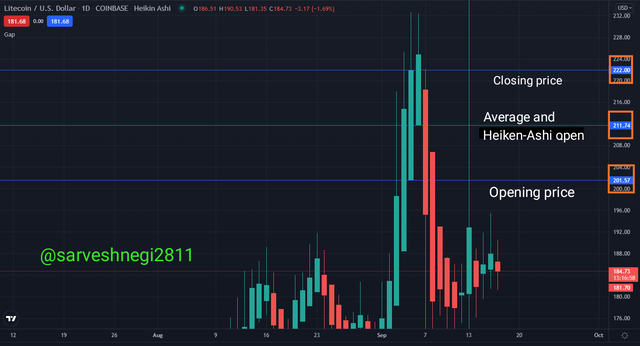
Closing price of the previous candle: 222
Opening price of the previous candle: 201.57
Heiken-Ashi open: (222+201.57)/2 = 211.785~211.74(because I couldn't go to the precisin level this value varies)
(B) Heiken-Ashi Closing price: Closing price is the price at which the very last trade of the day took place. In the Heiken-Ashi technique or indicator, the Heiken-Ashi Closing price depends upon the highest price, lowest price, opening price and closing price of the current candle.
Simply put, we should take the arithmetic mean of the opening price, the closing price, high and low of the current candle and we can get the Heiken-Ashi closing price for the current candle.
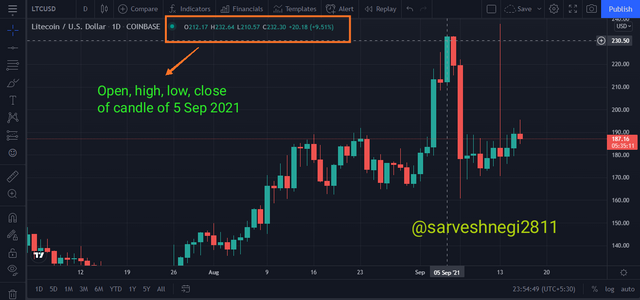
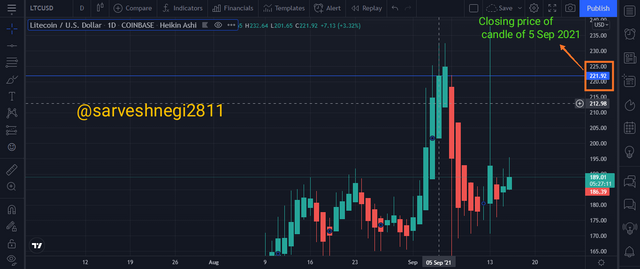
High of 5 Sep 2021 candle: 232.64
Low of 5 Sep 2021 candle: 210.57
Open of 5 Sep 2021 candle: 212.17
Close of 5 Sep 2021 candle: 232.30
Arithmetic mean of high, low, close, open: (232.64+210.57+212.17+232.30)/4
Heiken-Ashi closing price: 887.68/4 = 221.92
(C) Heiken-Ashi High: High price is the price at which the transaction with the highest price took place. In the Heiken-Ashi technique or indicator, the Heiken-Ashi High price depends upon the high, opening price and closing price of the current candle.
Simply put, out of the opening price, closing price and high of the current candle whichever value or price is the highest is said to be the Heiken-Ashi high.
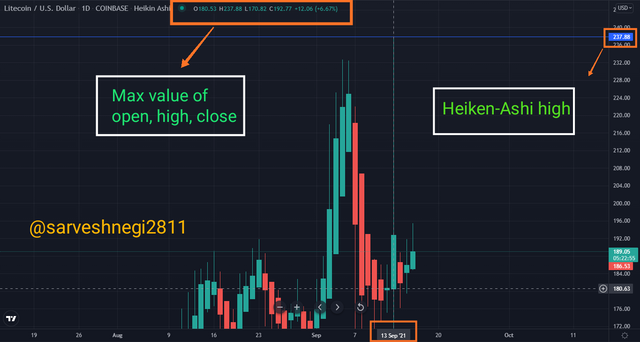
High: 237.88
Open: 180.53
Close: 192.77
Heiken-Ashi high: Max[237.88, 180.53, 192.77]
Heiken-Ashi high: 237.88
(D) Heiken-Ashi Low: low price is the price at which the transaction with the lowest price took place. In the Heiken-Ashi technique or indicator, the Heiken-Ashi low price depends upon the low, opening price and closing price of the current candle.
Simply put, out of the opening price, closing price and low of the current candle whichever value or price is the lowest is said to be the Heiken-Ashi low.
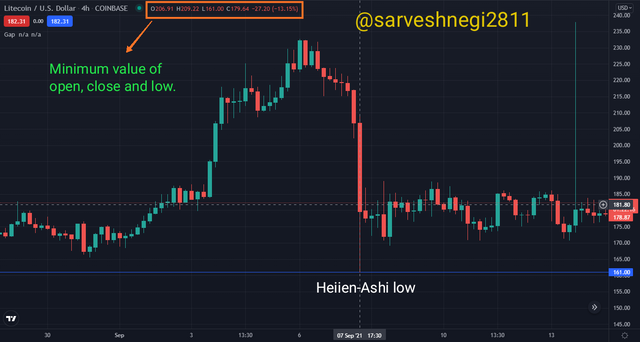
Low: 161
Open: 206.91
Close: 179.64
Heiken-Ashi low: Min[161, 206.91, 179.64]
Heiken-Ashi low: 161
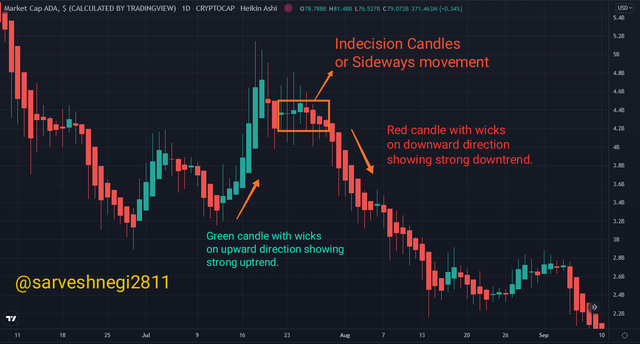
4- Graphically explain trends and buying opportunities through Heikin-Ashi Candles. (Screenshots required)
By using the Heiken-Ashi technique or chart we can easily determine the reversal of the trend and buying and selling opportunity.
Heiken-Ashi candle has Main body and wicks and wicks are very important to determine the trend and its strength.
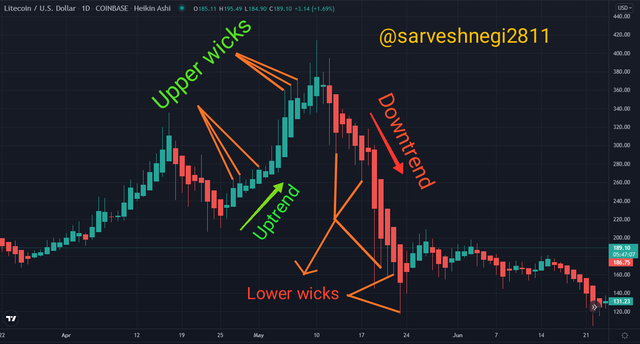
(A) Strong uptrend: In a strong uptrend, the green candle will appear and if the wicks of the green candles are in the upward direction then we can say that the trend is an uptrend or a strong uptrend.
(B) Strong downtrend: In a strong downtrend, the red candle will appear and if the wicks of the red candles are in the downward direction then we can say that the trend is a downtrend or a strong downtrend.
In the example below, it can be seen clearly that wicks on green candles are pointing upwards leading to an uptrend and wicks on red candles are pointing downwards leading to a downtrend.
It is very important to know about the reversal in a trend when you are trading so that you can enter and exit at the right places.
So it is easy to get an idea of reversal but it is not 100% efficient as it doesn't guarantee that a reversal will happen so you should either wait for the confirmation or use another indicator with it.
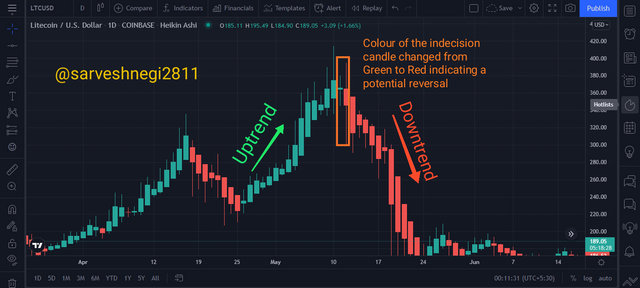
So in the Heiken-Ashi chart or technique, when a trend comes to an end, its indecision candle must appear(red indecision candle at end of a bearish trend or vice versa) then another indecision candle must appear of different colour that indicates a potential reversal.
We can get an idea of reversal by the example below, in the example, you can see a bullish trend and an indecision green candle appeared, following that green indecision candle a red indecision candle appear that indicates a reversal and a reversal can be seen.
Buying signals are very important to enter the market and buying signals can be spotted easily using the Heiken-Ashi chart or technique.
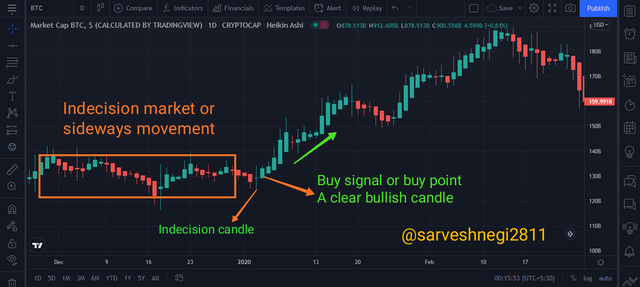
So if a market is moving sideways and consists of indecision candles that don't get the idea of a trend and then a clear bullish candle with its wick in the upward direction can be said to be a buy signal.
In the example below, you can see an indecision market that is followed by an indecision candle and then a clear bullish candle with its wick in the upward direction appears and that candle serves as a buy signal, we can enter at that point and can ride the trend and gain profit.
As i have already mentioned the trend reversal in the above section, we can use it as a buying opportunity.
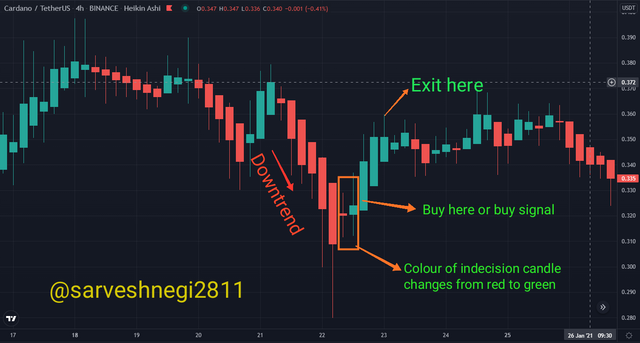
We must wait for a downtrend to end and then the appearance of an indecision red candle following that indecision red candle an indecision green candle must appear and after that a clear bullish candle must appear to confirm the reversal, that clear bullish candle is our buy signal and buy point.
In the example below, you can see that a downtrend had ended and was followed by an indecision red candle and then a green indecision red candle that appeared telling, after that, a clear bullish candle appeared indicating a potential reversal and serving as a buying opportunity or point.
So So I have shown you how to identify a trend and a trend reversal along with the buying opportunity in an uptrend.
5- Is it possible to transact only with signals received using the Heikin-Ashi Technique? Explain the reasons for your answer.
In my opinion, it is not possible or very risky to trade or transact using signals received via the Heiken-Ashi technique. Despite giving a smooth appearance of the candles and the trend I would not use the Heiken-Ashi technique alone.
Traders always prefer to trade only when the trend or signals received are confirmed via more than 1 indicator so it is recommended that one should always use another indicator in conjunction with the Heiken-Ashi technique.
Indicators like ADX(Average directional index), RSI(Relative strength index) and MACD(Moving average convergence divergence) can be used in conjunction with the Heiken-Ashi technique to trade as the abovementioned indicators also tell us about the strength of the trend as well as momentum, so it will be easier to trade using Heiken-Ashi technique and one of the above-mentioned indicators to reduce the risk of Loss and filter false signals in the market. We can also use Moving averages in conjunction with the Heiken-Ashi technique as they act as dynamic support and resistance for the price.
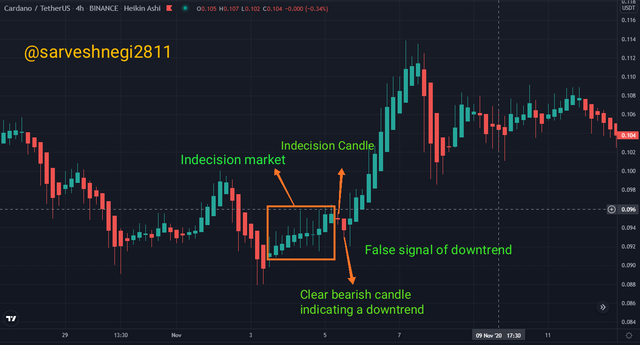
False signals appear sometimes in the market and traders get trapped in those signals without confirming those signals like you can see in the example below.
After an indecision market an indecision red candle appeared and following that red indecision Candle a clear bearish candle appear with its wick down indicating a downtrend, some traders will sell their asset here thinking of it as a selling opportunity, but as we can see that was a false signal, instead of a downtrend another uptrend started. So it is recommended to use any other indicators in conjunction while using Heiken-Ashi technique.
So, owing to the incessant volatility in the cryptocurrency markets we can't rely on only one technique or indicator whether it is Heiken-Ashi technique or RSI.
6- By using a Demo account, perform both Buy and Sell orders using Heikin-Ashi+ 55 EMA+21 EMA.
EMA stands for the exponential moving average and it is also a technical indicator used by the traders as they act as the dynamic support and resistance and keeps track of the price.
Using EMA in conjunction with the Heiken-Ashi technique reduces the risk involved in trading.
We are using two EMA's, one of length 21 and the other one of length 55, length represents the candle and it can vary with the period. As I have mentioned earlier The more the period the more the lag and vice versa. So it is obvious that EMA55 has a larger period and will lag behind EMA21 which has a smaller period.
Now I will be telling about the steps involved while buying and selling assets via a demo trade using the Heiken-Ashi technique and EMA55 and EMA21.
Steps for buying an asset are as follows:
(a) EMA21 and EMA55 must be below the price.
(b) Wait for the price to bounce back from the EMAs that are acting as support and in my case, it happened. There was an indecision market and then a clear bullish candle appeared after a green indecision candle which gives a buy signal.
(c) Wait for the confirmation of the buy signal from the EMAs by confirming bouncing back of price from the EMAs acting as support.
(d) If the price bounces back then buy at that green bullish candle.
Note: Stop loss level must be below both the EMAs.
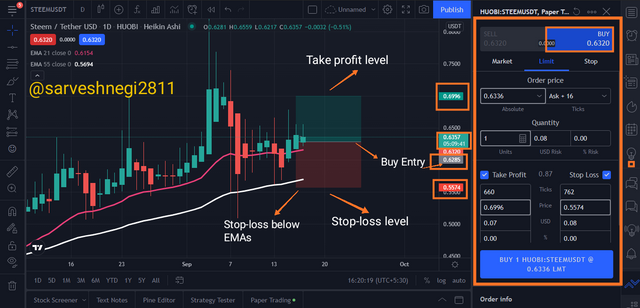
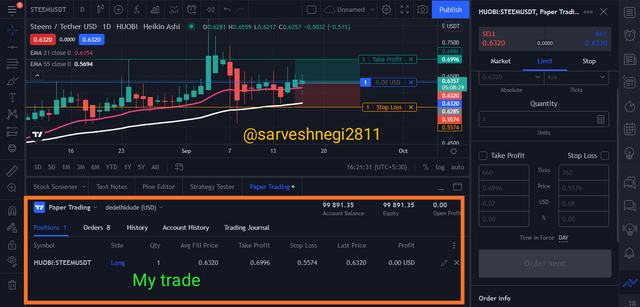
Buy trade entry: $0.6285(grey in chart)
Take profit level: $0.6996(green in chart)
Stop loss level: $0.5574(red in chart)
I have set my reward risk ratio to 1:1, as you can see in the chart above.
0.6996-0.6285 = 0.0711
0.6285-0.5574 = 0.0711
You can see the ratio is approximatley set to 1:1.
Steps for selling an asset are as follows:
(a) EMA21 and EMA55 must be above the price.
(b) Wait for the price to bounce back from the EMAs that are acting as resistance and in my case, it happened. There was an indecision market and then a clear bearish candle appeared after a red indecision candle which gives a sell signal.
(c) Wait for the confirmation of the buy signal from the EMAs by confirming bouncing back of price from the EMAs acting as resistance.
(d) If the price bounces back then enter the sell trade at that clear red bearish candle.
Note: Stop loss level must be above both the EMAs.
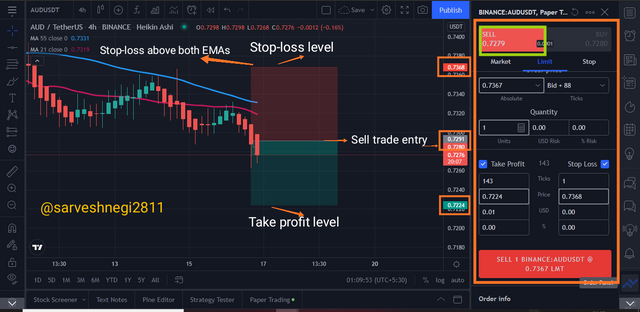
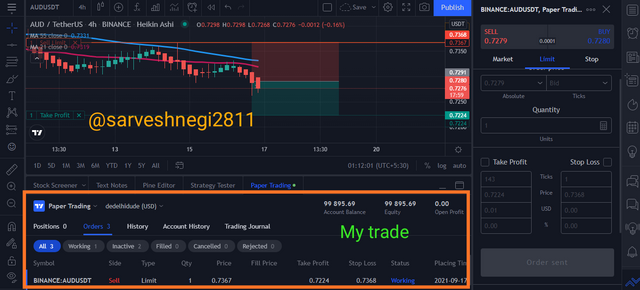
Sell trade entry: $0.7291(grey in chart)
Take profit level: $0.7224(green in chart)
Stop loss level: $0.7368(red in chart)
I have set my reward risk ratio to 1:1, as you can see in the chart above.
0.7368-0.7291 = 0.0077
0.7291-0.7224 = 0.0077
You can see the ratio is approximatley set to 1:1.
Heiken-Ashi technique is a very good technique for someone who knows how to take advantage of this technique. This technique is very helpful in determining or indicating a trend and gives a smooth appearance of trends.
Candles in the Heiken-Ashi chart are formed based on a calculation that includes data of the current candle and some time previous candle. When comparing to the candlestick chart, the Heiken-Ashi chart is much better, clearer and reliable than the candlestick chart.
We can identify the reversal and continuation of the trends with the help of the indecision candles, wicks and certain patterns. If one knows how to enter the trade using the Heiken-Ashi technique, one can easily make a profit.
Nothing is perfect in this world and so is the Heiken-Ashi technique and that is why it is recommended to use the Heiken-Ashi technique in combination with other indicators like RSI, MACD, ADX and EMA.
Using EMA with the Heiken-Ashi technique can help reducing risk in trading as they serve as the dynamic support and resistance.
Note: i have used Heiken-Ashi instead of Heikin-Ashi as they both are right, so sorry for the inconvenience caused by it.
Thank you
That was all from my side
For the attention of professor @reddileep.
Excelente trabajo, felicitaciones
Thank you!!!