RE: Steemit Crypto Academy Season 5, Week 5|Advanced Course|Homework Post for @sapwood, Onchain Metrics (Part 3)
Thank you for attending the lecture in Steemit-Crypto-Academy Season 5 & doing the homework Task-5
The size of the cluster is determined by the total volume of that price range.
The size of a cluster is determined by volume and addresses both.
On checking On-Chain data, on 31st may, 2021
At that Time the price was = $0.370343
ITM = 2.92 million Addresses (79.25%)
OTM = 503.51k Addresses(13.64%)
ATM = 262.65K Addresses(7.12%)
Then after it starts dropping drastically from 31st may to 1st November 2021.
On 1st November 2021 we were having
Price = $0.267000
ITM =2.85 million Addresses ( 67.96%)
OTM = 967.96 K Addresses (23.06%)
ATM = 376.92K Addresses (8.98%)
When you compare the 31st of may to the 1st of November, you'll notice that Doge is steadily decreasing. It indicates a downward trend.
That is not the correct way to ascertain momentum. To ascertain the momentum(upside/downside/neutral), you need to check that for the same price range over a specified period what is the change in ITM and OTM. If for the same price range over a specified period, the ITM is going up, then it is developing bullish momentum. Simillarly, if the OTM is going up, then it's developing bearish momentum.
For a given period, the price has to be the same or very close. Data as extracted by you, on 31st May it was 0.37 whereas on 1st Nov it was 0.267. It should be around 0.37 if you want to compare it with the price recorded on 31st May.
Then compare the difference between ITM and OTM and accordingly ascertain the momentum. If there is a larger deviation between the two prices chosen over the specified period, it will produce distorted results.
Observation/Suggestion/Feedback:-
- The user has analyzed DOGE using GIOM and Adjusted Large Transaction volume indicator.
- You need to do a bit more research to properly understand how to ascertain bullish or bearish momentum using GIOM data.
- One round of proof-reading is still required.
- Proper formatting is needed to make your presentation more appealing.
- Pay attention to the corrections as indicated.
- Always maintain the proper order (text/screenshot); when you say as shown in the image below, the screenshot should immediately follow it, so that it becomes relatable and easy for the readers to decipher.
- Add more white space between two paragraphs.
Thank you.
Homework Task -5 successfully accomplished
[5]
| Criteria | Calculation |
|---|---|
| Presentation | 0.5/1.5 |
| Consistency, Compliance with Topic | 1/2 |
| Quality of Analysis | 0.5/2 |
| Clarity of Structure & comprehensive understanding | 0.5/1.5 |
| Originality | 1.5/2 |
| #club5050 | 1/1 |
| Total | 5/10 |
Club5050 status at the time of curating/reviewing the Task
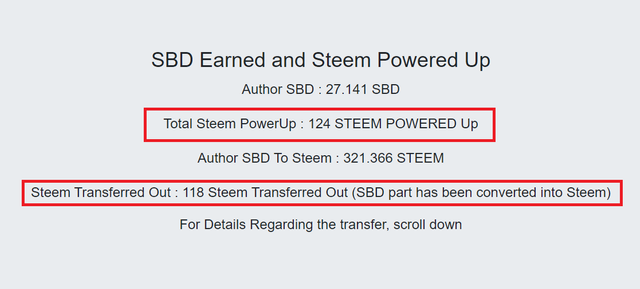
Additional Remarks- The user has powered up an additional 27 STEEM to reach min 150 STEEM Power up. Hence now qualified for Club5050
Thank you @sapwood , I just noticed the observation. I still qualify as of yesterday. Kindly review your comment on my post, I have powered up 27STEEM to meet up.
Cc @sapwood
Alright, Thank you.