Traders. Attention here please! Breakout-Pullback setup on EURCAD
Forex Analysis #5
Beautiful upcoming setup on EURCAD
Hey there, TraderSaan is here.
Today I am going to share one of my upcoming trading setup in EURCAD in next few days. The strategy I am going to use is called BREAKOUT PULLBACK strategy. If you don't know about this strategy, please pay a visit to the link below.
The Breakout Pullback Strategy For Trading
I am actually a swing trader, meaning I hold my position for 2-3 days or more. So I usually trade at the timframe of 4 hour (H4), 1 hour(H1), or occasionally at 30 miniutes (M30). And one more thing is that I analyze the chart in tradingview and take trade in MT4 (for FOREX) and Binance ( for CRYPTO).
Firstly I will cover the fundamental parts and then will give an insight in technical charts of EURCAD. So follow closely.
Fundamental Outlook : Bearish
Actually I am fundamentally bearish on EUR and bullish on CAD, so that implies I am bearish on the pair EURCAD. So here are some reasons :
EUR :
• The EURO is depretiating after the Russian invasion in Ukraine, as Russia was a major exporter of energy and commodities to the Euro zone. And we have seen the insane rise of OIL price since 23 February this year, i.e., when the war was started.
• The EUR is a risk on currency which means when any geopolitical or pandemic issues arise, this currency depretiates particularly. That is a reason EUR is devalueing against other major currencies as the COVID variants has appeared one by one.
• The inflation is very high in the EUR zone curently which has been a big issue to set their monetary policy. The ECB president uttered about rate hike in the last press conference, but it seems they are hesitating in some extent.
CAD :
• On the other side CAD is aggressively appreciating as the OIL price is skyrocket after banning the Russia from business deal by Joe Biden first sanction. Canada is one of the major country of OIL supplier, so this country is taking advantage of the energy crisis environment.
• Canada is coming forward to make a rate hike which is attracting many traders and investors to its currency - CAD.
Technical Chart Analysis :
All the charts shown below is in 4 hour time frame( H4)
• EURCAD is in a defined downtrend. Price is consistantly making lower lows, lower lows, breaking support etc. 50 MA & 200 MA are beautifully aligned downwardly which indicates that sellers are in control in this market.
EURCAD,H4, 50&200MA are aligned downwardly
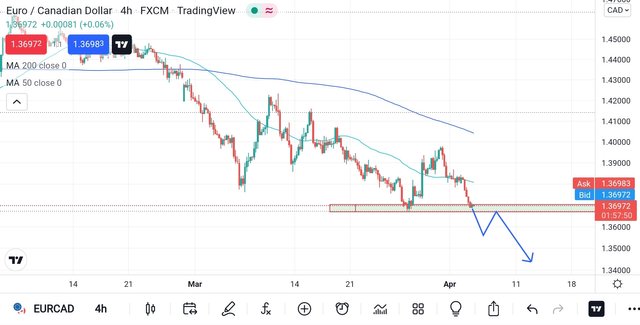
Image source: tradingview, prepared by me
• Look at the chart below, price is resisting by a nice downtrend line or zone. Price has touched this trendline several times and got rejected and supply pressure has come. So this is another confirmation of my selling bias.
EURCAD, H4, price is resisting by a downtrendline
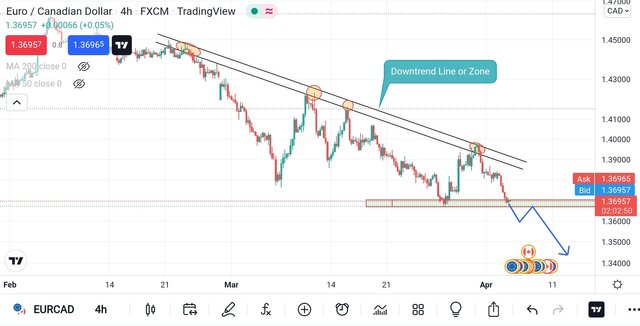
Image source: tradingview, prepared by me
• Look at the chart below, a heavy sell off has been occured when the price has touched the downtrend line last time. So this makes me more confident to be the short biased.
Now that I have enough confluences, both fundamental and technical, I will look for next possible short entry on the technical chart.
So price is currently at a minor support zone and I cannot short in this place. Therefore, I am going to wait until price breaks the support zone. And once the pullback/retracements/take profit move is happened after the breakout, I will just jump into the market for SELL. And I expect the market to move down in the shown direction in the chart below.
Note: The aggressive traders can short the market in the breakout. But I will wait for the proper pullback according to my BREAKOUT-PULLBACK STRATEGY. And I am completely satisfied with this conservative approach.
EURCAD, H4, waiting for the breakout-pullback setup
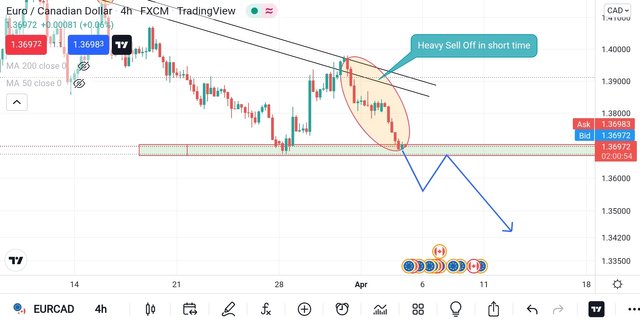
Image source: tradingview, prepared by me
Well, this is my setup in this pair for next few days. I will update you guys if further analysis or discussion is needed. Hope it helps.
I always take a trade when my fundamental and technical analysis say the same thing. As follows:
Case I
Fundamental = buy, Tchnical = sell, that implies Not To Trade
Case II
Fundamental =sell, Technical = buy, that implies Not To Trade
Case III
Fundamental = buy, Technical = buy, that implies Jump In For Buying
Case IV
Fundamental = sell, Technical = sell, that implies Jump In For Selling
Disclaimer: This is not any financial advise or trading mantra. My purpose is to help traders to learn. This post is made for completely educational purpose. Hope it helps.
Thank you very much if you make it to the end. Happy trade.