The Art & Science Of Support & Resistance. Support Or Demand Of Price Action Concept. Part 1
Trading Education #2
Support or Demand Zone
Hey there, TraderSaan is here.
Today I am going to share one of my favourite Price Action(PA) concept of Support or Demand which is very effective concept for PA Traders. Well, I will go through step by step process of this strategy or concept.
I am actually a swing trader, meaning I hold my position for 2-3 days or more. So I usually trade at the timframe of 4 hour (H4), 1 hour(H1), or occasionally at 30 miniutes (M30). And one more thing is that I analyze the chart in tradingview and take trade in MT4.
The Science Behind The Support Zone:
• Support zone is an area from where price usually goes up when it touces this zone once, and also the support zone is called the demand zone which means, in this zone or area, demand pressure comes to the market and price likely goes up. And basically, support or demand is not a line or exact level in the chart, it's a zone or area.
• There are two types of Support or Demand zone - 1. Horizontal 2. Trend.
1. Horizontal Support :
Horizontal support zone is a zone horizontally in the chart. When price comes to this area, it goes up. So now question is - when we know that it is a defined support zone, usually after two touces or tests, a zone become support area. This means, in a certain area, market gets demand from traders and investors and price goes up. More the price touces support area and bounces back, more the zone become important support area.
The support zone, price touces the zone, goes up
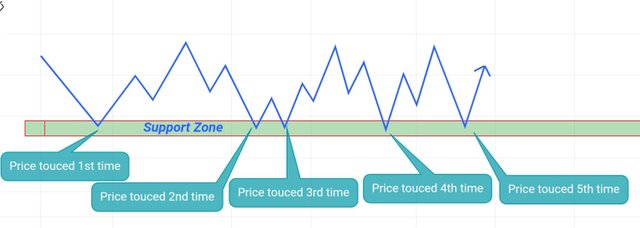
Image source: tradingview, prepared by me
GBPUSD, this is how a horizontal support zone looks like in the technical chart
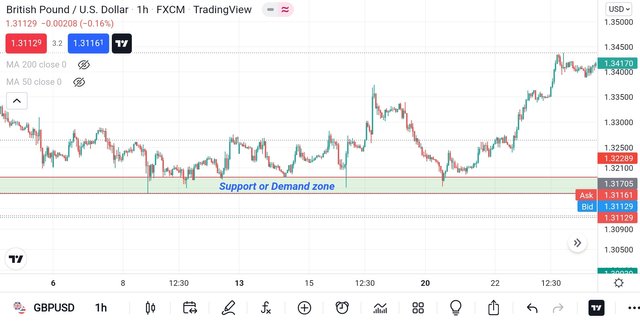
Image source: tradingview, prepared by me
2. Trend Support :
Well, I assume you know what uptrend is - price makes higher highs, higher lows, breaks resistance again and again etc. Anyway, price sometimes goes up or bounces up by a supporting line or an up- slanting area. That line is sometimes called uptrend line. Well, this is what I call Trend Support or Demand zone. Look at the diagram below, how price touces that zone and bounces up. More the price touces this zone and bounces up, more the area becomes significant.
Uptrend support
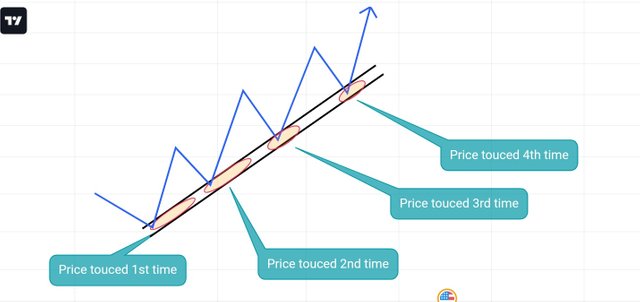
Image source: tradingview, prepared by me
ETHUSD, H1, this is how a uptrend support or demand zone looks like in the real chart
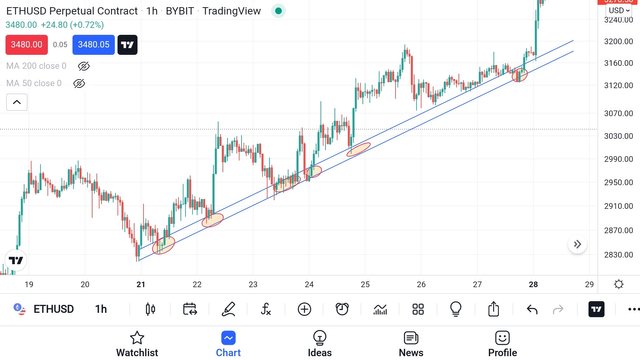
Image source: tradingview, prepared by me
Now I will talk about Major and Minor support or demand zone
Well, not all supports are equally significant. Usually, the support zone in the bigger timeframes is more important than lower timeframe's support zone. When price touces and bounces up in an area more than two or three times, that area is usually called major support zone. And when price touches and bounces up in an area not more than two or three times, that area is called minor support zone. The demonstrations below will make it clear.
Price is supporting by a minor support zone as well as a major support zone
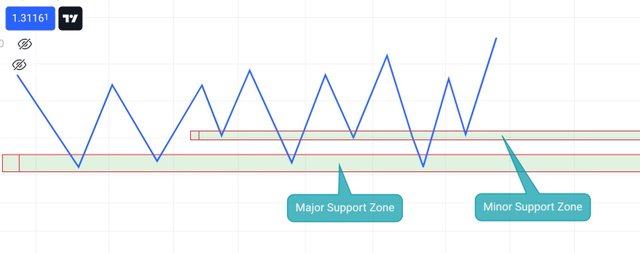
Image source: tradingview, prepared by me
USDJPY, H4, this is how a major and minor support zone looks like in the real chart
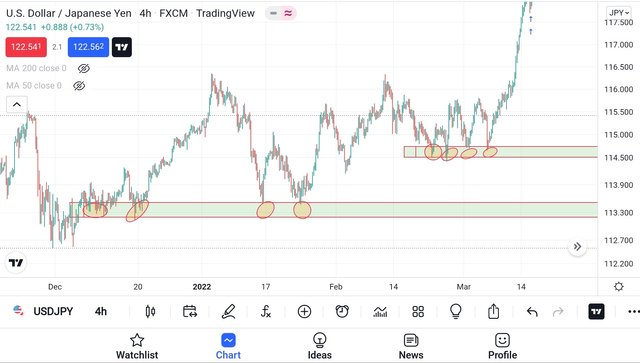
Image source: tradingview, prepared by me
Well, this is a textbook description of support or demand zone and market does not always care what textbook says. So One needs to understand the concept behind this Supply or Demand. And in more advance way to take trade with this concept is to add some fundamental confluences which I will be talking in my upcoming post, so stay tuned.
I always take a trade when my fundamental and technical analysis say the same thing. As follows:
Case I
Fundamental = buy, Tchnical = sell, that implies Not To Trade
Case II
Fundamental =sell, Technical = buy, that implies Not To Trade
Case III
Fundamental = buy, Technical = buy, that implies Jump In For Buying
Case IV
Fundamental = sell, Technical = sell, that implies Jump In For Selling
Disclaimer: This is not any financial advise or trading mantra. My purpose is to help traders to learn. This post is made for completely educational purpose. Hope it helps.
Thank you very much if you make it to the end. Happy trade.