Steemit Crypto Academy Season 4 Beginner's Course - Homework Post For Task 10: Candlestick Patterns.
![Screenshot_20210906-235332[1].png](https://steemitimages.com/640x0/https://cdn.steemitimages.com/DQmUsuTYEjHvFt1dqJqsizKMybn9D5MFD7sHV3UaUB2aY5e/Screenshot_20210906-235332[1].png)
Hello Everyone, I will be attempting The 1oth Task on the beginner's fixed course lectured by Prof @reminiscence01.
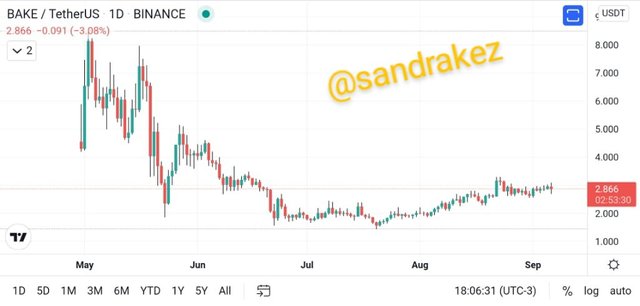
Explain the Japanese candlestick chart? (Original screenshot required).
In your own words, explain why the Japanese Candlestick chart is the most used in the financial market.
Describe a bullish and a bearish candle. Also, explain its anatomy. (Original screenshot required)

The Japanese Candlestick Chart
The Japanese candlestick chart is an ancient style developed in the 1700s by Munehisa Homma, a Japanese rice trader. Which he discovered was influenced by the emotions of rice traders. Currently used today in stock analysis, to determine price change and how the market reacts to this.
The Candlestick is formed from the exchange between buyers and sellers on a particular asset. It is a style of chart used as a graphical representation of price movement in the financial market.
The candlestick chart is a very useful indicator in cryptocurrency trading, as it shows significant price changes at each point and future analysis of price change.
Why Japanese Candlestick Is The Most Used In The Financial Market
The Japanese candlestick chart is the most used because it provides an accurate and detailed graphical representation of the price change at every point of time. It shows various price points during the interaction between buyers and sellers.
They display graphically, the supply and demand that is a determinant in each time price movement.
Bullish Candle
Bullish candle is an engulfing candlestick pattern that forms in a downtrend signaling a reversal of price movement. This usually shows that the buyers have taken control.
Anatomy
A typical candlestick consist of four parts: Open, Close, High, Low each representing specific point in price movement.
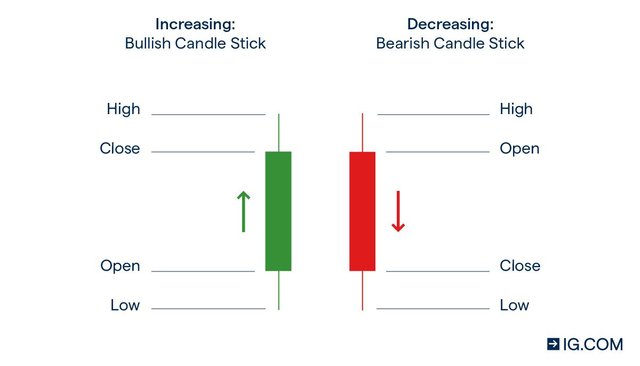
Open(opening price)-This is a part that simply indicates the beginning of price movement. This point is marked and recorded.
Close(closing price)- A part that marks the end of the candle within a specified time which indicates the last price recorded.
High(Highest price)- This is a part of the candlestick that indicates the highest price recorded per a specific time.
Low(Lowest price)- This shows the lowest price recorded per a specific time.
The bullish candle typically, closes(closing price) above previous candles open(opening price). The length of the bullish candle engulfs the previous red candle.
What it looks like;
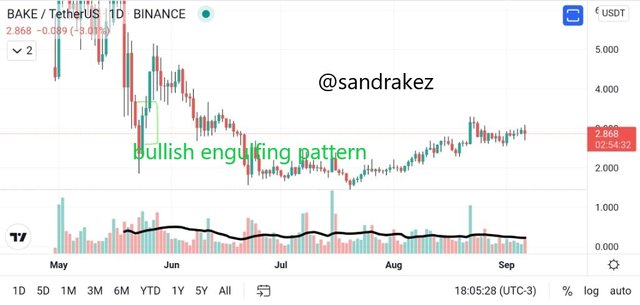
From the chart above, we can see how the price reversed, this shows the buyers have gained control of the price.
Bearish candle
Bearish candle is an engulfing candlestick pattern that forms in an uptrend signaling a reversal in the opposite direction. This shows the sellers have taken control of the price and the buyers has lost it.
Anatomy
Following the previous general anatomy of candlestick:
Bearish candle opens at or above the previous candle's close.The length of the bearish engulfing the previous green candle. Bearish candle closes below the previous candles opening.
What it looks like;
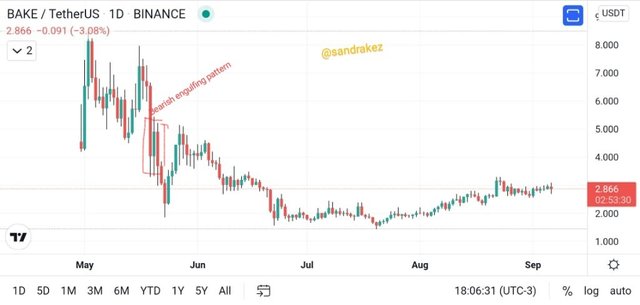
From the chart, we can see that the price reversed in opposite direction.This entails that the sellers have control of the price and the buyers have lost control.
Conclusion
I have learnt that the Japanese candlestick chart shows the sentiment between buyers and sellers. Also, it is a vastly used chart in the financial market. Both the Bullish and Bearish engulfing pattern show specific points in time of prices.
I would like to thank prof @reminiscence01 for his clarity on this lecture.