The Crypto Academy Season 2 - Week 14- For @kouba01
What is the MACD indicator simply?
MACD indicator initials for Moving Average Convergence is an indicator that is used to observe and determine the market trend between two moving averages, it is designed based on the divergence (measuring the trend of strength and direction, and Convergence ( measuring phase of reversal and potential at the point of entry and exit).
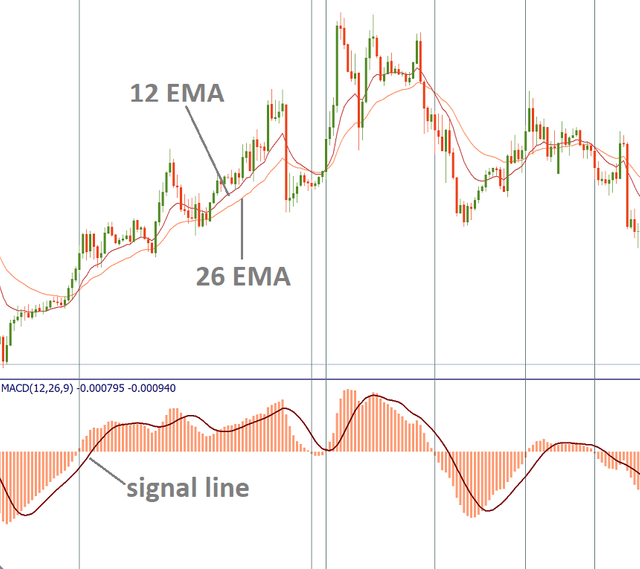
The MACD indicator's convergence and divergence concept makes it a close to best indicator where is oscillator allows the following of trends and identification of reversal in prices. Exponential moving average is the factor that is used to calculate the MACD indicator where the higher EMA of 26 period is subtracted from the lower EMA of 12 period which gives a result known as MACD line.
The MACD line is that tool that is used to calculate the signal line which is a nine day EMA of the MACD. The signal line is then what is used to be trigger as to determine when to buy and sell. The common ways to interpret MACD indicator are crossovers, divergence and rapid rise and fall.
Is the MACD Indicator Good for Trading Cryptocurrencies?
MACD is a very good indicator of cryptocurrency trading because it has has a technique that indicates when to buy or sell a crypto or to determine if the market is overbought or oversold
these became very helpful to crypto investors to understand if the trend in the bullish or bearish direction is strengthening or weakening. MACD is a fair indicator because of its two ways functionality but for better efficient results, MACD need another tool to give result.
Which is better, MACD or RSI?
MACD and RSI are both indicators cryptocurrency trading but with different functionality MACD indicator determine the market trend between higher EMA and lower EMA whereas RSI categorically observe the price fluctuations and inflation.
Hence merging and using the two will give a better picture of the crypto market.
How to add the MACD indicator to the chart, what are its settings, and ways to benefit from them? (Screenshot required)
An instance of adding MACD indicator will be done using tradingview exchange platform App.
To add MACD indicator on a chart:
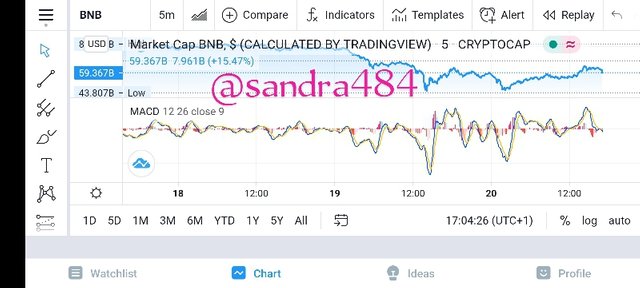
Open the tradingview app and select the coin to view, we will be viewing the binance BNB coin for this example.

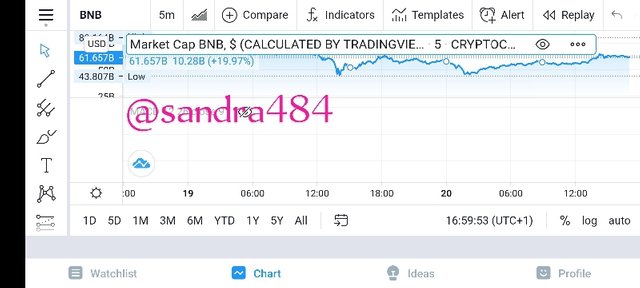
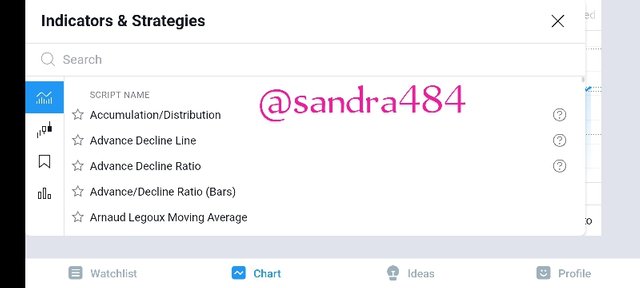
The next thing to do is to tap on the indicator button and it'll lead to page as the first pic below, then type the MACD and tap the popped item.
The good thing about using tradingview to add MACD is that it has a built in indicators.
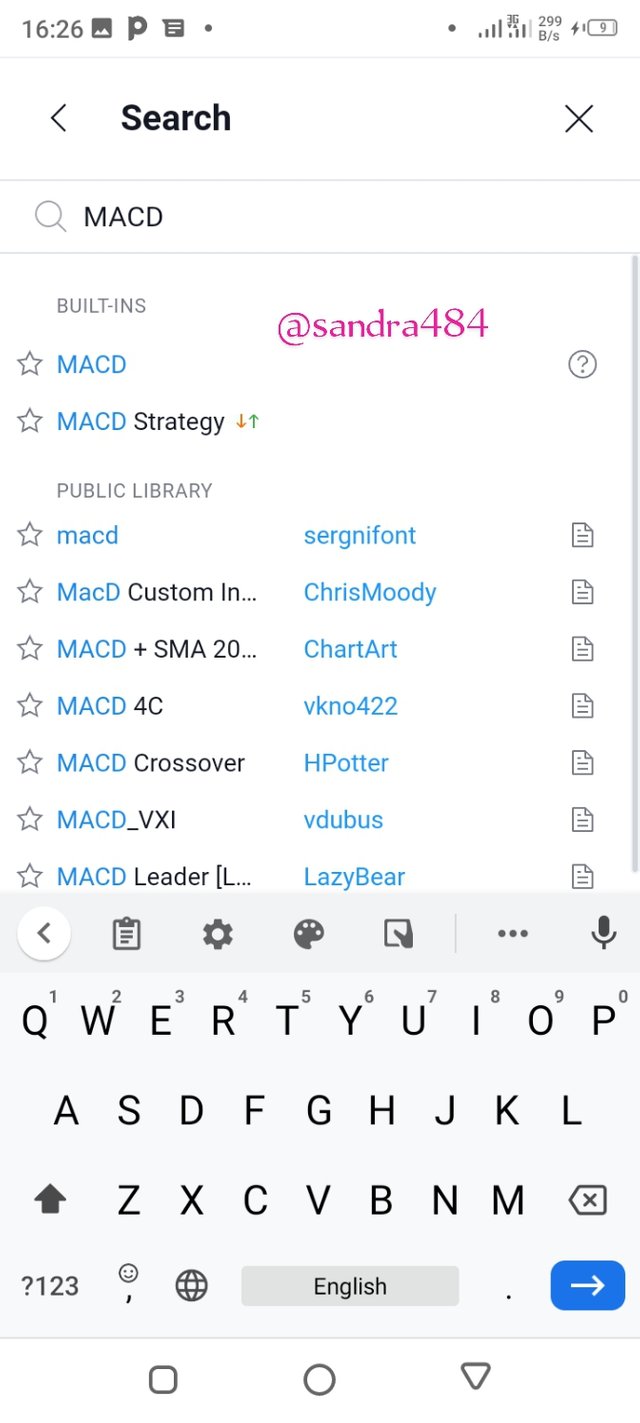
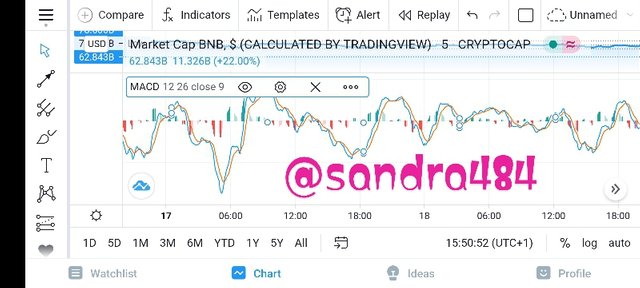
After selecting the MACD tap on the X tab to view the insertion on the chart as below
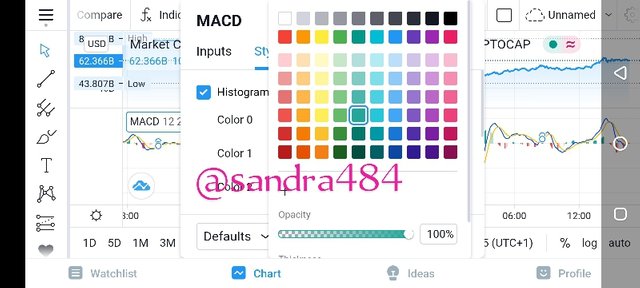
To change the colour of the hologram on the MACD indicator line tap on the MACD indicator on the chart and an icon on the MACD will pop up then click on the settings ⚙️ and adjust the indicator style and input to your choice.
How to use MACD with crossing MACD line and signal line? And How to use the MACD with the crossing of the zero line?
To use the MACD with crossing line, the MACD and signal line you have to understand the features of the MACD indicator, there's are blue and red dotted line that the MACD use as indicator’s line and signal line in red-dotted.
The crossing of either line below or above the signal line indicates change in the market trend direction. And whenever the lines crosses one another it's there to say at zero line.
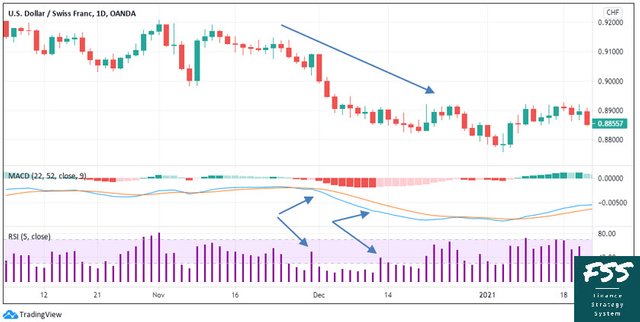
How to detect a trend using the MACD? And how to filter out false signals? (Screenshot required)
An uptrend is detected using the MACD if the blue line crosses over the signal line and a downtrend is also detected whenever the MACD line crossing under the signal line.
As we know MACD usesthe signal line which is the result of the difference of the distance between two exponential moving averages (lower 12 and higher 26 periods), to forecast if the market is currently at an uptrend, a downtrend, or moving sideways.
To filter out false signals use the standard MACD parameters (that is the lower EMA 12, the higher EMA 26, and the signal line at 9 day EMA) with the addition of 50 MA. Then take the buy signal whenever the price go up and the sell signal whenever it moves down. As in the picture below
How can the MACD indicator be used to extract points or support and resistance levels on the chart? Use an example to explain the strategy. (Screenshot required)
MACD indicator can be used to extract points or support and resistance levels in a chart when both lines crossovers one another.
As we all know that MACD is only an indicator that forecast market trend and using it alone to extract points might give false movement, so the need for use of another indicator to work alongside the MACD is very important to get effective result.
##Review the chart of any pair and present the various signals from the MACD. (Screenshot required)
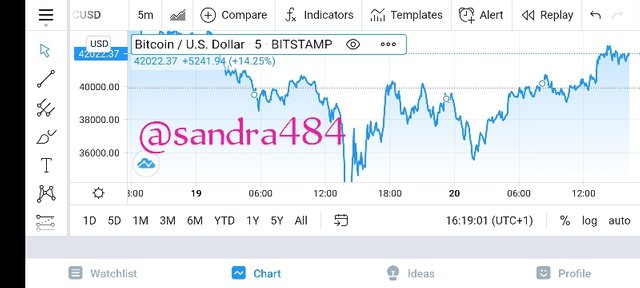
Review the chart of ETH/ USDT
ETH and USDT was reviewed to check out for signal by the MACD indicator, the exchange platform used is tradingview
This is the review of the pair ETHUSDT, to check for possible signals that can be traded with. We will be using the Tradeview chart.
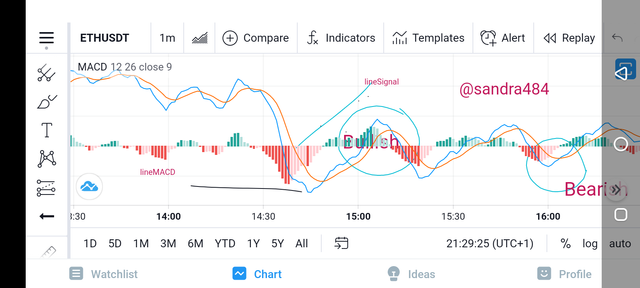
The above photo shows the ETHUSDT moves from lower price to a little bit higher which even shows the a chance to buy and invest in ETH by any interested user.
Hi @sandra484
Thanks for your participation in the Steemit Crypto Academy
Feedback
You just simply tried though not good enough. Kindly invest enough time in both your research and in writing your articles. The information you provided about the MACD trading indicator was just not clear.
Homework task
4