Trading strategy with RSI and ICHIMOKU]- Steemit Crypto Academy- Homework post for Professor @abdu.navi03 by @samizuberi
Hello Everyone!
This is Sami Zuberi , hope you all are well. I am exceptionally hope set aside a few minutes for perusing my post for @abdu.navi03 and valued it. Here i am going to impart my views on "Trading strategy with RSI and ICHIMOKU". So how about we begin

Question 1.
Put your understanding into words about the RSI+ichimoku strategy
The RSI+ichimoku technique combines the Relative Strength Index (RSI) and the chimoku Clouds into a single method. The cryptocurrency market is extremely volatile, with coin prices that fluctuate from time to time. Traders continue to trade, and their buying and selling pressure influences market movement. The RSI is a motion indicator that is widely used and recognized in the crypto sector. This indication is used by traders to identify the target market.
The RSI Indicator is a widely traded indicator. We may use the RSI indicator to determine if the marketplace is overvalued or oversold. The RSI is a highly effective and helpful indicator that is used in the market to determine market circumstances such as whether the market is overvalued, down, or trend reversing, among other things. The RSI, which lies in the range to 10, is one of the most frequent measures to gauge price motion.
Ichimoku cloud is a tool or an indicator for technical analysis. It anticipates future price changes and is mainly based on Chinese candlestick charting. The Ichimoku indicator is a technical measurement tool that is also highly useful. This is a pattern indicator that marketers use to determine the direction of the market. This indicator may also be used by traders to predict future support and resistance levels. The Ichimoku indicator addresses the RSI's flaws, while the RSI provides what the Ichimoku indicator lacks. By glancing at the chart, the Ichimoku indicator displays the current situation of the marketplace.
Question 2.
Explain the flaws of RSI and Ichimoku cloud when worked individually
Flaws of the RSI :
The RSI indicator has a flaw in that it does not operate as there is a trend since it signals at the expense of the trend. It is not possible to determine how much volume is entering the market. The indicator's only flaw is that it can't be used in a ranged market. We could only utilize it in a trending market, but markets are often not rising. The RSI does not tell the trader how strong the trend is, which might encourage the trader to take a position anticipating the trend to reverse, resulting in a large loss.
The second flaw with this indication is that it can't tell us how much liquidity is in the market. Traders cannot use the RSI to determine accurate market volume. The movement of the line can be forecast, but it isn't precise enough to make substantial financial choices. This indicator is ineffective for confirming the completion of trading operations. When used independently, this indicator does not perform well. When market movements are particularly strong, this indicator becomes less effective.
Flaws of the Ichimoku Cloud Indicator :
The Ichimoku indicator's flaw is that it is a trailing indicator, which means that the indications are generated after the market has already changed. One of this indicator's weaknesses is that it lags behind market activity, resulting in late signals. It frequently too late to get the signal from here. We can't take the proper entry at the right spot since we know Ichimoku Cloud lags significantly behind the pricing.
When used singly, that indication doesn't quite perform well. To achieve the best and most accurate findings, we must combine it with another indication. With all of the lines, Ichimoku may make a chart appear cluttered. Ichimoku can also become obsolete over time if the price remains much up or down it. Support and resistance points may not be formed effectively during a strong liquidating infusion in the market, particularly during lateral motion.
Question 3.
Explain trend identification by using this strategy (screenshots are required)
Bullish Trend.
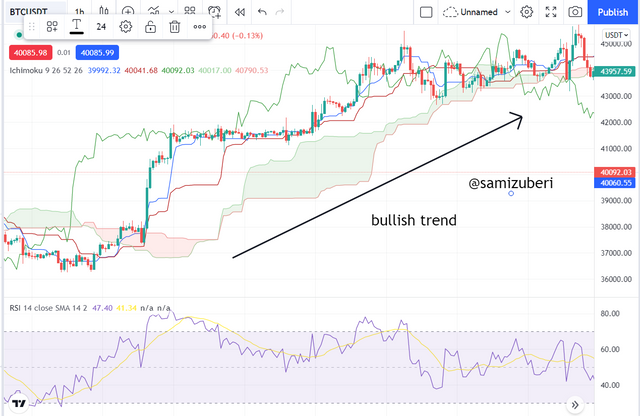
In the event of a bullish trend, the RSI should be over the 50 barrier, and in the event of a very powerful bullish trend, it should be above 70 barriers. The Ichimoku cloud, on the other extreme, is supposed to be visible beneath the price movements. You will be able to determine the intensity of the bullish trend based on the size of the clouds. This indicates that if the cloud generated is large, the trend's momentum is great, however, if the cloud is tiny, the cloud's vigor is low.
Bearish Trend.
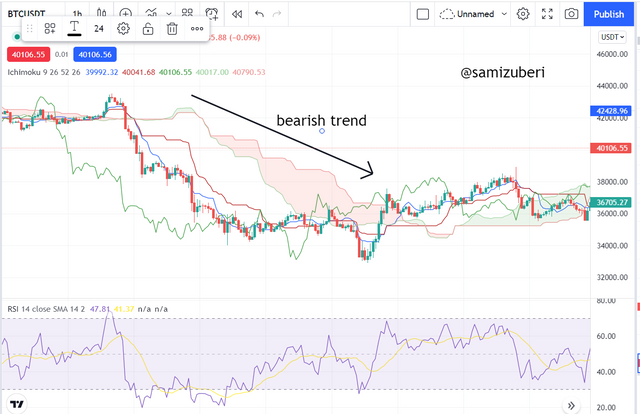
In the event of a negative trend, the RSI should be lower than 50, and in the instance of a very severe bearish trend, it ought to be lower than 30. The Ichimoku cloud, on the other side, is supposed to be visible just above price activity.
Question 4.
Explain the usage of MA with this strategy and what lengths can be good regarding this strategy (screenshots required)
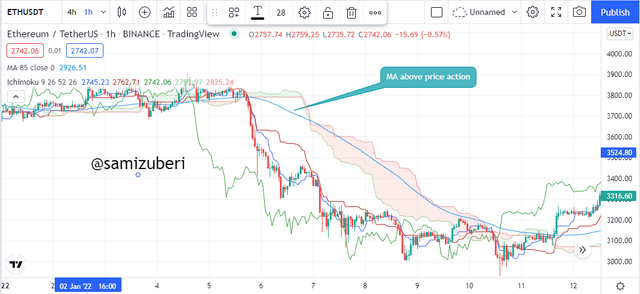
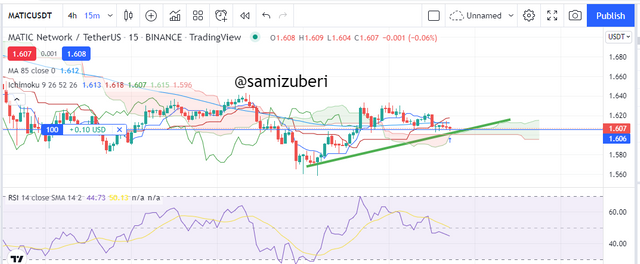
Including MA in this method will significantly increase the accuracy of our predictions. This is because the MA may filter out more false signals and noise when used in conjunction with the approach (RSI+Ichimoku). The MA indicator, as we all know, is a very simple indicator to use. If the indicator is seen above the price action, it indicates a downwards trend, and if it is noticed below the price action, it indicates a bullish trend.
In this session, I will use the 85 period MA in conjunction with the method to get a better outcome. The MA is shown with the strategy (RSI+Ichimoku) in the image below.
Question 5.
Explain support and resistance with this strategy (screenshots required)
These strategies can be used to identify levels of support and opposition. I'll show you how to utilise the Ichimoku cloud to detect support and resistance levels on a trending market, as well as how to use the RSI indicator to identify support and resistance levels when the price is in a range. Let's have a peek at it below.
In a Market That Is Trending
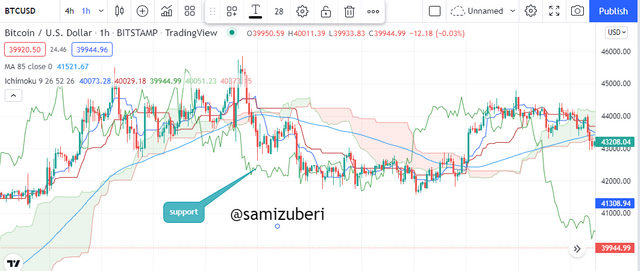
In a trending market, support and resistance may be identified for both bullish and negative trends. If the clouds are green, the ichimoku signal at that time serves as a support to the price, and as the cloud drifts away from the cost, the trend strengthens, while moving closer to the price indicates trend fatigue. Have a look at the picture underneath
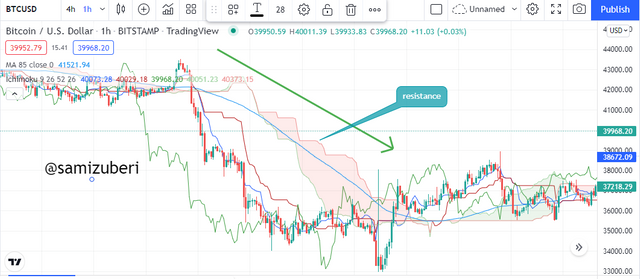
Similarly, if the clouds are red in colour, the ichimoku signal at that time serves as a barrier to the price, and as the cloud moves away from the price, the trend strengthens, while moving closer to the price indicates trend fatigue. Have a look at the picture underneath.
Question 6.
In your opinion, can this strategy be a good strategy for intraday traders?
The intraday traders will benefit greatly from the trading method. Well, the technique has offered information like as trend direction, support, resistance levels, entry/exit points, and so on, which are the fundamentals that every trader requires to carry out his or her trader more efficiently. We can discover support and resistance, as well as our entrances, using this method.
When this method is combined with a moving or rolling average, it becomes more successful and may be used to obtain more authentic and useful results. It will filter out spurious indications, giving traders the best signals possible, allowing them to trade with more profit and less risk. This method is excellent for screening specific defects in both RSI and Ichimoku, as it helps to cover both false signals and boosts the success rate. This method is, in my perspective, quite effective.
Question 7.
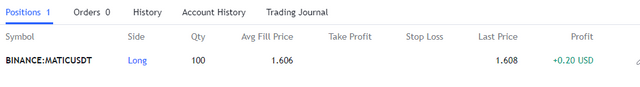
Open two demo trades, one of buying and another one of selling, by using this strategy
In this section, I will conduct a demo trade utilising the approach. The tradingview platform will be used for the research, and the transaction implementation will take place on the tradingview paper trading.
BuyTrade
In the picture above, you can see a green cloud emerging from the Ichimoku cloud indicator, which serves as a support level, and the RSI indicator is also above 40 signalling that the market is in an uptrend. As you can see in the picture, I took my entry position at the formation of the green candle, and a stop loss and take profit were also considered.
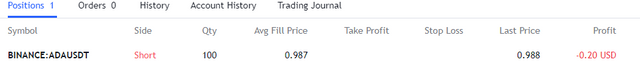
Sell Trade
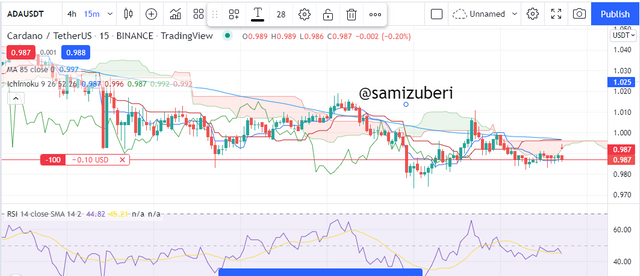
In the picture above, you can see a red cloud emerging from the Ichimoku cloud indicator, which acts as a resistance level, as well as the RSI indicator moving downward, signalling that it will be a downward move. As you can see in the screenshot, I took my entry position at the formation of the red candle, and a stop loss and take profit were also considered.
Conclusion.
The combo of the RSI and the Ichimoku cloud indicator is an excellent approach for filtering out false signals and removing noise from the chart. The addition of the MA indicator is for trend confirmation, which increases the quality of our study. This method works successfully provided the trader adheres to it strictly. When employing the technique, we should strive for effective risk management in order to limit loss and maximize profit.