[Technical Indicators] - Crypto Academy | S4W2- Homework Post for @reminiscence01
Hello Everyone!
This is Sami Zuberi , hope you all are well. I am exceptionally hope set aside a few minutes for perusing my homework post for @reminiscence01 and valued it. Here i am going to impart my views on "Technical Indicators". So how about we begin
Made this poster on canva

Question 1 (a)
In your own words, explain Technical indicators and why it is a good technical analysis tool.
Technical indicators represent chart methodologies that can aid traders in effectively comprehending and reacting to market sentiment. Technical Indicators, as either a technique to technical analysis, assist traders in determining cryptocurrency trades.
They're also good and useful technical analysis tool since they can provide you an opinion on the intensity and direction of an underlying price activity. When combined with certain other technical trading features, the implementation phase are integrated acts as a particularly affects tool that gives details to speculators.
Technical analysis techniques that evaluate patterns, offer price trends, assess volatility, and others are all accessible. Technical indicators are indeed useful in technical analysis since they give hints to investors, allowing them to analyze market patterns and forecast future price trend of such an entity. The mentality of speculators is however reflected by technical indicators, allowing them to better predict future price changes. It not only assists traders in determining price changes, but that also illustrates on even a graph how traders may benefit upon historical market volatility. Technical indicators properly show facts and keep it easy to comprehend.
Question 1 (b)
Are technical indicators good for cryptocurrency analysis? Explain your answer.
Technical indicators are good and beneficial to cryptocurrency analysis since they assist users in identifying whether to enter and leave trades. The support and resistance marks of such a cryptocurrency's price are determined using technical indicators. It also deals with the identification of an upward and backward trends. Both cryptocurrencies market participants should be aware of this. It enhances dealers in their understanding of market opening and closing situations.
Question 1 (c)
Illustrate how to add indicators on the chart and also how to configure them. (Screenshot needed).
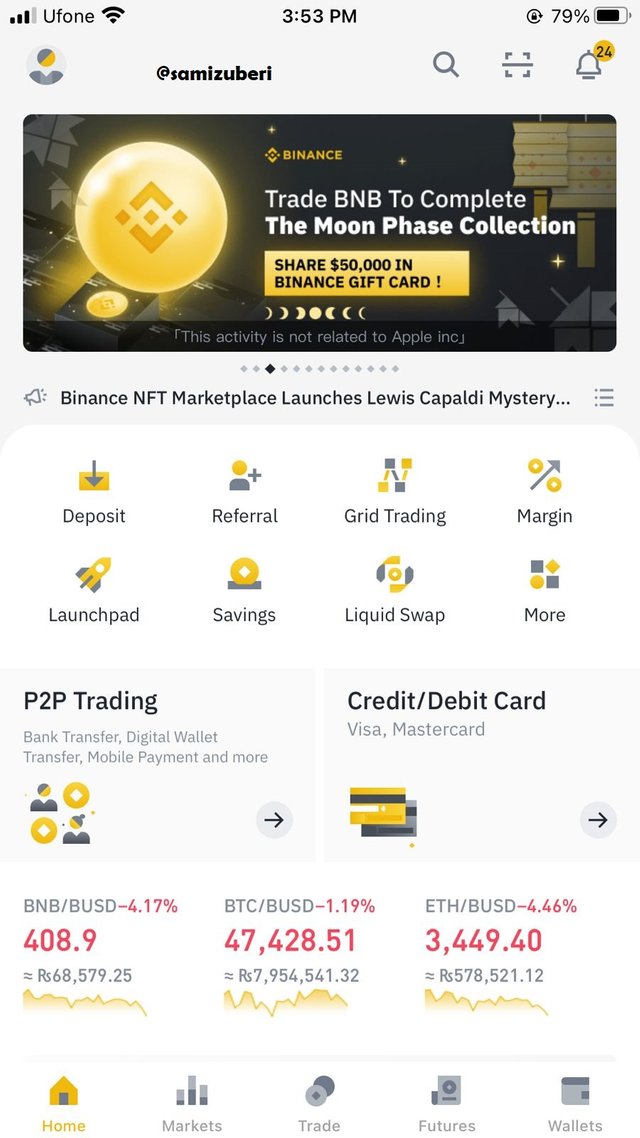
I used the Binance platform to demonstrate how to add indicators to a chart. So I first went to the Binance app and then to the market option at the edge of the screen.
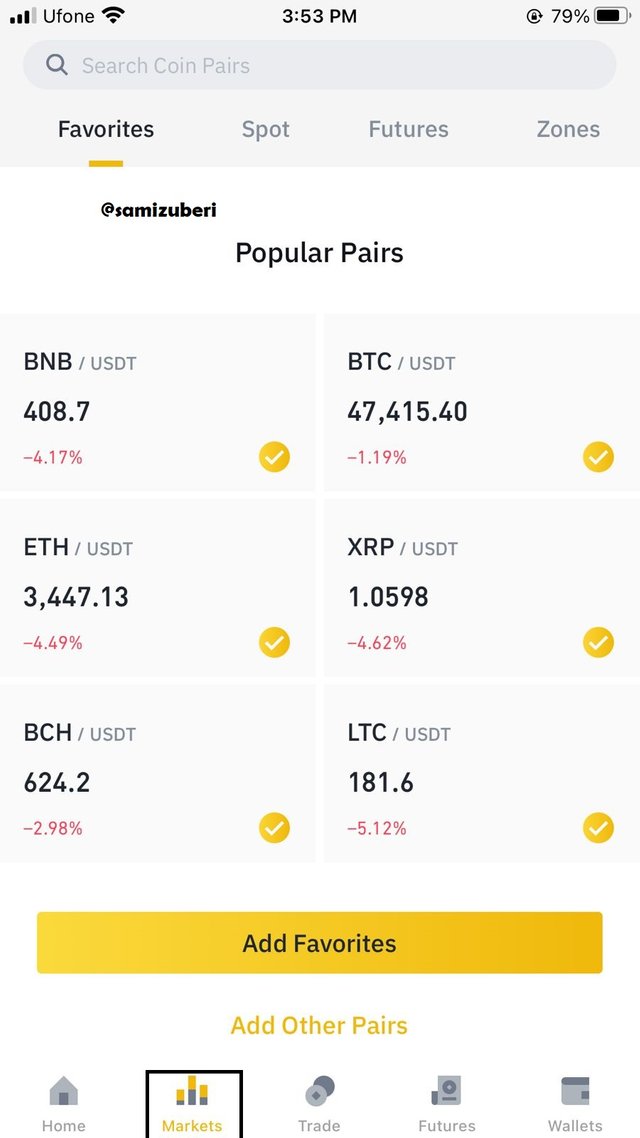
Then, after selecting the market option, you will be presented with a list of coin pairings from which to choose. ADA/BUSD is my choice.
.jpeg)
After you've chosen a coin pair, you'll be let in another interface where you should click on a symbol in the upper right corner. Once you've clicked on that symbol, you'll be presented with a menu of options, one of which will be an indicators option.
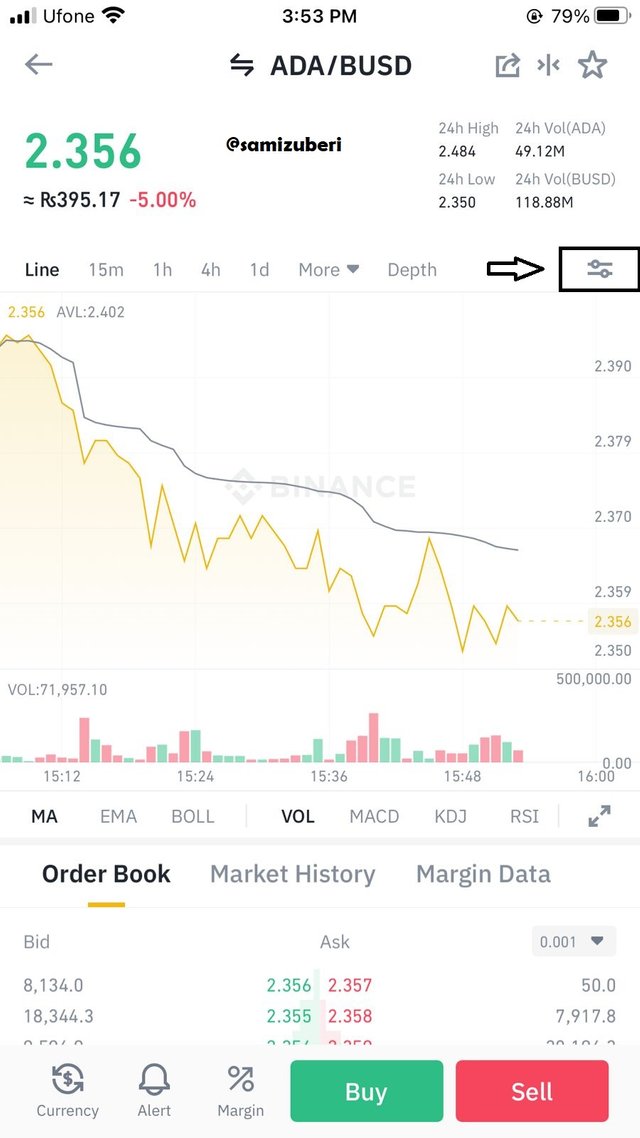
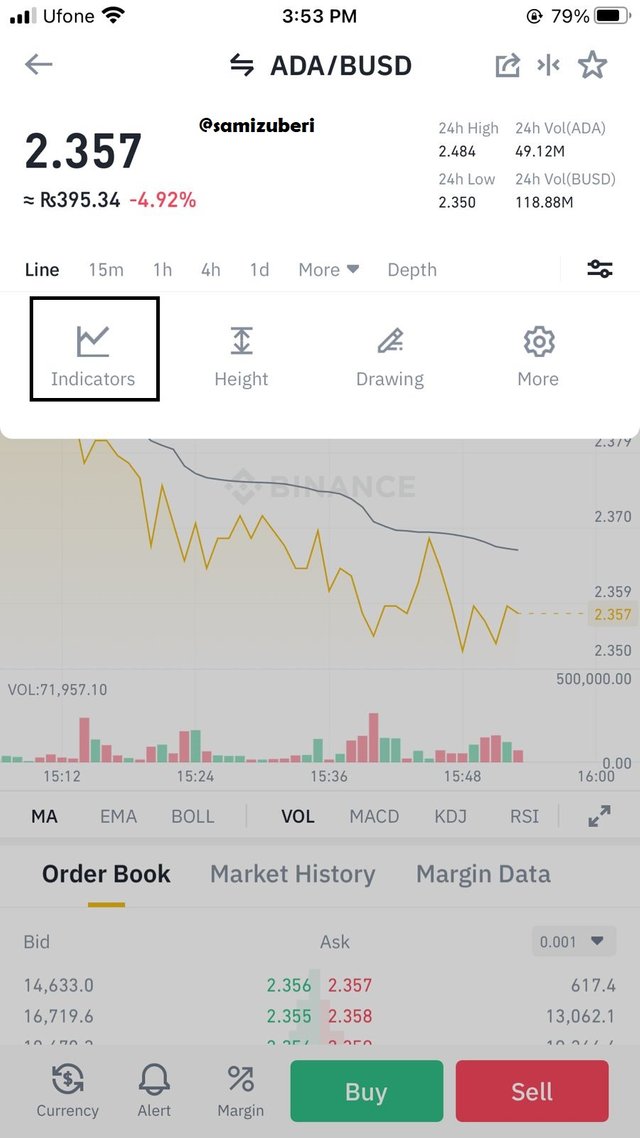
Then, under indicator, select an indicator of your preference. The list of possible indicators will show when you press the button.
.jpeg)
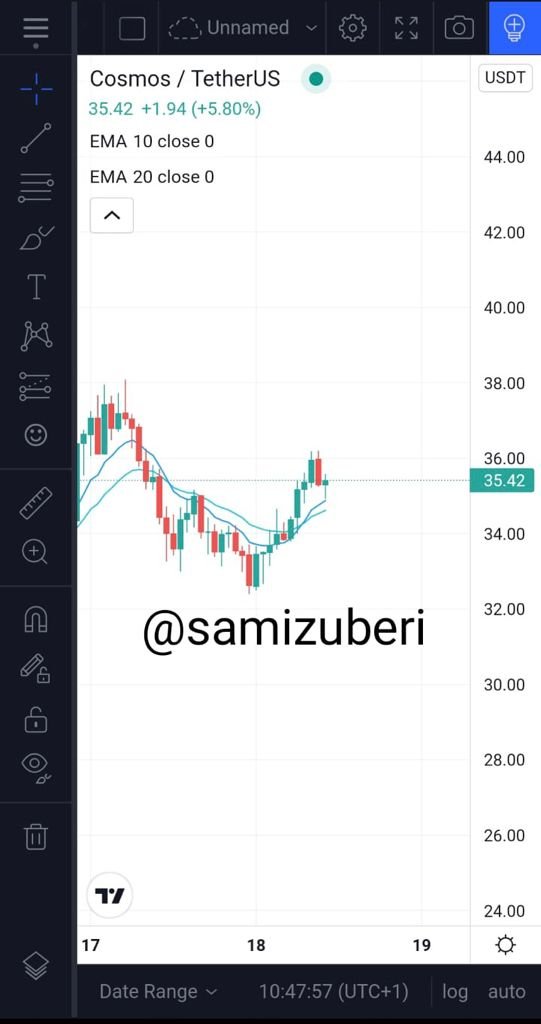
Click on any indicator of your preference and then click on the confirm. You can also customize the indicator by altering the coloration, brightness, and values. I choose EMA indicator.
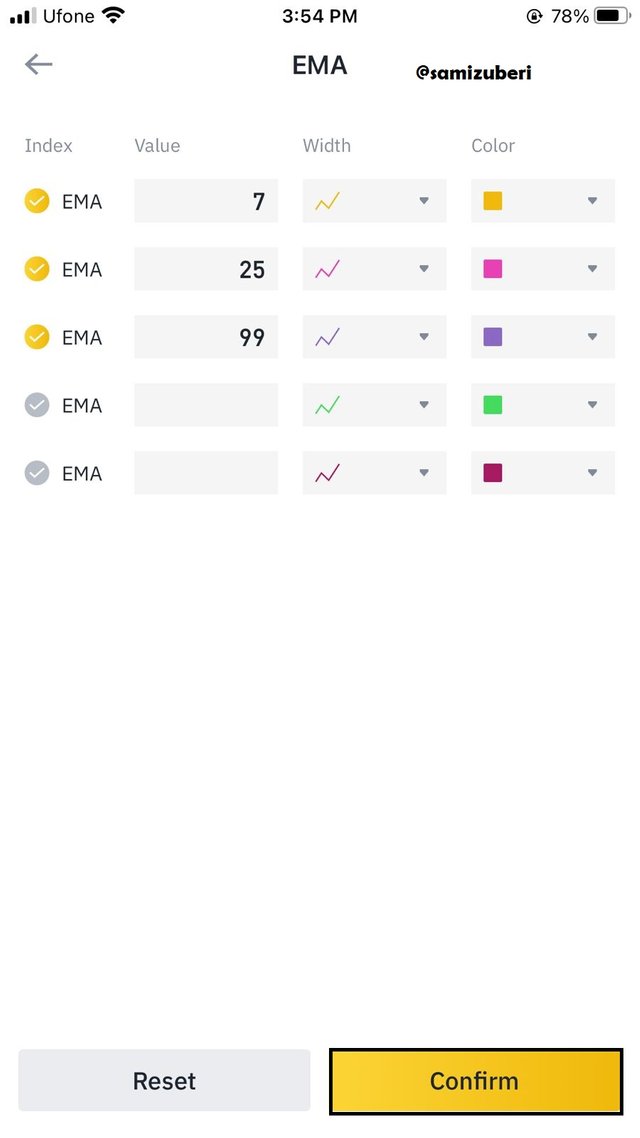
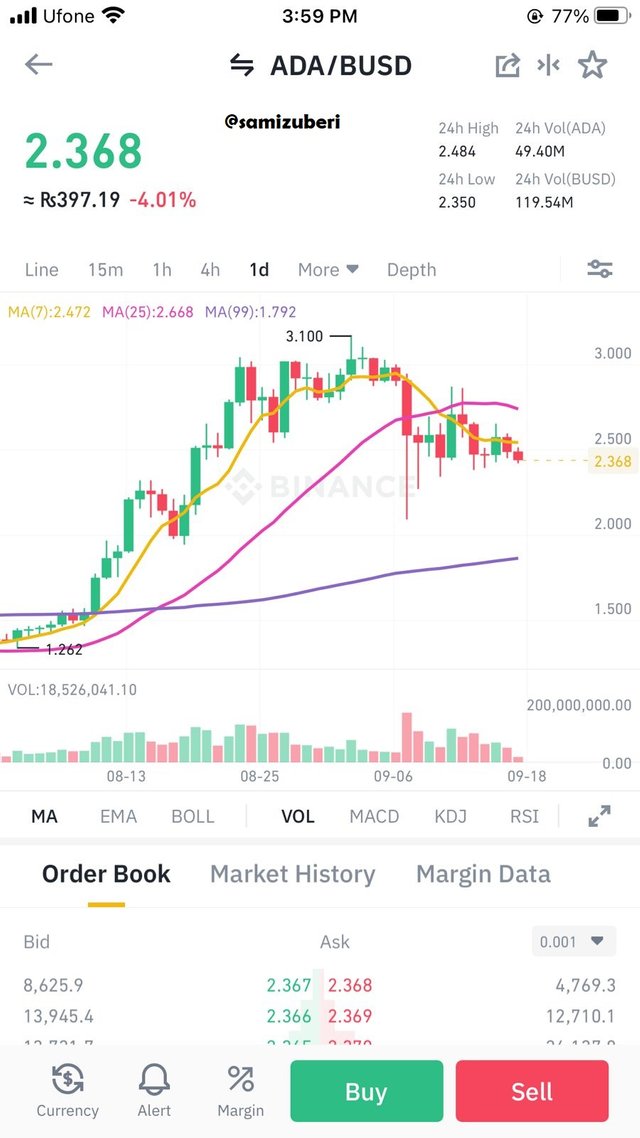
Finally, the outcome of the indicator you picked on the chart will be shown. Similarly, you may add more indicators in the same way.
Question 2(a)
Explain the different categories of Technical indicators and give an example of each category. Also, show the indicators used as an example on your chart. (Screenshot needed).
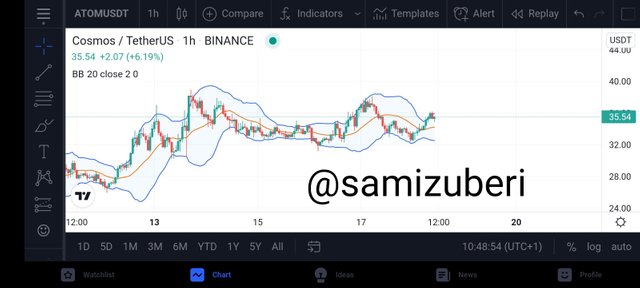
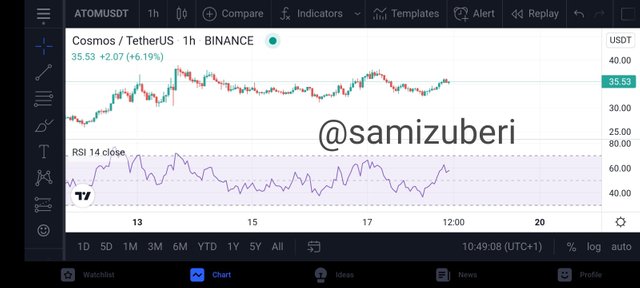
Volatility-based Indicators :
The value of such a commodity or cryptocurrency pair may be highly volatile at times, going both above and below. The standard deviation calculated from historical prices is used to illustrate volatility. It simply implies that the faster a market's price fluctuates, the greater the market's volatility. The goal of volatility-based indicators is quite similar to the purpose of oscillators: to detect market imbalances and create indications that might help us profit from them. Overbought and oversold indications are also generated by these indicators. If prices grow too quickly in comparison to past trends, they may quickly reach a point where they are no longer sustainable. Indicators based on volatility provide us with accurate information about such circumstances. Traders may benefit by examining price movements with volatility indicators.
Momentum-based Indicators :
The pace of change in such a market prices is measured by momentum indicators. Regardless of how much the value seems heading up or down, momentum indicators show market volatility over period as well as the intensity of these kind of shifts. Even as value of a commodity increases or drops, momentum indicators typically considered as fluctuate between over to sold. Strong momentum is indicated by a large rise in prices, whereas weak momentum is indicated by gradual price fluctuations. The fluctuation gets indicated by the momentum.
Trend-based Indicator :
The trend indicator assists traders or dealers in determining the trend of the market. Traders can use this sort of indication for spot market circumstances that are trending. Traders that operate only with trend have a reputation for being extremely successful. That is an indication which displays this manner in which value moves throughout the marketplace, as well as whether or not really the pricing are rising and whether or not such a trending occurs. This trend-based indicator allows everyone consumers to see if there is a high or low trend.
Question 2 (b)
Briefly explain the reason why indicators are not advisable to be used as a standalone tool for technical analysis.
The accuracy of indicators' signals is not guaranteed. It may send out misleading indications or delay beyond price levels. Many technical indicators use data that already exists, which experts then attempt to predict through into prospective. An indicator is a resource that enables traders with signals about their holdings so that they could make critical choices. As a result, that is not a good strategy for either a trader that operate based just on one indication. Technical indicators are just useful whether they're utilized in association with some well, adaptive investment portfolio. As just a consequence, it's not really recommended for use as a stand-alone technical analysis tool.
Question 2 (c)
Explain how an investor can increase the success rate of a technical indicator signal.
An investor may improve a Technical Indicator's success rate by utilizing to know the market circumstances and thus make excellent trade recommendations. Investors must thoroughly research and comprehend the indication as hopes of avoiding going even against purpose for which it was established. The pace of a technical indicator statement could also be increased by correctly setting indicators. The volatility-based technique may be preferred by an operator whom wants modest swings alongside frequent small gains. The trader would set up another well workflow and therefore only engage essential analytical techniques during the operation.
Special mentions to ;
@reminiscence01
Hello @afunkycares, I’m glad you participated in the 2nd week Season 4 of the Beginner’s class at the Steemit Crypto Academy. Your grades in this task are as follows:
Observations:
An overall good performance. I will have to point out that the post was not justified and you did not put a conclusion.
Recommendation / Feedback:
Thank you for completing your homework task.
Thankyouu professor.
Thank you for the review, professor.
@steemcurator02