[Support and Resistance Breakouts] - Crypto Academy / S6W3 - Homework post for professor @pelon53
Hello Everyone!
This is Sami Zuberi , hope you all are well. I am exceptionally hope set aside a few minutes for perusing my post for @pelon53 and valued it. Here i am going to impart my views on "Support and Resistance Breakouts". So how about we begin

Made this above poster on canva

Question 1.
Explain in detail the advantages of locating supports and resistances on a chart before trading.
Whether you're an experienced trader or a beginner, you should be able to locate support and resistance on a chart of an asset. The importance of discovering support and resistance levels in the market before trading is critical since it allows you to understand the market's overall phase. When it comes to technical analyses, support and resistance are crucial. Key volatility levels are identified using support and resistance. These critical liquidity levels are the sectors where the majority of the market's traders place their orders to be filled. Support and resistance are frequently tricky, however once you could spot them correctly, you'll be able to make good trades without relying on any temporary blip indicator.
- Traders or marketers can use support and resistance levels to get insight into the current market trend and take a good trading position. It's a lot easier to interpret market structure and formations when you know where to look for support and resistance.
Prior trading, locate support and resistance to have a better understanding of marketplace patterns. Another evident advantage of finding support and resistance is that traders can see exactly when the asset's price is most demanded.
Recognizing support and resistance on an asset's charts can provide or inform us about the trend's direction or what to expect. Additional benefit of identifying gaps of support and resistance before trading is that it allows traders to determine the market's trend or stability.
Traders are also capable of establishing and locating appropriate exit points. Traders expect a reversal of the asset's pricing estimate at resistance, allowing them to abandon a transaction and avoid becoming caught in the market. We can simply find trading signals to make trades using support and resistance levels. Though we all understand, whenever prices hit certain levels, they normally revert.
The trader's mentality is improved by using support and resistance levels. Trading needs a sound cognitive approach and also a technical technique.
Question 2.
Explain in your own words the breaking of supports and resistances, show screenshots for the breaking of a resistance, use another indicator as a filter.
Once the value of an asset goes beyond its original level or first high, establishing new higher peaks, it is said to have broken through the resistance level. When the price of an asset drops below the original low of the asset, producing a new lower low, it is termed to be a breakout of the support level. As price moves from support to resistance, there will always be a moment when Market phase must transition from support to resistance; at that time, we will state a break-out has arrived.
Breakouts frequently happen after a spanning market has modified its market structure. The sustained upwards and downwards movement of tendency is referred to be a breakout in support or resistance. Breakout of resistance basically relates to a persistent upward rise of price above the initial points of resistance. Breakouts on charting are occur in a variety of manners. For example, in an extending market, the price might violate any resistance or support and draw back to the breached region prior moving either upwards resistance or downwards support.
Imagine the pricing is operating inside a particular resistance and support range, and the price finally breaks through the range's resistance, indicating a transition or continuance of even a bull market. To demonstrate this, I'll use the resistance breakout in conjunction with the RSI indicator.
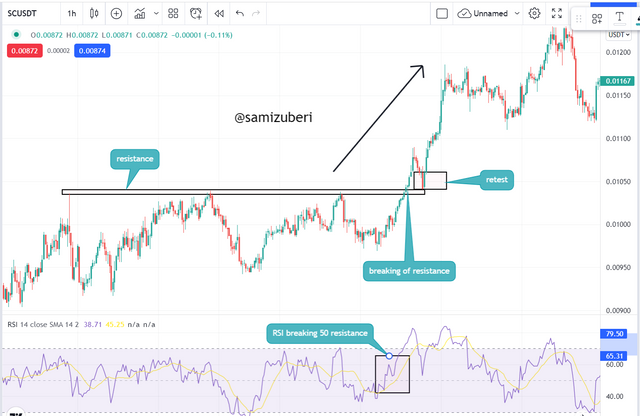
Break and Retest of A Resistance Zone
The RSI indicator line was well up from the 50 midpoints, indicating the possibility of a positive trend. Price broke well above the maximum top point resistance level and hit a big high after price development near the resistance, but then came down to retest the newly formed support level. The stop-loss pricing will be set underneath the resistance level, while the take-profit price should be set above the prior highest points.
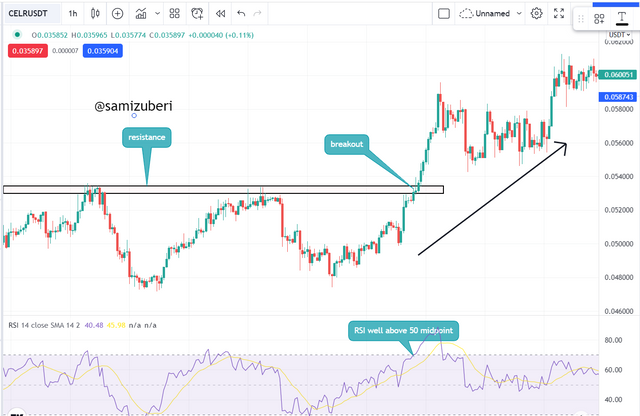
Break of Resistance and Continuation
The price movement's strength is quite erratic and strong in the screenshot below, however when the price valuation breaks a resistance level, the bullish trend continues without the price backing away to reassert the earlier breached barrier, which has now become support. According to the chart below, the RSI indicator line was above the 50 midpoints, indicating a possible bullish trend. With great volume and variety, price burst over the resistance level after price development around the barrier. As a consequence of the price's tremendous movement, this has happened.
Question 3.
Show and explain the break of a support, use an additional indicator as a filter, show screenshots.
In some kind of analysis on charts, the break of support happens when market has been seen in a range between the support and resistance levels. When price crosses and closes below a defined swung low point, it is said to have broken through a support level. The support is a level where pricing will stop falling further, the selling pressure will cease, and the price will likely rebound back. When the price approaches the point where demand is exhausted and supply is gaining momentum, a break arises.
We argue that a support level has really been breached once the value of the asset continues to fall without halting at the initial support level. Perhaps with a big number of selling orders is it feasible to break through the resistance level. When the selling pressure becomes too great, the price drops and the bearish trend begins.
The breaching of the resistance/support level is referred to as a resistance/support level breakout. When the price is fluctuating, it moves between both the levels of resistance and supports. The price has no apparent trend at this time. It advances and reaches the resistance level. The price is pushed lower by the suppliers. The price has returned to the support level. Buyers pull the price up yet again, and the price pushes back up. It hit the resistance once more and continued its cycle.
Breakout of the resistance level
The resistance level is a position in which the price is anticipated to cease rising higher, the purchasing demand to stop, and the value to rebound.
Passing through the resistance line is only achievable with a big volume of purchasing orders. When the purchasing pressure is great, the price rises and the bullish trend begins. Traders should make critical trading decisions when a resistance level is breached.
The chart above shows the price trading in a tends-to-range zone for the first time. There was no apparent path. The price then broke through the support level and began to fall. Following that breakthrough, the decline began. This is an excellent moment to leave the market.
Break and Retest of A Resistance Zone with RSI indicator
The pricing was only fluctuating in a range area in the screenshot beneath. There was no apparent path. Both buyers and sellers had equal power. On the marketplace, no one had a monopoly. Sellers were driving the price downward, whereas buyers were pulling the prices back up. As a consequence of having the same capability, the market was just oscillating between the support and resistance levels.
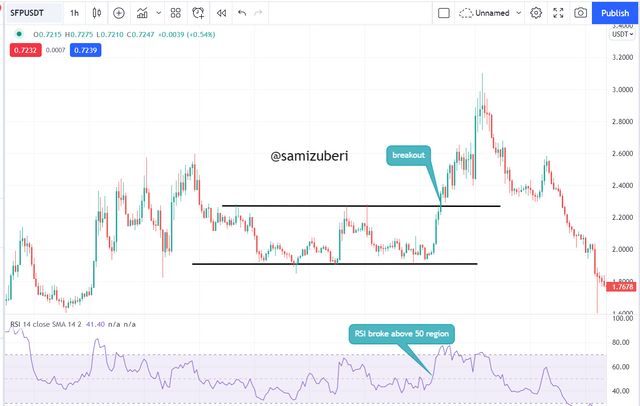
The value was well below the 50 bands in the fluctuating zone. Whenever the price broke through the resistance level, the RSI began to move just above 50 bands, indicating a buy signal and an upswing. The breakthrough will be confirmed when the price returns to the prior resistance level to retest it. Furthermore, an increase in the RSI will corroborate it.
Question 4.
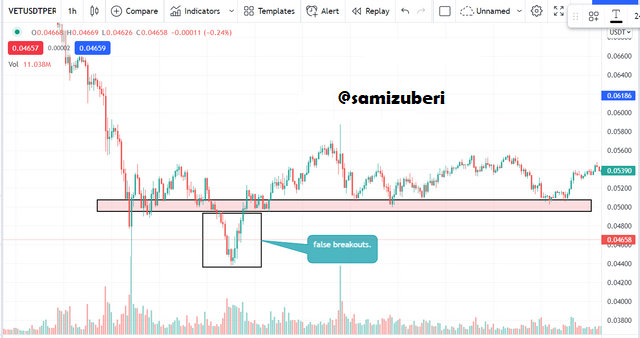
Explain what a false breakout is and how to avoid trading at that time. Show screenshots.
Fake outs are what false breakouts are known as in the crypto market. Whenever the price breaches a strong critical level and then reverses, this is referred to as a false breakout.
Whenever there is a breakthrough, the price is usually predicted to climb higher (along with the breakout). However, when the marketplace rejects the breakout and it returns, the breakout is likely to be a fake breakout.
It is quite difficult to pinpoint these breakouts prior to the actual outbreak. However, we employ technical indications to aid in the identification of a good breakout.
These false breakouts are typically produced by the activity of the fed's whales. They occasionally utilize their massive quantities to drive the market either above or below the resistance level, resulting in a completely different view of the market.
This is the main reason for the fake breakout. Even specialists might be fooled by these fake breakouts from time to time. In this instance, it's a good idea to double-check the confluences with certain technical indicators.
These misleading breaks are occasionally generated by some basic analysis. These animals control the whole market with simply retweets and news coverage.
To entirely avoid these indications, we need to wait for all confluences to align before entering trades. And, as previously said, you may utilize technical indicators in addition to these support or resistance levels to prevent wrong breakouts.
Question 5.
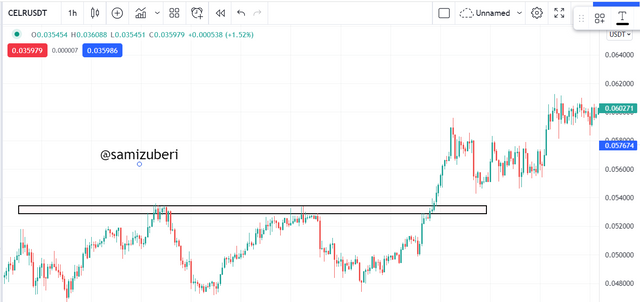
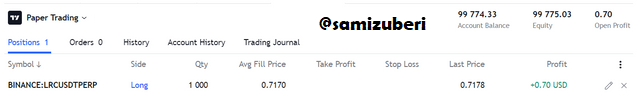
On a demo account, execute a trade when there is a resistance breakout, do your analysis. Screenshots are required.
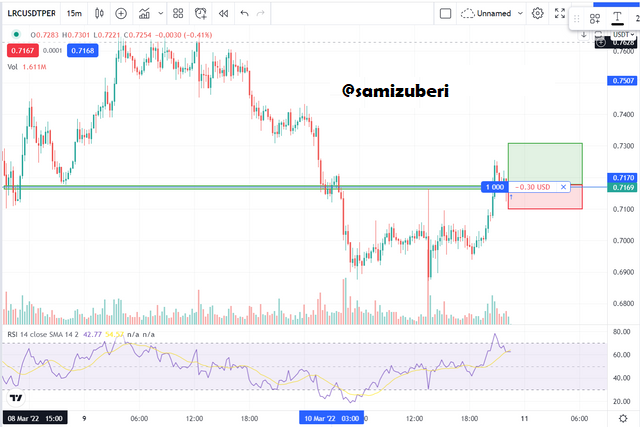
The picture above clearly shows that the price of the LRCUSDT is ready to break through the resistance zone. We are unable to enter the market to buy since the price has broken above the resistance zone. We put a take-profit order immediately above the resistance line in this case. We placed a stop loss underneath the resistance level and a take profit at the same level.
Question 6.
On a demo account, execute a trade when there is a support breakout, do your analysis. Screenshots are required.
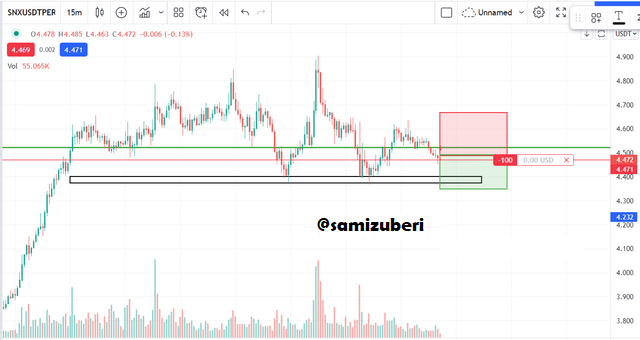
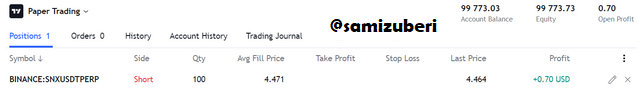
The graph above clearly shows that the price of the SNXUSDT has broken through the support zone and is going to the next support level. Nevertheless, we can determine the amount of support and enter the marketplace.
In this case, we completed the trade immediately after the resistance level and let the marketplace play out until the price reached the next support level.
CONCLUSION.
Trading is the order of the day these days. Traders in the crypto ecosystem employ a variety of tactics to complete transactions. Nevertheless, I propose that everyone learn at least two or three tactics that can be highly successful. Trying out new techniques all the time would do more harm than good. Remember to utilize appropriate risk management when trading.