CRYPTO TRADING STRATEGY WITH MEDIAN INDICATOR]- Steemit Crypto Academy- Homework post for Professor @abdu.navi03 by (@samizuberi)
Hello Everyone!
This is Sami Zuberi , hope you all are well. I am exceptionally hope set aside a few minutes for perusing my post for @abdu.navi03 and valued it. Here i am going to impart my views on "CRYPTO TRADING STRATEGY WITH MEDIAN INDICATOR". So how about we begin.
Made this above poster on Canva

Question 1.
Explain your understanding with the median indicator.
The median indicator is a moving line indicator that shows signals in a trend. This indicates that the indicator is indicating the direction of a market trend. The median indication is noted for displaying signals that are almost identical to the Exponential moving average indicator. The median indicator is used to calculate market volatility. Bands as well as lines distinguish the median indication.
The ATR, or Average True Range, is used by the median indicator to compute the middle line's median. The median value of a chart's high and low points is shown by the median indicator. The value of the median indicator is comparable to that of an EMA of the same value.
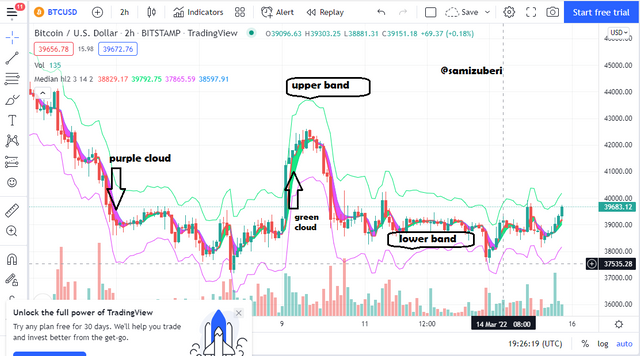
Green and purple are the colors used to indicate a bullish and bearish trend, accordingly. When the green cloud appears, it indicates that the trend is rising and that buyers are in total control of the market. On the indication with a cloud that indicates bearish with purple color and bullish with green color. When a purple cloud appears, it indicates that the trend is heading downward.
The colorations make it simple to spot trends and changes in trends, while the ATR channel aids in determining price volatility over time. When the colors of the Median Indicator change, it provides distinct signals. As a result, it is quite simple to comprehend. This allows us to determine when buyers have the upper edge in the market and when sellers have the stronger position. As a result, the Median Indicator is not only efficient but also simple to use.
Question 2.
Parameters and Calculations of Median indicator. (Screenshot required).
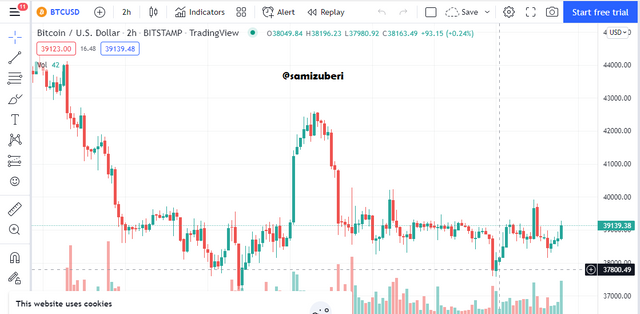
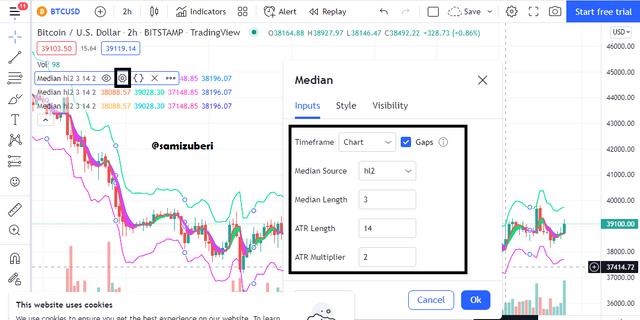
First go to the Trading View , Here you may choose any pair of assets to add the indicator to from the chart interface.
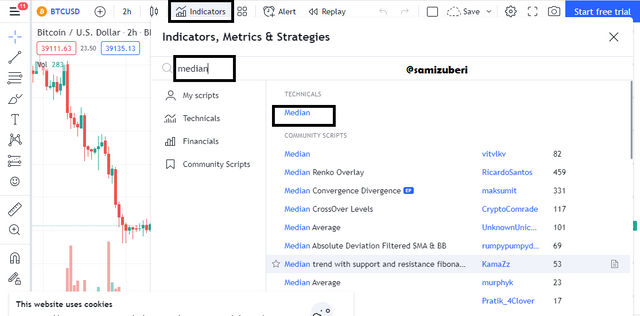
You choose Indicator from the top menu, search for the median, and then select it to add this indicator to your chart.
To adapt the indicator to your trading strategy, hover over the name of the indicator on the chart, select the settings option, and afterwards clicking on this. When we go into the indicator's settings, we can see data like median source, median length, ATR length, as well as ATR Multiplier in the inputs area, and we can alter their values to our choice.
Calculation of Median indicator :
Calculating the difference between the median line as well as the EMA Line at simultaneously length is all that is required for the median calculation. Once the median value exceeds the EMA value, then median indicator becomes green, indicating an uptrend. When the median value is lower than the EMA value, then median indicator becomes purple, indicating a downtrend.
So,
Median value =( Highest price + Lowest price)/2
&
EMA Value = (Closing price × Multiplier)+EMA(Previous Day) × (1- Multiplier)
Multiplier is set at 2 as per default.
The formula of median value is Median value = Highest price + Lowest price / 2
The formula of median indicator = ATR %change ( Median Value, EMA Value)
Purple color indicates that the EMA percent change is more than the median value which is Downtrend movement. (EMA %change >= Median Value)
Green color indicates that the EMA percent change is greater than the EMA value which is Uptrend movement. (EMA %change >= EMA Value)
Upper band = Median length + (2ATR)
Lower band = Median length - (2ATR)
As we can see from the specifications that such settings have default values, which are good in most cases but may be changed whereas if trader wants different desires.
Question 3.
Uptrend from Median indicator (screenshot required)
When utilizing the median indicator, we can clearly recognize it when the median value is higher than the EMA value, indicating that the trend goes upward. When the median result is green and we observe the thick line heading below the market price, then is the greatest time to be buying. When a green cloud develops, it indicates that the market is on an upswing or upward, and buyers approach the market.
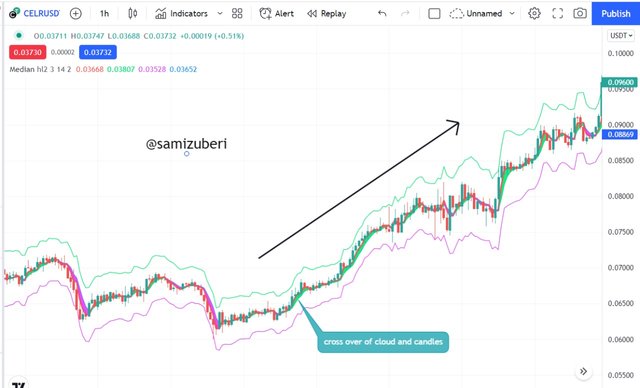
According to the chart above, The green cloud color creation, as well as the price movement of the asset crosses and closes above the green cloud formation, can be seen clearly. The appearance of a green cloud indicates that the trend has shifted from a bearish to a bullish direction. This suggests a positive market trend as well as a purchase indication. Traders then enter the market and take purchase positions.
Question 4.
Downtrend from Median Indicator (screenshot required)
Similarly, a downward activity may be readily identified using the median indicator. If we observe the median value underneath the EMA value, we infer that the trend is downwards, and verification of this is commonly visible by the purple cloud that forms as a consequence of this. Whenever the purple cloud appears, it indicates that the momentum is negative, and a sell entry may be made. Having a look below on a chart for more information.
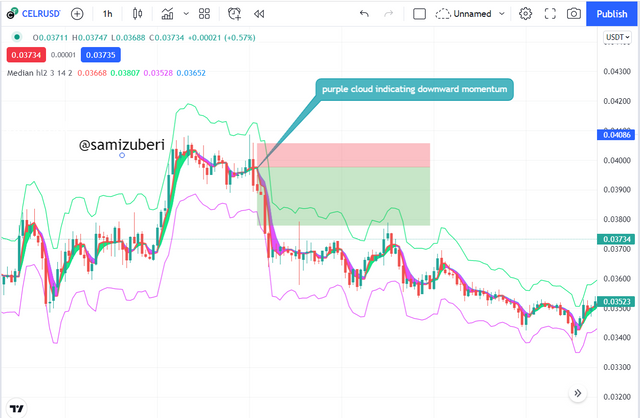
Referring to the image before, you can see that the purple cloud shows that the trend is a downturn, which means that the trend is trending lower. At this point, sellers join the market by taking a position. The existence of the purple cloud indicates that the trend has shifted from a bullish to a negative trend.
Question 5.
Identifying fake Signals with Median indicator(screenshot required)
Regardless of the concept that the median indication is a trend-based indicator, it also generates erroneous signals, which may lead many traders astray and cause them to take positions they should not. As a competent trader, you should not put your faith in an indicator because none of them are actually completely successful. To be cautious during trading, it is advised that at least two or more indicators be utilized to adequately validate the trend development. To detect bogus signals in the median indicator, I will combine it with the RSI indicator, which will filter out any disturbance as well as fake signals provided by the median indicator.
What is RSI?
The RSI indicator, as we previously understand, is a tool used to determine if a commodity is overbought or oversold. Whenever the RSI number is 70 or higher, it indicates that the commodity is in an overbought zone and a market turnaround is probable. Similarly, whenever the RSI value is 30 or below, it indicates that the asset is in an oversold state and a likely trend turnaround is imminent.
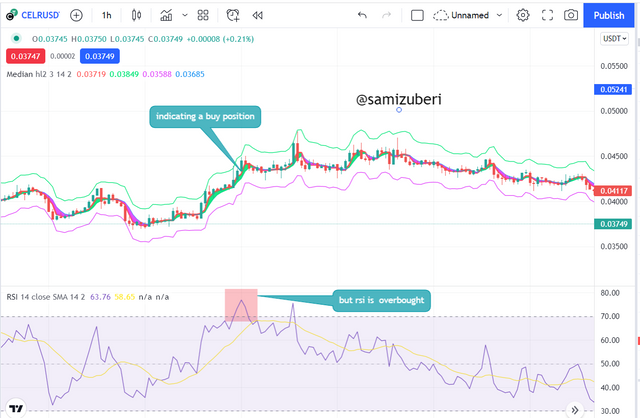
The chart above indicates that the median indicator is green, indicating a buy entry and that the RSI indicator is presently in the overbought range. The median indicator should be indicating a trend reversal at this time, yet it is still indicating a buy situation. As a result, for the trader to take a position, these two signals must concur. Traders are anticipating a probable trend reversal in the other way at this juncture.
Question 6.
Open two demo trades, long and short, with the help of a median indicator or combination that includes a median indicator (screenshot required)
Sell Trade Entry.
A pair of GRTUSDT on a 15min timescale was considered based on cloud law. As shown in the chart above, the cloud is purple, and a bearish candlestick can also be noticed. The RSI indicator is currently in the overbought zone, indicating that the trend is negative.
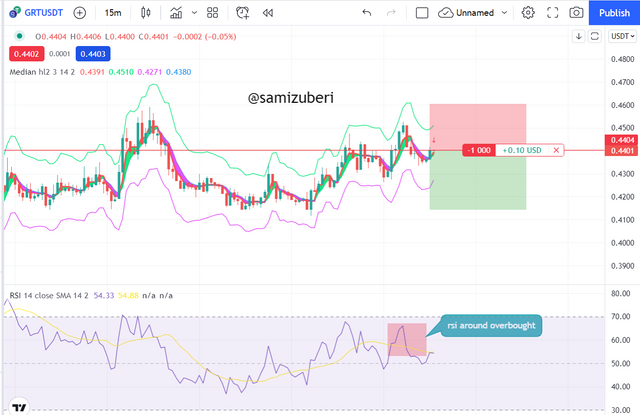
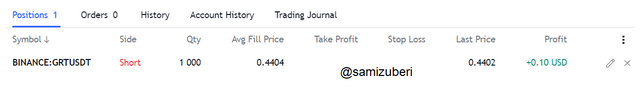
As you can see in the picture above, a sell entry position was placed at that moment. At the same time, the stop-loss and take-profit levels were considered. The purple cloud indicates that the trend is bearish at that moment. See the evidence of trading activity underneath.
Buy Trade Entry
A pair of LUNAUSDT on a 1H timescale was considered based on the cloud law. The cloud, as shown in the chart below, is green in color. The RSI indicator is currently above 50, indicating that the trend is positive and that a probable resumption may occur.
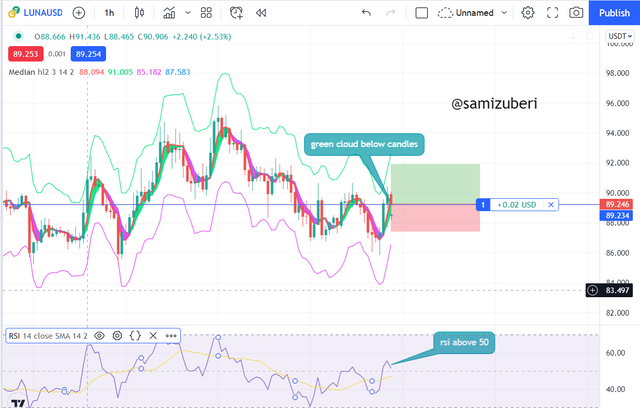
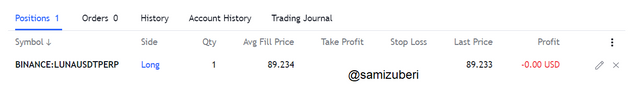
As you can see in the picture below, a buy entry position was taken at that moment. At the very same time, the stop-loss and take-profit levels were considered. The green cloud indicates that the tendency is bullish at that time. See the evidence of trading here.
Conclusion:
Finally, I'd like to point out that the lecturer gave us a really instructive lecture that has helped me understand more about the median indicator. The median indication is a cloud of green and purple colors that represent a bullish and bearish trend, respectively. The median indicator is a trend-based indicator that is used to determine market trends. It is one of the most essential technical analysis tools.
It is made up of a cloud generated by the difference between the EMA and Median lines. The upper and lower bands will be used to detect market volatility, while the median, EMA, and ATR will be used to interpret trend direction. To filter out the false signals, we should merge additional technical indicators with the Median indicator.