[Trading Crypto with On-Balance Volume Indicator] || Crypto Academy / S5W4 || Homework Post for @fredquantum|| By @salmanwains
This is Season 5 Week 4 of Steemit Crypto Academy and I'm writing homework task about "Trading Crypto with On-Balance Volume Indicator" assigned by Professor @fredquantum.

Question# 1
In your own words, explain your understanding of On-Balance Volume (OBV) Indicator?
A famous stock marketer that has many contributions in the stock market to his known Joseph Granville is the founder and creator of the On-Balance Volume (OBV) Indicator. It is a type of indicator that relates the buy and sell volumes with direction of the trends and thus is a momentum-based indicator.
As we know that trading volume increases and decreases due to a tussle between buyers and sellers and as the number of buy and sell order increases or decreases so does the volume.
The momentum-based indicators employ the knowledge of repetitive volume changes to predict future trends and direction of the market. If the transaction volume is inclined towards buyers that is more and more buyers entering the market, there is a greater number of traders holding the asset the price of the asset will significantly raise and so does the trend.
Similar to that if there are more sellers in the market, or more and more buyers are exiting their position, there is a greater number of traders that are selling their assets the volume will be inclined towards the buyers, the price of the asset will. Concluding it the OBV indicator provide a visual representation of the market’s cumulative volume by adding the higher values of volume over the days and subtracting the lower values.
The indicator line is synonymous to the trend direction showing higher highs in uptrend and lower lows in a downtrend therefore it is less confusing than many other momentum indicators.

Question# 2
Using any charting platform of choice, add On-Balance Volume on the crypto chart. (Screenshots required)?
To add OBV indicator in your chart follow the following steps:
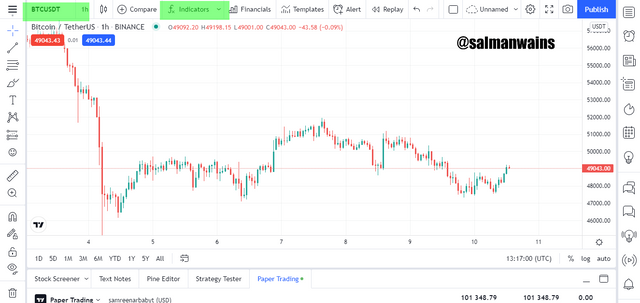
First Go to tradingview.com
and then Open chart of any asset
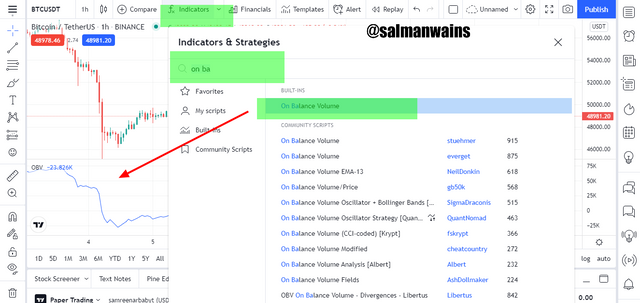
Click on indicator icon and search On-Balance Volume Indictor.
Click on it to add it in the chart.
You can configure settings by clicking on the settings icon as shown in the screenshot below.
There are three types of settings styles, visibility, and inputs
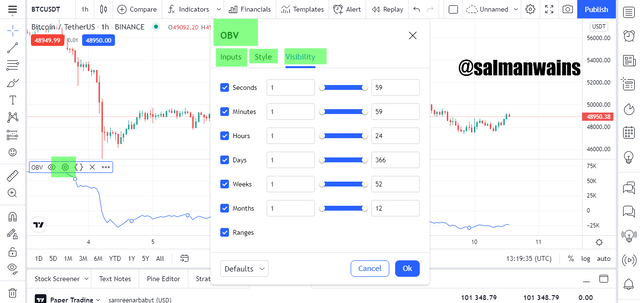
In the visibility you can select different time till which the indicator will remain visible
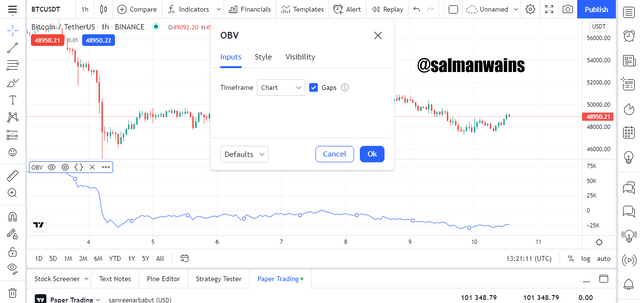
In the inputs you select the time frame
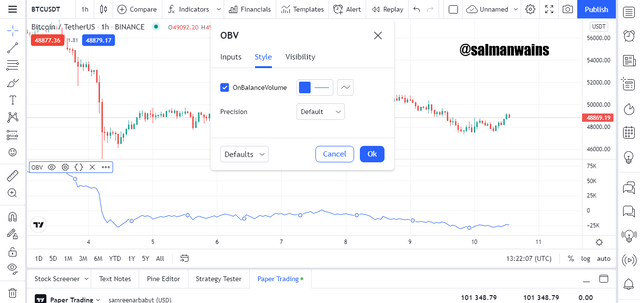
In the style option you get to decide the color of the indicator and the thickness of the line.
Question# 3
What are the Formulas and Rules for calculating On-Balance Indicator? Give an illustrative example?
OBV current: Current on Balance value.
OBV previous: Previous on balance volume.
Thus, we can say from the above calculation that the on-balance volume is calculated based on the current and previous day's closing of prices (if the selected time frame is 24 hour).
There are the following three possibilities:
If the closing price of the current day is lower than that of the previous, we subtract smaller value from the higher value so
OBV: OBV previous – Current Volume
If the closing price of the current day is higher than that of the previous day, we again subtract smaller value from the higher value so
OBV: OBV previous + Current Volume
If the closing price of the current day is equal to that of the previous day, then the reading will be 0
OBV: OBV previous + 0
Question# 4
What is Trend Confirmation using On-Balance Volume Indicator? Show it on the crypto charts in both bullish and bearish directions. (Screenshots required)?
One of the many applications of OBV indicator in the chart is the confirmation of the trend. Whenever we use momentum indicator it helps relate the underlying transaction volumes with the currently trailing price and thus it confirms if the current trend is supported by the traders or not.
Similarly, if we see the volume inkling towards the sellers the trend is predicted to be bearish and if the volume is inclined towards the bulls the trend is expected to be bullish.
As I discussed earlier if it is predicting an uptrend the OBV indicator will be showing higher highs and higher lows and thus we will be seeing the market going higher and higher and on the opposite case if the OBV indicator shows lower highs and lower lows we will see the price declining as shown in the screenshot below.
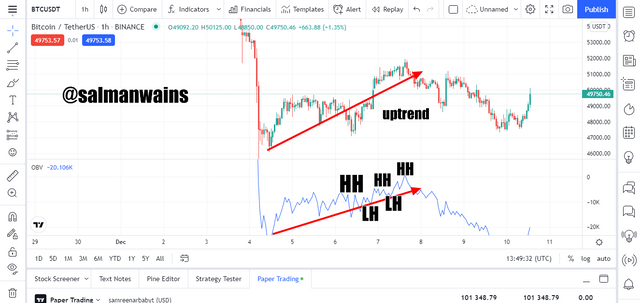
In the screenshot above we can see that the OBV indicator can be seen making higher highs and higher lows and this is reflected by the price action which too seems to be making higher highs.
Contrary to the chart above we can see the OBV indicator making lower lows and lower highs and this was reflected in the rice action which began moving downward.
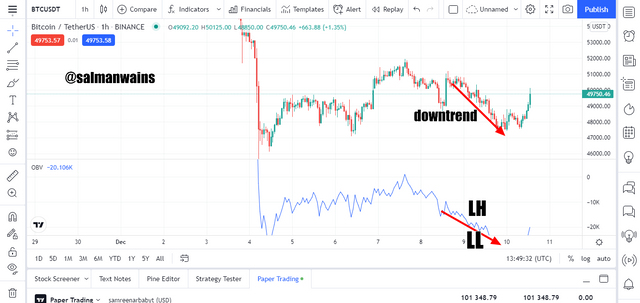
Thus, this implies that OBV indicator can be used for trend confirmation. When the OBV indicator shows a declining movement consisting of lower highs and lower lows we can see the price making a bearish trend and bears can place short signals. When the indicator shows a rising movement consisting of higher highs and higher lows, we can see the price action to be up trending and bulls can place order.
Question# 5
What's your understanding of Breakout Confirmation with On-Balance Volume Indicator? Show it on crypto charts, both bullish and bearish breakouts (Screenshots required)?
We often see that the market is three phases bullish phase, bearish phase and no-trend phase or phase of consolidation when the market is indecisive phase. All three phases are visible on the OBV indicator and when we see a phase of consolidation, we can predict a trend very soon. Thus, a consolidated structure can therefore be an indication of trend reversal.
He consolidated phase is seen as when both the sellers and buyers and sellers are trying to gain momentum. If the sellers end up gaining momentum the price trails down and if the buyers gain momentum the price will break the phase of consolidation to climb higher.
For example, in the chart below we previously saw a downtrend then the market showed no trend for a while and bullish and bearish candles could be seen forming this was visible on the OBV indicator indicated by the straight red arrow. The sellers then gained momentum and the bearish trend continued.
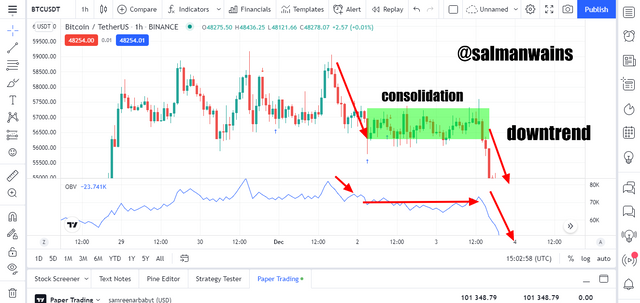
This can be seen as the bearish breakout.
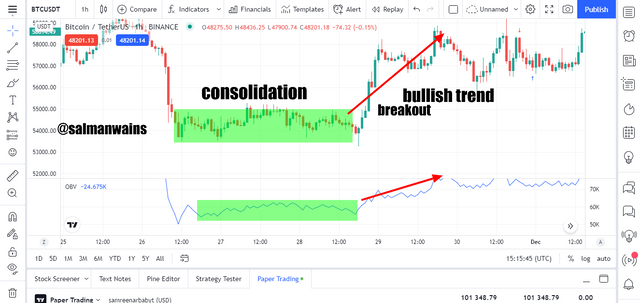
A bullish breakout is when the bulls gain momentum after a consolidated market. For example, in the BBTC/USDT chart below we could see that the initial trend was bearish followed by an indecisive phase after which the bulls gain momentum and we could see a bullish breakout followed by a bullish trend.
Question# 6
Explain Advanced Breakout with On-Balance Volume Indicator. Show it on crypto charts for both bullish and bearish. (Screenshots required)?
In many cases the breakout in the OBV indicator occurs well before the breakout in the price action and this significantly helps the traders predict reversals even when they happen. These are called Advance breakouts.
You will see the OBV line breaking the previous low or high price while the price line has not broken the previous low or high. It is because trends are determined by the activity of the buyers and sellers and volume is a direct indication of the concentration of buyers and sellers.
Practically if the price rises to retrace the previous high and similarly the OBV line rises to correct the price and makes a higher than the previous high although the price line has not yet been succeeded and this indicates an advanced breakout. Using the signal indications on the OBV indicator traders can still take the buy signal as the price will rise than the previous high.
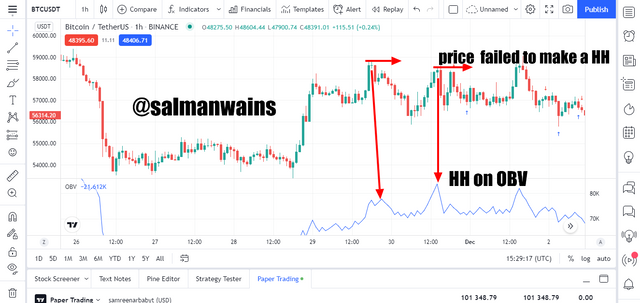
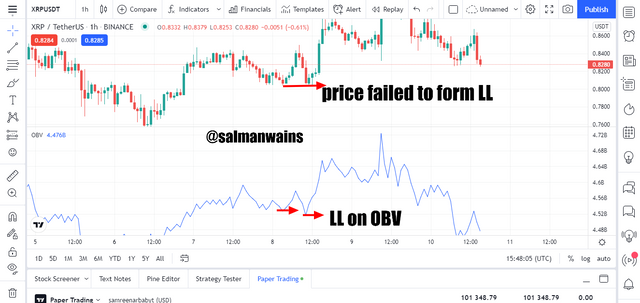
In case of a bearish advance breakout the OBV indicator line after retracing makes a low lower than the previous low although the price after correction fails to make a low lower the previous lows. We can see this situation as the price retraced to correct the bearish leg a double bottom structure was seen and the price did not break the previous low however a lower low was formed on OBV.
Question# 7
Explain Bullish Divergence and Bearish Divergence with On-Balance Volume Indicator. Show both on charts. (Screenshots required)?
A bullish divergence means that while the price is trending low the indicator shows higher highs or higher lows indicating a bullish reversal. This divergence sets of the price to the bullish trend. This indicates a decreasing buyers’ momentum. It is because buyers may be leaving after taking their returns and sellers may be entering any time soon.
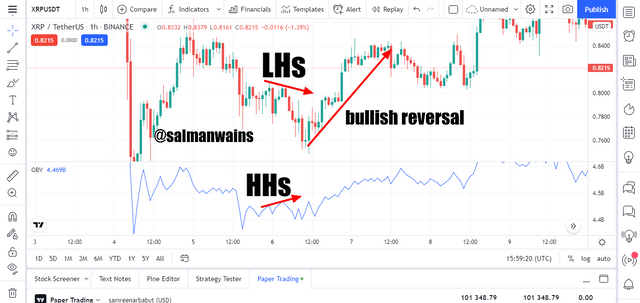
in the chart above we can see that the price was showing lower highs although there was not much that of difference even then the price after action did not make a significant higher high and remained low the OBV line showed higher highs showing a bullish divergence.
A bearish divergence means that while the price is trending high the indicator shows lower highs or lower lows indicating a bearish reversal. This divergence sets of the price to the bearish trend. This indicates a decreasing sellers’ momentum. It is because sellers may be leaving after taking their returns and buyers may be entering any time soon.
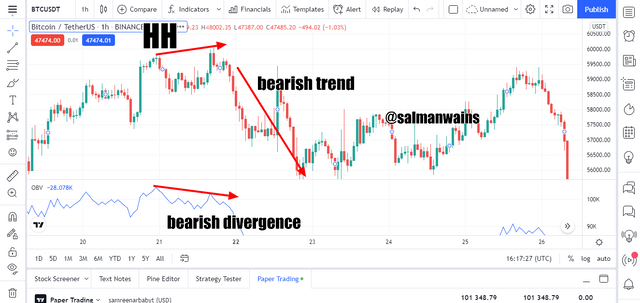
In the BTC/USDT chart above we can see that the price was moving in a bullish trend initially. The price was making higher highs. We then saw the formation of highs that were close enough the it was higher than the previous high however the OBV lien showed a bearish divergence.
Question# 8
Confirm a clear trend using the OBV indicator and combine another indicator of choice with it. Use the market structure to place at least two trades (one buy and one sell) through a demo account with proper trade management. (Screenshots required)?
Buy Trade:
The market was initially trading bearish. We could then see higher lows which were confirmed by the OBV indicator that also showed higher lows. I used RSI in combination of the OBV indicator to confirm buy signal. RSI was previously trading below the 20-line indicating that the market was initially and oversold region and a reversal can be expected.
As soon as the market showed bullish candles, I waited for the formation go higher highs and make use of the OBV indicating to confirm an uptrend. I placed a buy order the stop loss was et close to the previous low and the take profit was set to previous high that was approximately 1:1.
Sell Order:
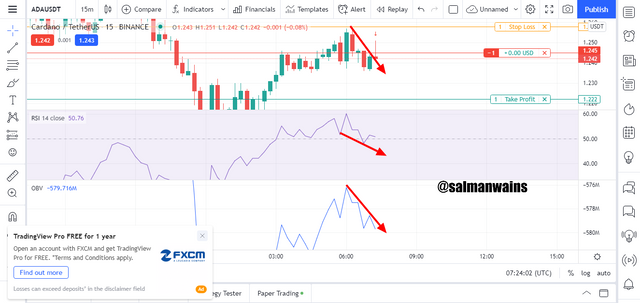
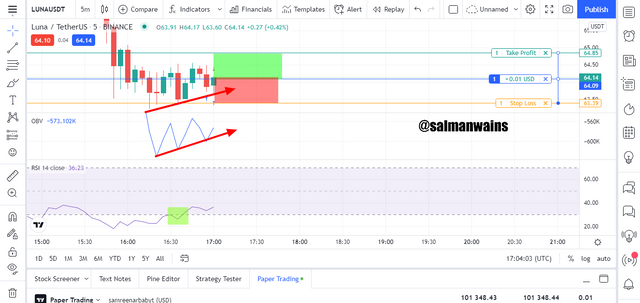
The market was initially trading bullish. We could then see lower lows which were confirmed by the OBV indicator that also showed lower lows. I used RSI in combination of the OBV indicator to confirm buy signal. RSI was previously trading below the 50-line indicating that a sell order can be taken. Here although the market did not touch the overbought condition a short trade could be taken in the retracement phase.
As soon as the market showed bearish candles. The OBV indicator was confirming the bearish trend. I placed a sell order the stop loss was set close to the previous high and the take profit was set to previous low that was approximately 1:1.
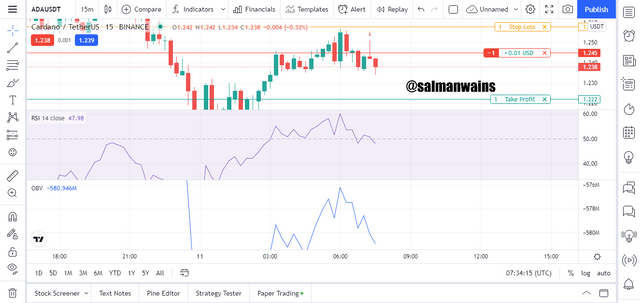
This is the condition of the trade after some time
Question# 9
What are the advantages and disadvantages of On-Balance Volume Indicator?
Following are the pros and cons of the OBV indicator:
Pros:
- It is leading indicator and combines the knowledge of transactions and trading volume in the charts to help us identify trend direction.
- It can also be used to estimate trend strength by or to locate when the trend is weakening after identifying divergence patterns.
- It is a leading indicator and thus predict reversals earlier than they happen.
- It does not depend on the price action.
Cons:
- It being a leading indicator may give false leads.
- Must be used with another indicator such as the RSI for the better knowledge of trend strength.
Conclusion:
On-Balance Volume indicator is a leading momentum indicator. It is extremely useful in identifying trend direction, reversal patterns and divergences. When used with RSI it helps in placing buy and sell signals at the most accurate levels. Its calculations are based on underlying higher and lower volume values. Since it is momentum indicator it helps us correlate price changes along with the changes in the trading volume to draw accurate leads.
Note :
All the Screenshots have been taken from the tradingview.com
CC:
@fredquantum
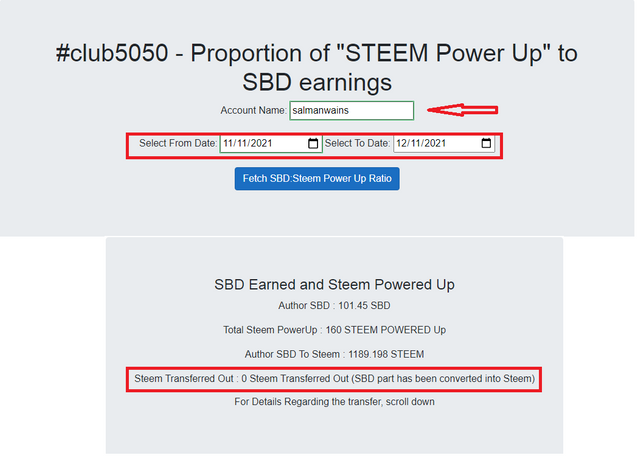
Club5050 Eligible