[Crypto Trading Using Zig Zag Indicator] || Crypto Academy / S6W1 || Homework Post for @ kouba01|| By @salmanwains
This is Season 6 Week 1 of Steemit Crypto Academy and I'm writing homework task about "Crypto Trading Using Zig Zag Indicator" assigned by Professor @kouba01


Question# 1
Show your understanding of the Zig Zag as a trading indicator and how it is calculated?
The zig zag indicator is a popular technical indicator that indicate different trends using the swing points; the higher swing and the low swings. The swings are connected through the diagonal lines which help in the identification of the overall trend.
These swings represent the high and lowest prices of the entity during the selected time frame. The new swing high or low is plotted when the price moves higher or lower based on a determined percentage depth.
The swing high and low when connected together then give a visual change in the trend. normally the random price fluctuations that i.e., with in the determined percentage are ignored by the Zig Zag indicator and thus Zig Zag indicator does not reflect micro trend.
It thus lowers the effect of random price fluctuations gives a smooth indication of price trends and direction.
Calculation
Zig zag indicator is calculated using the following formulae:
Zigzag = (HL, %change = Y, retrace = FALSE, Last Extreme = TRUE)
If %change >= Y, plot zigzag
Where;
HL- High or Low-price series)
%Change – Minimum price movement in percentage
Last Extreme - Changing variable
According to the following indicator calculation the zig zag indicator determines a high or low point based on the percentage depth.
Question# 2
What are the main parameters of the Zig Zag indicator and How to configure them and is it advisable to change its default settings? (Screenshot required)?
The Zig Zag indicator has two major parameters depth and deviation. These two parameters should work in correlation for the indicator to function properly.
Depth Parameter
Depth parameter is determined by the minimum number of periods or candles that the indicator will not plot as the new high wing or low swing compared to the previous swing points. By default, this has been set to 10.
Deviation parameter
Deviation parameter is the minimum percentage movement that the indicator takes into account before plotting the new high or low swing point. This is the major parameter that plays a role in reducing random price fluctuation. By default in most trading platforms it has been set to 5.
Configuration of the parameters
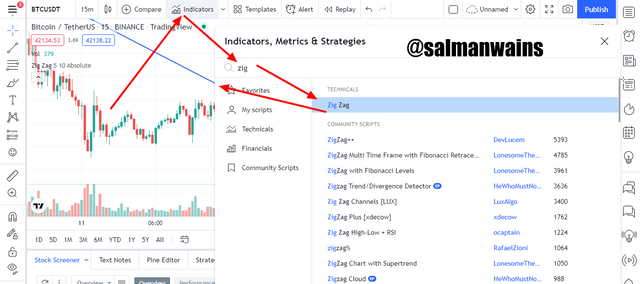
- Go to tradingview.com
- Open any chart and click on the indicators icon as shown in the screen shot. Write Zig Zag in the search bar and select it once to add it in the chart.
- In the chart near the name of the indicator click on the settings icon from here you can see the configuration settings option.
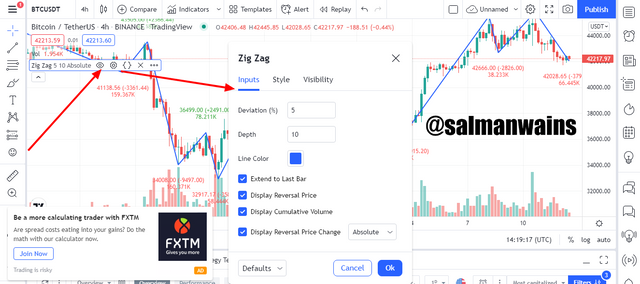
In the above screenshot we see the input menu and from here we can edit the deviation and depth. The deviation by default is 5 and the depth is 10. You can also change the line color and other settings.
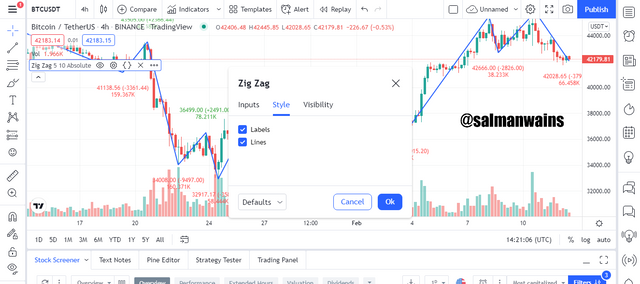
Style changes
In the style menu you can opt to have or not have the lines and labels.
Visibility
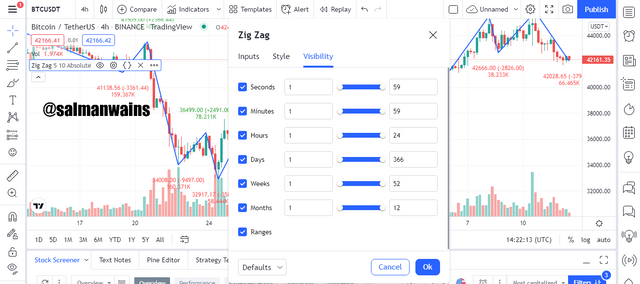
From the visibility sub menu, you can change the visibility criteria.
Changing the Default Settings
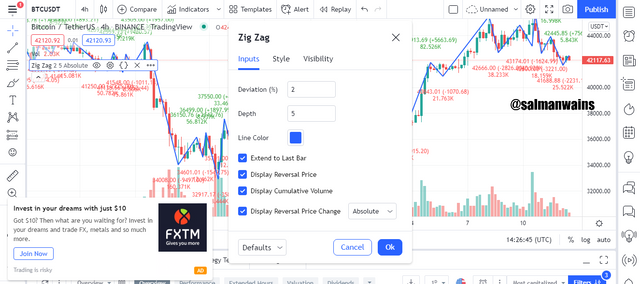
The default settings should be modified based on the activity of an asset, your trading style and time frame. Choosing a wrong setting can directly contribute to sensitive and insensitive conditions. Trader prefers this indicator as it helps them to filter two quick and short live signals so using too short settings will destroy that purpose as shown in screenshot below.
When shorter settings of 2 and 5 were used the Zig Zag indicator stuck very closely to the price line destroying its purpose of use.
Question# 3
Based on the use of the Zig Zag indicator, how can one predict whether the trend will be bullish or bearish and determinate the buy/sell points (screenshot required)?
Zig Zag indicator can help a trader predict the direction of market and hence the trend.
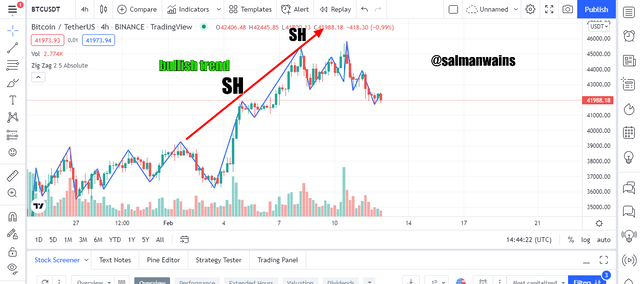
Bullish trend
we know that a zig zag indicator structure consists of highs and lows and it may help us in the identification of a bullish trend using a diagonal lien consisting of highs. In the bullish trend every new high swing point will be formed higher than the previous. In addition to that every low swing point will be formed higher than the previous. Thus, a structure consisting of higher highs and higher lows accounts for a bullish trend.
For example, in the BTC/USDT chart we see higher highs according to the percentage depth of market.
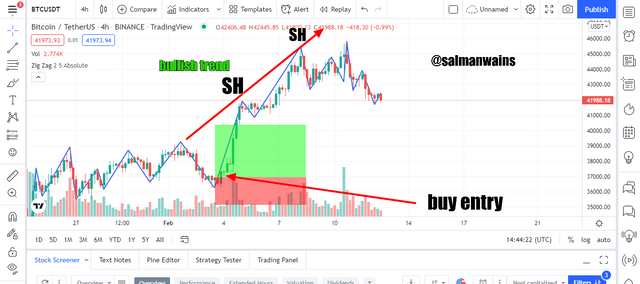
Buy Entry
This trend then can be used to take an accurate buy entry. A buy entry should be taken when the price makes a low that is higher than the previous low. An ideal stop loss and take profit ratio in these settings is 1:2
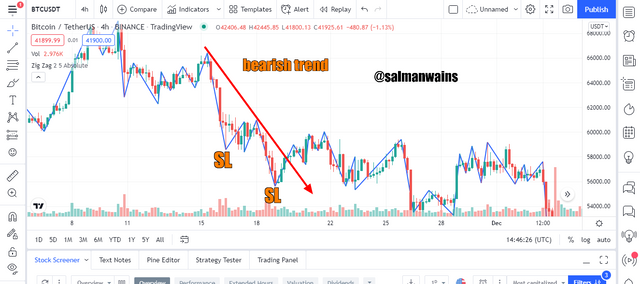
Bearish trend
In the bearish trend every new high swing point will be formed lower than the previous. In addition to that every low swing point will be formed lower than the previous. Thus, a structure consisting of lower highs and lower lows accounts for a bearish trend.
For example, in the BTC/USDT chart we see lower highs according to the percentage depth of market.
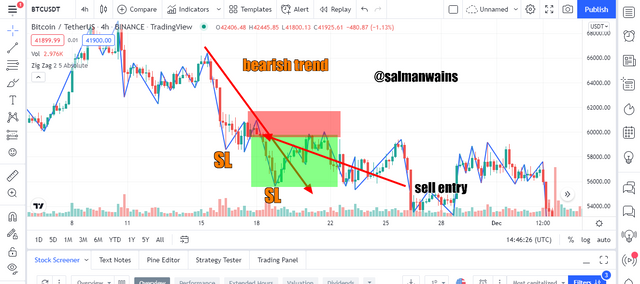
Sell entry
The bearish trend identification can then can be used to take an accurate sell entry. A sell entry should be taken when the price makes a low that is lower than the previous low. An ideal stop loss and take profit ratio in these settings is again 1:2.
Question# 4
Explain how the Zig Zag indicator is also used to understand support/resistance levels, by analyzing its different movements.(screenshot required)?
Support and resistance levels are very important for trend identification further help in taking the right entry and exits. These levels identify the key accumulation of buying and selling pressures. The reaction of the price line at these zones are off significant value in determining the right move.
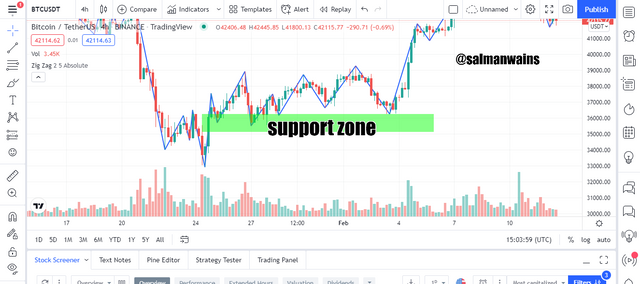
Support Zone
A strong support zone is marked by the zone of the market where the price shows numerous rejections before breaking it. In case of zig zag indicator, the zone where various swing lows have been formed is said to be a support zone. This indicates that the price has enough support from the buyers to take the trend back high.
For example in the screenshot below.
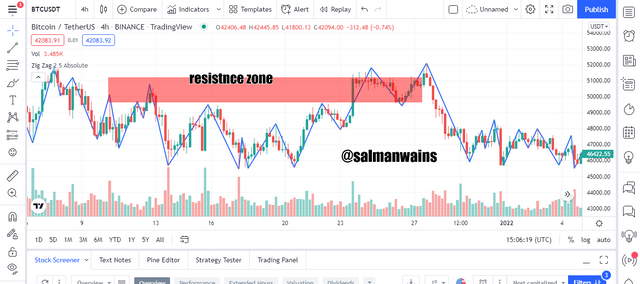
Resistance Zone
A strong resistance zone is marked by the zone of the market where the price shows numerous rejections before breaking it to go below it. In case of zig zag indicator, the zone where various swing highs have been formed is said to be a resistance zone. This indicates that the price has enough support from the sellers to take the trend back low.
For example, in the screenshot below.
Question# 5
How can we determine different points using Zig Zag and CCI indicators in Intraday Trading Strategy? Explain this based on a clear examples. (Screenshot required)?
We can combine Zig Zag indicator with a number of indicators and one of them is the CCI.
The CCI is an oscillatory indicator that tells the sentiment of the market in terms of being oversold and overbought. the range within which the CCI line oscillates has two extremes 100 units apart. If the line is above 100 it is considered an overbought condition and if it is below -100 it shows as an oversold condition.
When we combine these two indicators, we look for breakouts in the price line and Zig Zag and then compare it with the oscillating position of the CCI. In an intraday strategy we look for these signs mainly in the main trend.
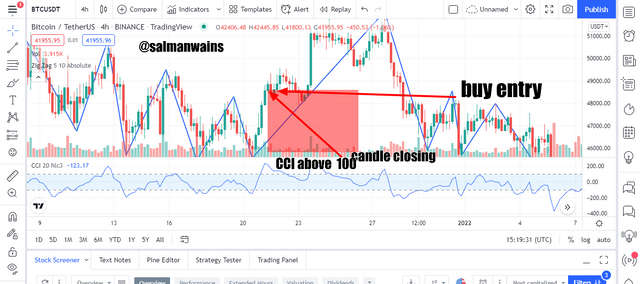
Uptrend
In a bullish trend, an intraday buying signal can be pinpointed if the current candle closes above the previous high and the CCI is also trading higher than the 100 mark. For this setup to work the stop loss should be placed directly close to the previous low for example as shown in the BTC/USDT chart below.
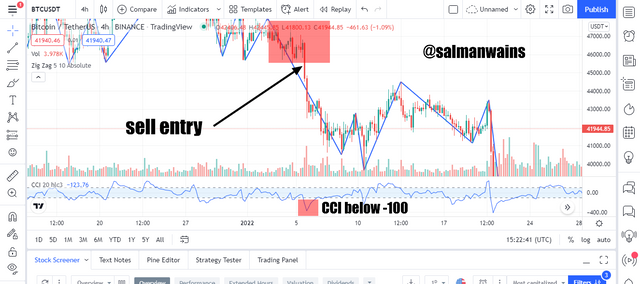
Downtrend
In a bearish trend, an intraday selling signal can be pinpointed if the current candle closes below the previous low and the CCI is also trading lower than the -100 mark. For this setup to work the stop loss should be placed directly close and above to the previous low for example as shown in the BTC/USDT chart below.
Question# 6
Is there a need to pair another indicator to make this indicator work better as a filter and help get rid of false signals? Give more than one example (indicator) to support your answer. (screenshot required)?
A trade setup consisting of two more indicators are often better than using a single indicator and same is true for the Zig Zag indicator. For example, the use of CCI helped us to further confirm the signals and take accurate entries. In addition to the CCI we can also add the Mas to further filter the signals of the Zig Zag indicator. Below I am using a combination of Zig Zag, CCI and a 20-period moving average to identify a correct trade signal.
Ideal trade setup
True sell signal in terms of all these three signals will be to make sure that the current trend is bullish and the price line should be trading above the moving average. After some time, it should cross the moving average to trade below it. At this moment the current candle should close below the previous low of the zig zag indicator and the CCI should be trading below the -100 mark.
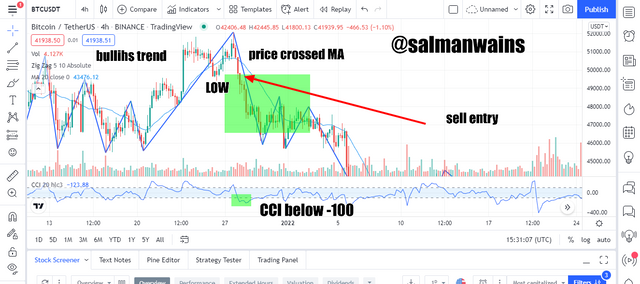
The benefit of using three simultaneous indicators is that even if one of the indicators is not providing an ideal trade setup you can rely on the combination of the other two. For example, in the screenshot above we can see that the Zig Zag previous low was too low based on the percentage depth and if we have waited for the price to go this much low to take an entry, we could have wasted a very goof profit opportunity. So, we relied on the CCI and MA.
Question# 7
List the advantages and disadvantages of the Zig Zag indicator?
Following are the advantages and disadvantages of using Zig Zag.
Advantages
- It helps in filtering random price fluctuations and focus on more reliable signals.
- it is simple to apply and understand.
- it helps in understanding support, resistance levels.
- helps in identifying the market direction and trend.
- it is visually very easy to comprehend.
Disadvantages
- using this indicator, you can only identify current trend.
- may not be of much use to the experience traders.
- it depends on the price movement and hence cannot be used alone to predict movement of the price in future.
Conclusion:
Zig Zag indicator is a very simplified indicator used for identifying the market direction and trend. It determines new swing highs and lows based on the market depth and percentage deviation. When used with other indicators it can form a reliable trade setup for day traders.
Note :
All the Screenshots have been taken from the tradingview.com platform.
CC:
@kouba01
Club100 Eligible