[Crypto Trading Strategy with Triple Exponential Moving Average (TEMA) Indicator] || Crypto Academy / S6W2 || Homework Post for @fredquantum || By @salmanwains
This is Season 6 Week 2 of Steemit Crypto Academy and I'm writing homework task about "Crypto Trading Strategy with Triple Exponential Moving Average (TEMA) Indicator" assigned by Professor @fredquantum
.jpeg)

Question# 1
What is your understanding of Triple Exponential Moving Average (TEMA)?
While many of us already know moving averages as the lagging group of indicators and the trend followers. Among them the most important are the simple moving averages and the Exponential Moving Averages.
The TEMA is the extension of the concept of the EMA. It stands for the Triple Exponential Moving Average and in fact is the modification of the EMA.
It covers the faults of the EMAs and help traders identify accurate support and resistance levels and understand the trend better. TEAM was developed by the Patrick Mulloy to cover to some extent the lagging nature of the EMA and to identify the trend strength in addition to the trend direction.
This is in fact a combination of three EMAs and thus is very sensitive to the price changes and detect even the slightest moves of the price action. Not only that the combination of three also prevent noise and false fluctuations making the whole setup very accurate.

Question# 2
How is TEMA calculated? Add TEMA to the crypto chart and explain its settings. (Screenshots required)?
As already discussed, TEMA joins three EMAs to behave as a single indicator. One interesting fact about the calculation of the TEMA is that it involves all basic operations multiplication, addition, and subtraction.
Calculation
It is calculated using the simple formula.
TEMA = (3 x EMA1) – (3 x EMA2) + EMA3
Where:
EMA1 = EMA
EMA2 = EMA × EMA1
EMA3 = EMA x EMA2
(The formula has been reproduced with the help of Investopedia)
Add TEMA to your chart:
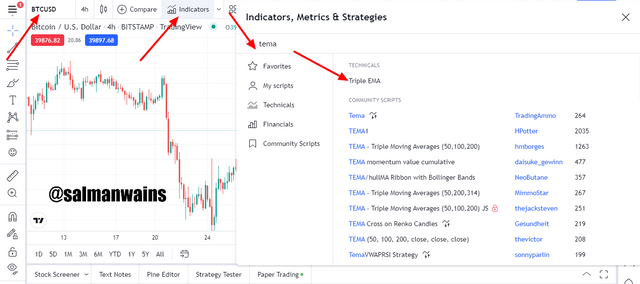
Go to tradingview.com
Select any chart and click on the indicator icon as shown.
Type TEMA and select it to add it in the chart (it will be added on one click)
To edit the setting click on the setting icon and change the settings in terms if style or input.
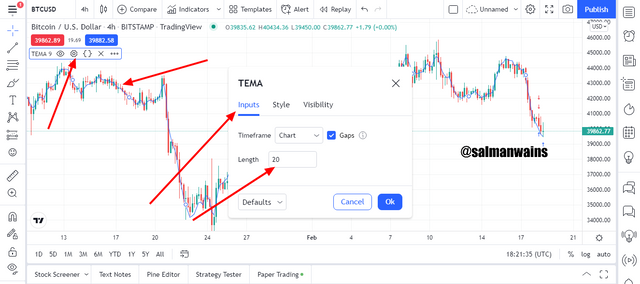
By default, the length of the TEMA is 9 but I changed it to 20 for my convenience.
I also changed the style to increase the width to make it more visible. Even after the changing the period we can see how close it is to the price action.
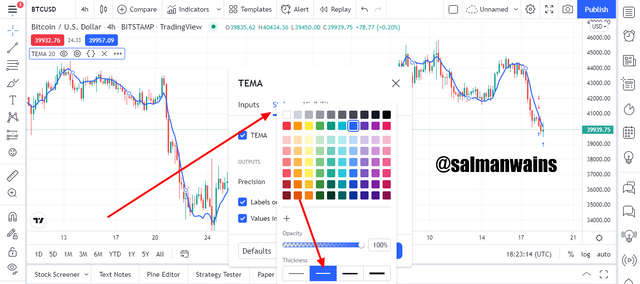
The TEMA has been successfully added and optimized.
Question# 3
Compare TEMA with other Moving Averages. You can use one or two Moving Averages for in-depth comparison with TEMA?
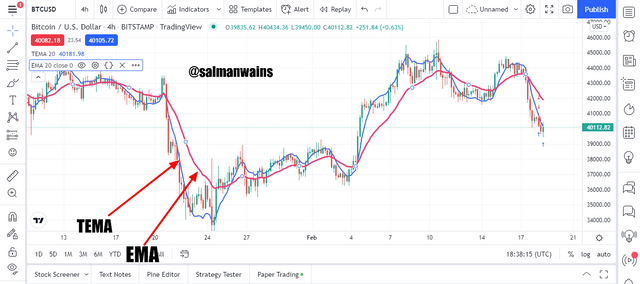
In this post I am comparing it with EMA since TEMA is itself the modification of the EMA it has both similarities and dissimilarities with it. For example, if add an EMA and TEMA of both 20 period we see the following.
Similarities
- They both act as a support when the move below the price indicating a bullish trend.
- They both act as dynamic resistance when move above the price indicating a bearish trend.
- They both need to be paired with some other indicators to provide better trade setups.
- The lagging factor is still present though less in TEMA.
Differences
- TEMA id often closer to the chart than the EMA even in the same period.
- You can use two TEMAs to get accurate signals on the same chart while you cannot do this with the EMAs.
- TEMA is more accurate, advance and less lagging than EMA.
Question# 4
Explain the Trend Identification/Confirmation in both bearish and bullish trends with TEMA (Use separate charts). Explain Support & Resistance with TEMA (On separate charts). (Screenshots required)?
Bullish Trend and Support
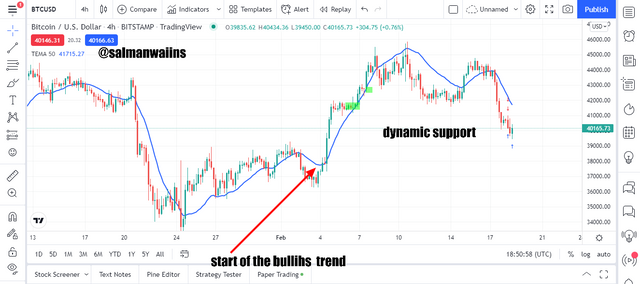
Very similar to the EMA when identifying the bullish trend with the TEMA we look at the position of the TEMA and the price action. In the bullish trend the TEMA moving in upward direction similar to the price action and yet the price action moves above the TEMA indicating a bullish trend.
The bullish trend begins when the price action crosses the TEMA to move above it as shown in the BTC/USDT chart below.
The TEMA during the bullish trend acts as a dynamic support and price rejects it several times to finally cross it during a very strong bearish reversal.
Bearish Trend and Support
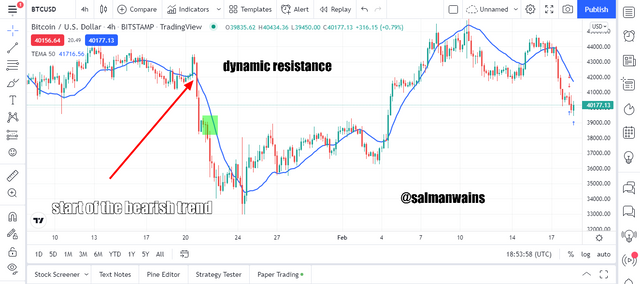
Very similar to the EMA when identifying the bearish trend with the TEMA we look at the position of the TEMA and the price action. In the bearish trend the TEMA moving in downward direction similar to the price action and yet the price action moves below the TEMA indicating a bearish trend.
The bearish trend begins when the price action crosses the TEMA to move below it as shown in the BTC/USDT chart below.
The TEMA during the bearish trend when it is below the price action acts as a dynamic resistance and price rejects it several times to finally cross it during a very strong bullish reversal.
Question# 5
Explain the combination of two TEMAs at different periods and several signals that can be extracted from it. Note: Use another period combination other than the one used in the lecture, explain your choice of the period. (Screenshots required)?
The purpose of two TEMAs is often to extract signals during the crossovers. Here I will be using the 50 and 100 TEMA. I chose 100 and 50 TEMAs because shorter averages stay glued to the price action and seeing the crossover patten become too difficult.
In addition to that they give false signals and even indicate non-potential signals. The longer periods on the contrary miss even the potential signals.
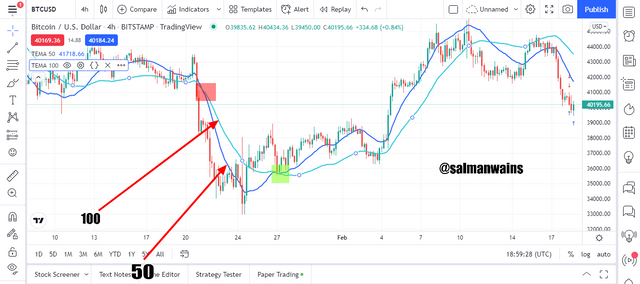
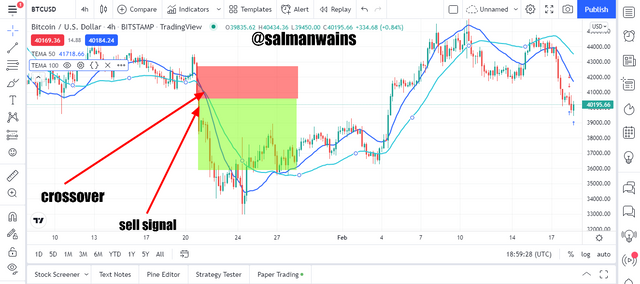
In the chart above you can see that in case of the bearish trend initiation the 100 TEMA which is the larger TEMA moved above the 50 TEMA which is the shorter TEMA. Or we can also say that when the shorter TEMA fell shorter than the longer TEMA then a bearish trend reversal occurred. This crossover gives an early sell signal.
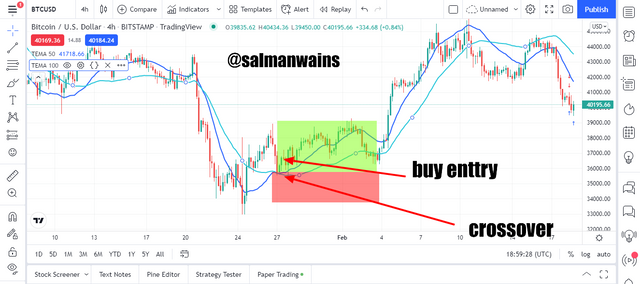
Contrary to that bullish trend initiation the 50 TEMA which is the shorter TEMA moved above the 100 TEMA which is the longer TEMA. Or we can also say that when the longer TEMA fell shorter than the shorter TEMA then a bullish trend reversal occurred. This crossover gives an early buy signal.
Question# 6
What are the Trade Entry and Exit criteria using TEMA? Explain with Charts. (Screenshots required)?
When taking the trade entries, it is often better to combine two TEMAs. The exit signals will be identified by placing accurate stop loss and take profit.
Buying signal
- The trade setup comprises of Two TEMAs of two different periods ( 50 and 100).
- Shorter TEMA crosses the longer TEMA or with higher period for a buy position.
- Wait for the formation of two bullish candles.
- Place the stoploss just below the crossover or near the last low.
- Risk/reward ratio can be around 1:2.
Selling Signal
- The trade setup comprises of Two TEMAs of two different periods ( 50 and 100).
- Longer TEMA crosses the shorter TEMA or with lesser period for a sell position.
- Wait for the formation of two bearish candles.
- Place the stoploss just above the crossover or near the last high.
- Risk/reward ratio can be around 1:2.
Question# 7
Use an indicator of choice in addition with crossovers between two TEMAs to place at least one demo trade and a real margin trade on an exchange (as little as $1 would do). Ideally, buy and sell positions (Apply proper trade management). Use only 5 - 15 mins time frame. (Screenshots required)?
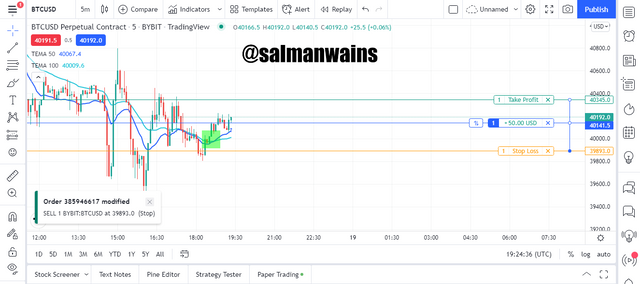
In this part of the post, I carried out a demo trade on BTC/USDT perpetual contract using my paper trading broker on tradingview.com.
Buying Trade
- The trade setup comprised of Two TEMAs of two different periods 50 and 100.
- The Shorter TEMA crossed the longer TEMA or with higher period.
- I Waited for the formation of two bullish candles to place the buy order finally.
- I Placed the stoploss just below the crossover.
- Risk/reward ratio was set around 1:1.
- The trade could be seen going into profit.
Question# 8
What are the advantages and disadvantages of TEMA?
Following are the pros and cons of TEMA
Pros
- You can use two TEMAs to get more accurate signals by identifying crossovers.
- It is more reliable and accurate than the SMAs.
- It is less lagging than EMAs.
- Clears the noise and random price fluctuations from the market.
- Can work along well with other indicators.
Cons
- Though less it is lagging and can give false signals.
- It is a bit risky to use it alone therefore you have to pair it with other indicators.
- When using two TEMAs a trader needs to be very active to locate crossovers.
Conclusion:
When it comes to reliability and accuracy TEMA is a modified version of EMA and in many ways superior to it. Since it combines the date of three EMAs. But like all other indicators it is not 100% accurate and strictly follows the trend and therefore you need to add another indicator in the chart with it. It can pinpoint support, resistance levels and can highlight early buying and selling entries. But can also trap traders in loss who are very hasty.
Note :
All the Screenshots have been taken from the tradingview.com platform.
CC:
@fredquantum
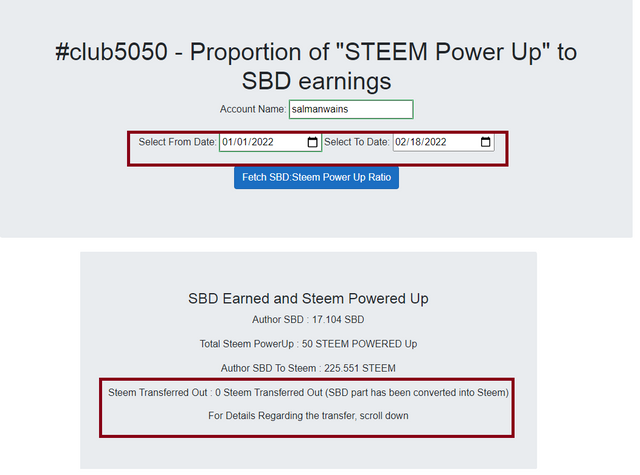
Club5050 Eligible