[Crypto Trading Strategy with Triangular Moving Average Indicator] || Crypto Academy / S6W4 || Homework Post for @fredquantum || By @salmanwains
This is Season 6 Week 4 of Steemit Crypto Academy and I'm writing homework task about "Crypto Trading Strategy with Triangular Moving Average Indicator" assigned by Professor @fredquantum .
.png)

Question# 1
What is your understanding of the TRIMA indicator?
It stands for Triangular Moving Average Indicator. The main purpose of using TRIMA is to identify the direction of the market. The indictor under consideration is the weighted moving average indicator therefore it helps in removing unnecessary fluctuations of the price action or in other terms cancels the noises and provides a more reliable and clearer picture of the current market.
It does so because of its particular calculations on which it is formulated. In addition to identifying the mean of the current period its calculation involves a stabilizing or multiplier to further provide a noiseless comparison for the price action.
It differs from TRMA, SMA or WMA in a way that the wight increments are added in a triangular fashion. From the first to the middle period of all the periods the volume of the weight increment increases linearly after that from the middle to the latest period the volume decreases linearly. It also involves the double smoothing mechanism as the values are averaged twice once during individual calculation and once during the formation of TRIMA.

Question# 2
Setup a crypto chart with TRIMA. How is the calculation of TRIMA done? Give an illustration. (Screenshots required)?
Go to tradingview.com and open the chart of any crypto asset.
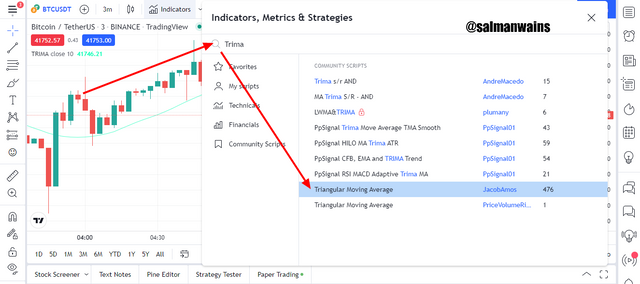
On the top bar click on indicators option and search TRIMA
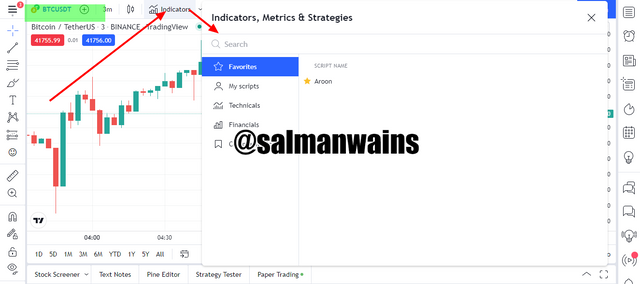
Click on the indicators and it will be added to the chart.
Calculations
For the calculation of TRIMA we first have to calculate SMA using the formula:
SMA = (P1 + P2 + P3 + P4 + P5+P6+P7... + Pn) / n
n = Number periods used in the calculation
Pn = Price of the highest or last period used in the calculation
P1= price of first period and so on
Using the above calculations, the TRIMA will be calculated using the formula.
TRIMA = (SMA1 +SMA2 + SMA3 + SMA4 +SMA5 + SMA6 +SMA7... +SMAn)/n
Where
SMAn= Smooth Moving Average of the last period.
n= total number of periods used in the calculation.
Question# 3
Identify uptrend and downtrend market conditions using TRIMA on separate charts?
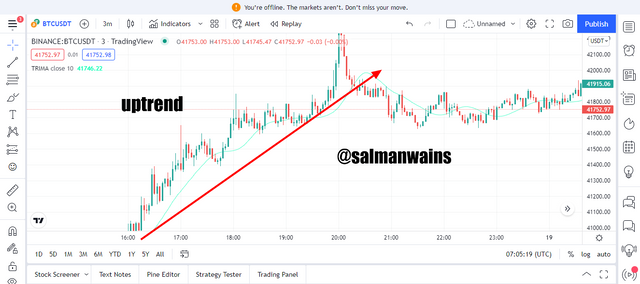
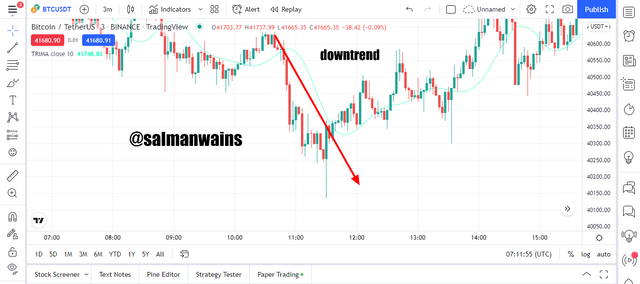
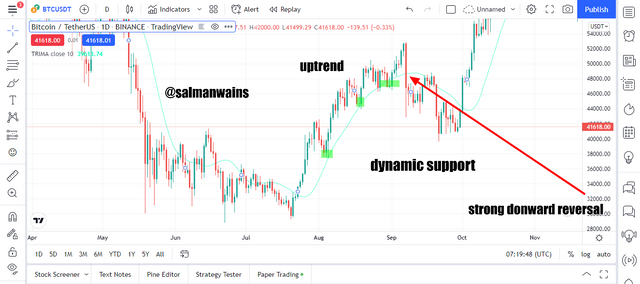
TRIMA provides a very easy setup to understand the uptrend and the downtrend because it works pretty similar to TEMA. the identification of the trend makes it easier for the investor and trader to trade since trend is the only friend when it comes to trading. Below in the BTC/USDT chart below we see the TRIMA indicating an uptrend. An uptrend is when the TRIMA is trading below the price action line. during this time its acts a dynamic support.
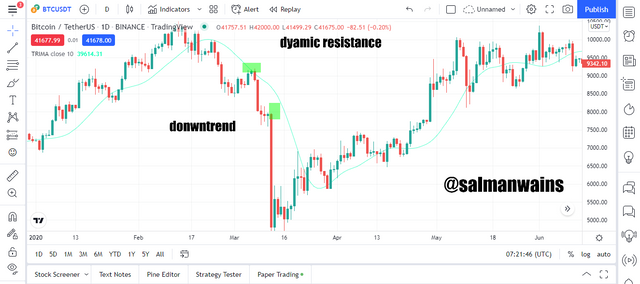
In the downtrend as shown in the BTC/USDT chart below the TRIMA line moves above the price action and acts as a dynamic resistance.
Question# 4
With your knowledge of dynamic support and resistance, show TRIMA acting like one. And show TRIMA movement in a consolidating market. (Screenshots required)?
As already told TRIMA works pretty similar to other moving averages so its acts as a dynamic support in an up-trending market. In the uptrend it moves below the price actions and price after touching it bounces back above unless it is a strong trend reversal to downtrend.
In a down trending market the TRIMA acts as a dynamic resistance. it travels along with the price but above it. In the down trending market, the price bounces back bellow every time it touches the TRIMA unless there is a strong uptrend reversal.
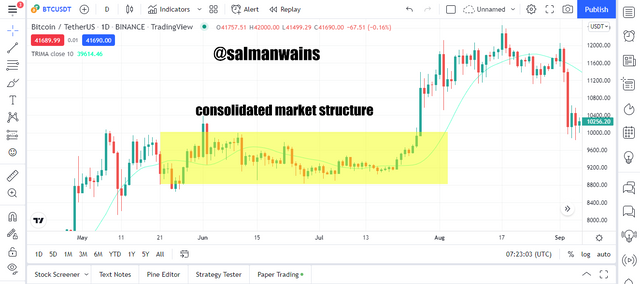
In a consolidating market the price action moves somewhat horizontally and, in this time, the TRIMA also moves like the price action as shown below in the BTC/USDT chart.
Question# 5
Combine two TRIMAs and indicate how to identify buy/sell positions through crossovers. Note: Use another period combination other than the one used in the lecture, explain your choice of the period. (Screenshots required)?
Buy Entry
In the BTC/USDT chart above we see a buy entry using the combination of two EMAs with different periods. A buy entry is generated when the shorter TRIMA goes below the higher TRIMA. In our case the shorter TRIMA is green and is of 10 periods in length and the longer TRIMA is blue and is of 12 periods in length.
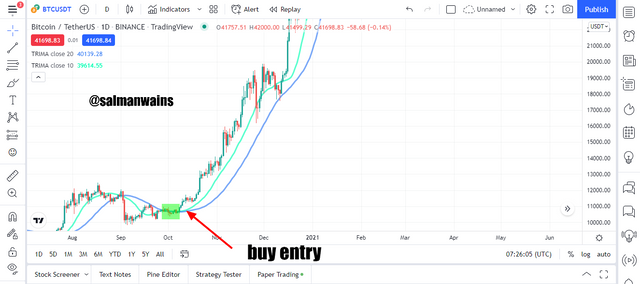
Choice
I chose 10 and 20 combinations because I want to trade keeping my indicator close to the price but not sticking to it. The 10 period serves me an ideal setting in addition to that the 20 period gives a clear understanding of the crossovers. It is not too far and not too close to the 10 period EMA. This is followed by an uptrend and so a buy position is viable.
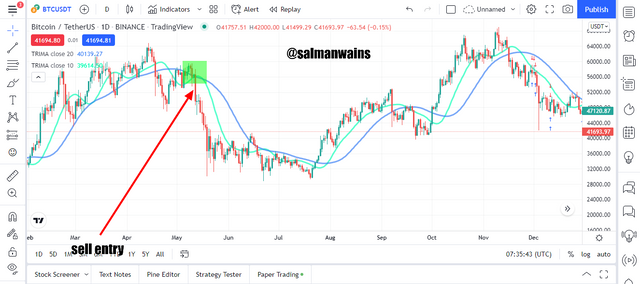
Sell Entry
A sell entry is generated when the shorter TRIMA goes above the higher TRIMA. In our case the shorter TRIMA is green and is of 10 periods in length and the longer TRIMA is blue and is of 12 periods in length. This crossover is followed by a downtrend and thus a sell position is viable.
Question# 6
What are the conditions that must be satisfied to trade reversals using TRIMA combining RSI? Show the chart analysis. What other momentum indicators can be used to confirm TRIMA crossovers? Show examples on the chart. (Screenshots required)?
TRIMA is predominantly a trend indicator and thus pairing it along with a momentum-based indicator such as the RSI often proves fruitful in taking accurate signals.
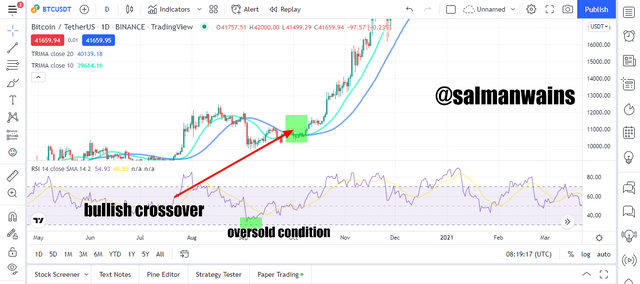
Bullish Reversal
- Use TRIMA of Two different periods, also add RSI to the chart.
- Make sure the market is down trending currently.
- The RSI should be trading below or reaching the oversold condition.
- TRIMA with the shorter period should cross below the TRIMA with the longer period.
- Take profit should be placed above the crossover and stop loss should be placed below the crossover or risk reward ratio can be set around 1:1, 1:2 or 1:3.
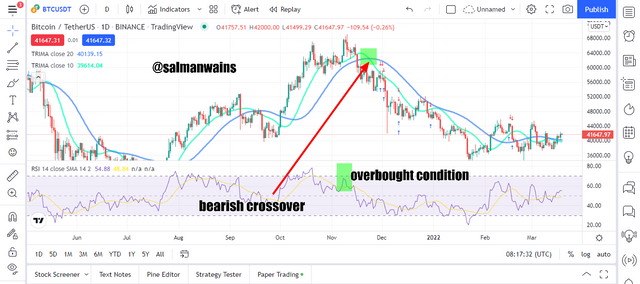
Bearish Reversal
- Use TRIMA of two different periods, also add RSI to the chart
- Make sure the market is up trending currently
- The RSI should be trading above or reaching the overbought condition
- TRIMA with the shorter period should cross above the TRIMA with the longer period
- Take profit should be placed below the crossover and stop loss should be placed above the crossover or risk reward ratio can be set around 1:1, 1:2 or 1:3.
Question# 7
Place a Demo and Real trade using the TRIMA reversal trading strategy (combine RSI). Ideally, bullish and bearish reversals. Utilize lower time frames with proper risk management. (Screenshots required)?
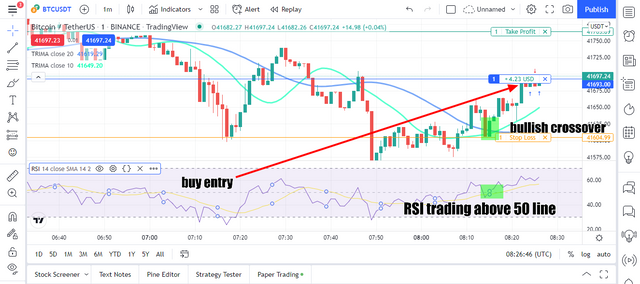
I saw a bullish crossover and the RSI was trading above the 50 line. I waited until I made sure that the price was trading higher and higher. I placed the stoploss and take profit in 1:1 ratio and executed the buy order. Following is the screenshot of my trade on the BTC/USDT pair in the time frame 1min.
Question# 8
What are the advantages and disadvantages of TRIMA Indicator?
Advantages
- Cancels the noise and smoothens the signals
- It is easy to understand and apply
- Combinations od two TRIMAs can be used for more accurate trade setup and to identify buying and selling entries
- can be used to identify dynamic support and resistance levels
Disadvantages
- it is a lagging indicator and thus gives late signals
- like many other signals can give false signals and thus be paired with other indicators
Conclusion:
TRIMA is a lagging yet reliable trade signal. It produces late signals but these signals are produced once the trend is confirmed. It cancels out the noise from the market and allows the trader to take clear trading actions. It can be paired with momentum indicators for better accuracy.
Note :
All the Screenshots have been taken from the tradingview.com platform.
CC:
@fredquantum
Club5050 Eligible