Crypto Academy / Season 4 / Week 3 / Intermediate- Homework Post for Professor @allbert: Trading with Contractile Diagonals by @salma78

Introduction
Quetion 1
Define in your own words what a contractile diagonal is and why it is important to study it. Explain what happens in the market for this chart pattern to occur. (screenshot required / Bitcoin not allowed)
What is Contractile Diagonal?
The Contractile Diagonal is a price trend reversal phenomenon that takes place in the crypto market charts of assets whereby the price movement of the asset reduces and converges at a point nearer before it reverses in the opposite direction. In simply put, I would define contractile diagonal as a price trend that is identified by the converging of the diagonal lines used in technical analysis of the asset in order to predict the price trend reversal of the asset.
It must be noted that before a good setup would be considered of a contractile diagonal unless it satisfies certain criteria which we would discuss below here in the subsequent question. The convergence of the price of the asset that occurs shows the reduction in the regulation or the control of the price of the asset by either only buyers or only sellers. This is as a result of the continuous reductions of buying or selling pressure before a complete shift of sentiment takes place in the market. When the price of the asset continues to compress then there is an indication of an early trend reversal of the asset.
This contractile diagonal is made of two lines that are drawn diagonally in a way that one line is seen converging. The contractile diagonal is just similar to the idea or concept of the Elliott wave in which the price formation of an asset is indicated by waves 1,2,3,4,5. The wave points numbered 1,3, and 5 determine impulsive moves or trend of the asset which is in line with the current trend whilst the wave points 2, and 4 represents the corrective moves or the pullbacks of the asset which tend to move in the opposite direction.
With the formation of a bullish trend, contractile diagonal waves are formed in a way that points 1,3, and 5 are the impulsive trends (bullish trend) whilst point 1 extends much more than point 3, and point 3 also extends more than point 5. In the same way, wave points 2, and 4 are the corrective moves (bearish trend) of the asset with point 2 extending much more than point 4. When this happens, it forms compression in the price of the asset whereby each bullish wave decreases or diminishes before a bearish breakout takes place below the lower diagonal line of the asset's price.
Similarly, with the formation of a bearish trend, contractile diagonal waves are formed in a way that points 1,3, and 5 are the impulsive trends (bearish trend) whilst point 1 extends much more than point 3, and point 3 also extends more than point 5. In the same way, wave points 2, and 4 are the corrective moves (bullish trend) of the asset with point 2 extending much more than point 4. When this happens, it forms compression in the price of the asset whereby each bearish wave decreases or diminishes before a bullish breakout takes place below the upper diagonal line of the asset's price.
The Operability of Contractile Diagonal
Operability of contractile diagonal is termed as the pre-determined criteria in which the contractile diagonal price of an asset must follow or satisfy in its formation. These criteria must be obeyed or satisfied before the price formation can be considered or taken as a valid contractile diagonal. It should be noted that a contractile diagonal can sometimes also reverse the trend without the satisfaction of the criteria required. Now, let's discuss the criteria below here.
The following are the criteria for the validity of a contractile diagonal formation:
The wave points 1,3, and 5 must be impulsive waves, and points 2, and 4 must be corrective waves.
Point 1 must be extended more than point 3
Point 3 must be extended more than point 5
Point 2 must be extended more than point 4
The diagonal line of points 1,3, and 5 must be converging with the diagonal line of points 2, and 4.
Tracing point 1 to point 3 must be joining and also point 2 and point 4 must join when traced.
The Operable Contractile Diagonal line
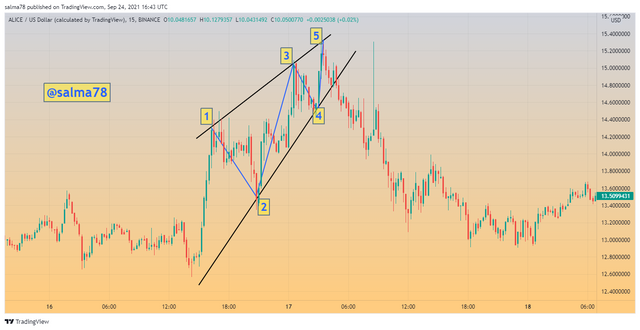
Operable contractile diagonal refers to the price formation of an asset that satisfies all the above-mentioned criteria. The chart below indicates the formation of operable contractile diagonal.
We can see from the chart above that all the above-mentioned criteria can be found in the chart. We can see that point 1 is more extended than point 3, whilst point 3 is also more extended than point 5. Similarly, it can be observed that point 2 is also more extended than point 4.
Also, it can be observed that the diagonal line trace between the two points (point 1 and point 3) is accurately joined together whilst the trace between the two points (point 2 and point 4) is also accurately joined. Again, points 1,3, and 5 are converging with points 2, and 4 in an upward direction which indicates the compression of the price formation of an asset. This compressing formation of the price of the asset shows that there is a decrease in the strength of the buyers of the asset in the market.
The Non-Operable Contractile Diagonal line
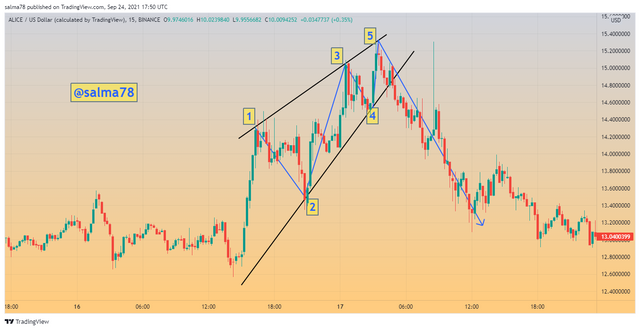
Non-operable contractile diagonal on the contrary refers to the price formation that doesn't satisfy or obeys all the above-mentioned criteria. I would indicate an example below here in the chart below.
From the chart shown above, we clearly see that point 3 is much more extended than point 1, and similarly, point 5 is also extended than point 3 which violates criteria numbered 2 and 3 above.
Also, the diagonal line of points 1,3, and 5 are not converging with the diagonal line of points 2, and 4 as we can clearly see. This is what is termed as a non-operable contractile diagonal since all the criteria mentioned above are not met.
Question 3
Through your Verified exchange account, perform one REAL buy operation (15 USD minimum), through the Contractile Diagonal method. Explain the process and demonstrate the results and graphical analysis through screenshots. Your purchase data must match your analysis data: such as cryptocurrency and entry price.
Placing Buy Order for CRV/USDT
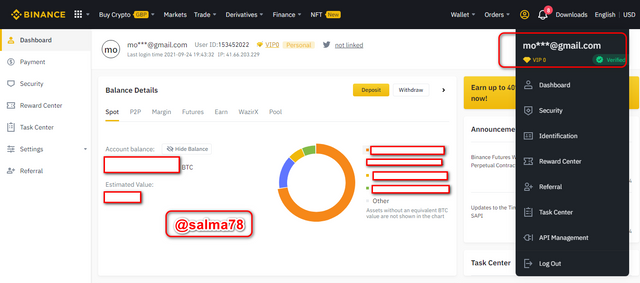
The above screenshot indicates my verified Binance account which I would be trading with for the purpose of this assignment.
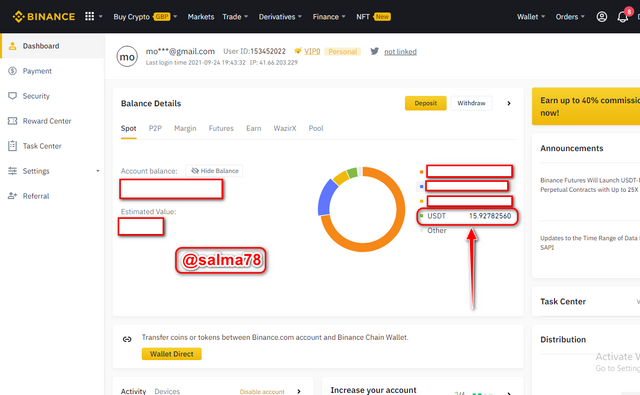
I have deposited $15.92782560 USDT into my account which I would be using for the trade. This can be shown from the screenshot taken above.
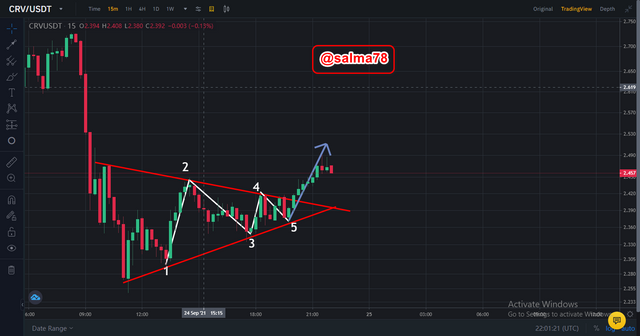
- From the screenshot above a contractile diagonal is formed and identified which tends to be moving in the bullish trend. I drew the diagonal lines and numbered my wave patterns as 1,2,3,4, and 5 respectively. The contractile diagonal is operable and this is because it satisfies the criteria which were mentioned above in question 2. We can see that wave point 1 is extended more than point 3 and point 3 is also extended more than point 5. Similarly, it can be noted again from the chart that wave point 2 is also extended more than point 4. Moreover, we saw that after drawing the two diagonal lines they converged at a point and this indicates a valid contractile diagonal of price formation of the asset.
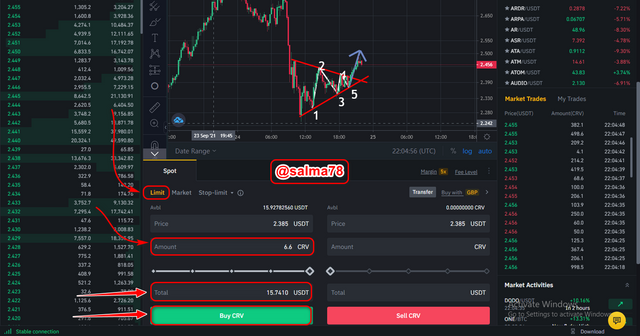
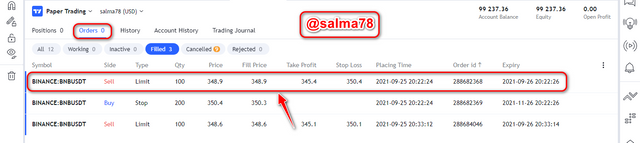
There was a trend reversal in the bullish direction for which I then placed a buy order of 15.7410 USDT for CRV at a price of 6.6 CRV. Below is the trade history which shows the trade I performed.
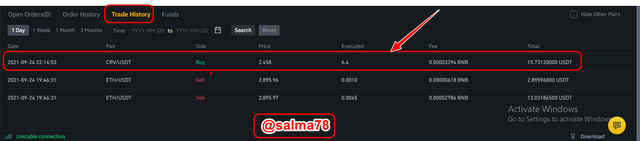
An amount of 6.4 CRV was purchased at a price of 2.458 just as indicated in the order history.
Question 4
Through a DEMO account, perform one sell operation through the Contractile Diagonal method. Explain the process and demonstrate the results and graphical analysis through screenshots. Bitcoin is not allowed.
Placing Sell Order for BNB/USDT
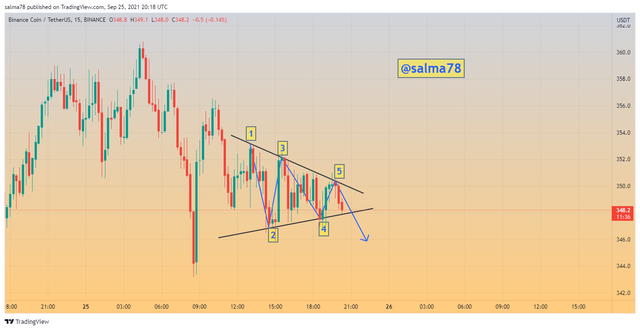
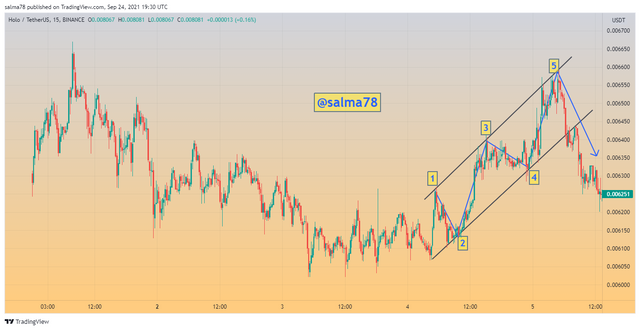
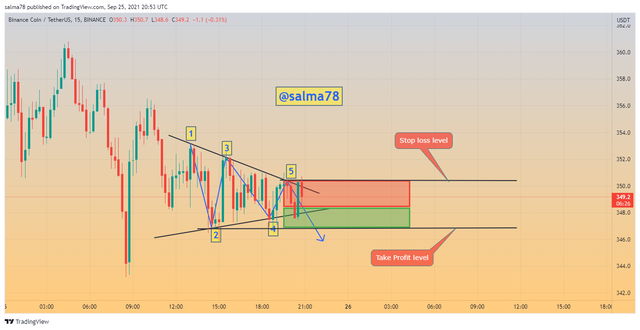
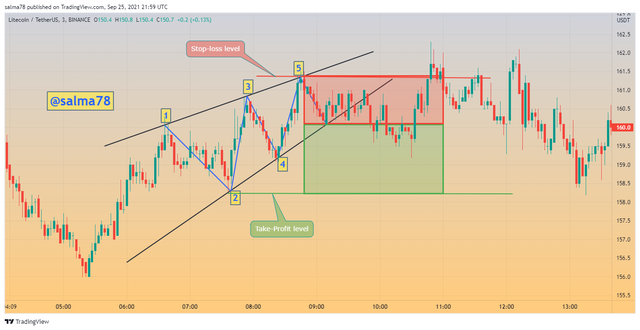
From the BNBUSDT Chart above we can clearly see the formation of a contractile diagonal on the chart. The two diagonal lines were drawn as indicated and numbered as 1,2,3,4, and 5. We can also see that the contractile diagonal formed above is operable meaning it satisfies the criteria of a contractile diagonal formation. A trend reversal which was expected from the chart was observed and immediately after the breakout of the trend in the opposite direction, a sell order was executed where the stop-loss was set at line 5 and also take-profit was set slightly above point 2 as shown below.
We see that point 1 is more extended than point 3 and similarly point 3 is extended more than point 5. Similarly, point 2 is more extended than point 4. Again, the diagonal lines when traced are converging at a point and these observations proofs the operability of the contractile diagonal.
Question 5
Question 5: Explain and develop why not all contractile diagonals are operative from a practical point of view. (screenshot required / Bitcoin not allowed)
Why not all contractile diagonals are operative from a practical point of view
Having a trading plan on how to avoid losses during trades is one of the most important factors a trader must consider i.e. traders must know how to manage risk in trading. Contractile diagonal has the target or aim of plotting a good structure so as to increase the chance of making more profits in trades. Contractile diagonal price formation is one that meets or satisfies all the criteria but they are all not operative and this is as a result of the adverse risk to reward ratio that they produce.
Contractile diagonal does not follow the normal 1:1 risk to reward ratio as we see in other trading strategies where stop-loss and take-profit are set at 1:1 R/R ratio but rather the stop-loss and take-profit of the contractile diagonal is placed at strategic points as we saw in question 4. Not all contractile diagonal patterns are operative because some produce an adverse risk/reward ratio. In a contractile diagonal pattern, the stop-loss is usually placed below point 5 whilst the take-profit is placed slightly above point 2 wave.
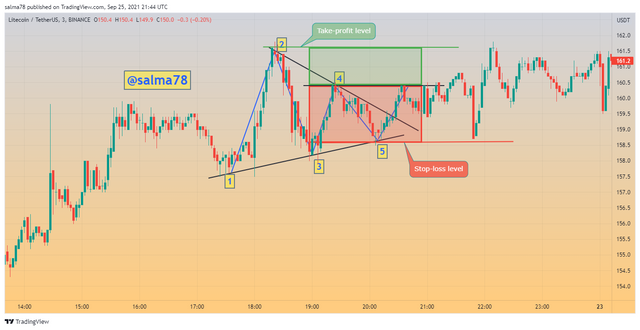
From the above screenshot taken, it can be observed that the criteria for the price formation of a contractile diagonal are all satisfied but it is still not operative and this is because the stop-loss is greater than the take-profit level as shown above. As a result, creating an adverse risk to reward ratio as indicated.
The above screenshot indicates an operative contractile diagonal since the take-profit is much higher than the stop-loss.
Conclusion
To conclude with I would like to summarize what we have done so far in this article. First of all, we looked at the concept of the contractile diagonal, its importance, and also how they occur in the market using crypto charts. We further went on to illustrate an example of the operability of a contractile diagonal using a crypto chart and also a contractile diagonal that does satisfy the criteria required.
Moreover, we discussed the process of making a real transaction for a buy order using the contractile diagonal strategy. I bought CRV worth of 15USD using USDT currency from my verified Binance account. I further performed a sell operation using the contractile diagonal strategy again whereby I indicated the processes and analysis involved in all stages or processes.
Finally, we looked at the reason why not all contractile diagonals are operative by practically demonstrating the reason.
I would like to say thank you to professor @allbert for such a wonderful lecture taught this week and I look forward to participating in your subsequent homework tasks.
To the attention of professor @allbert and @reddileep
Thank You.
Hello, @ Thank you for participating in Steemit Crypto Academy season 4 week 3.
Yes of course it really delayed my presentation of this assignment but all being the same I am happy to have understood and performed this task. Thanks for your kind review.🤗