Crypto Academy / Season 3 / Week 8 / Homework Post For Professor @yohan2on y @salma78


Question 1
Define the following Trading terminologies:
Buy stop
Sell stop
Buy limit
Sell limit
Trailing stop loss
Margin call
(I will also expect an illustration for each of the first 4 terminologies listed above in addition to your explanation)
The Buy Stop refers to to the kind of order which when placed, the trade would be executed only when the price of the asset increases above a level that is more than its current price level. This means that this type of order is placed to buy an asset above its current price level. The Buy Stop order is mostly used by traders in order to join a bullish trade or a buy trade especially when traders spot the price of the asset moving above the current level. Traders do not just go in for a buy stop order but they do analysis to find but the continuation of the bullish trend above that level.
Moreover, before the buy stop order would be executed unless the price of the asset increases above the level of the trader or the current price level. The buy stop order is mostly used by traders that do not have ample time to monitor the price trend of the asset in order to place a buy trade. I would illustrate a good example below here in this article.
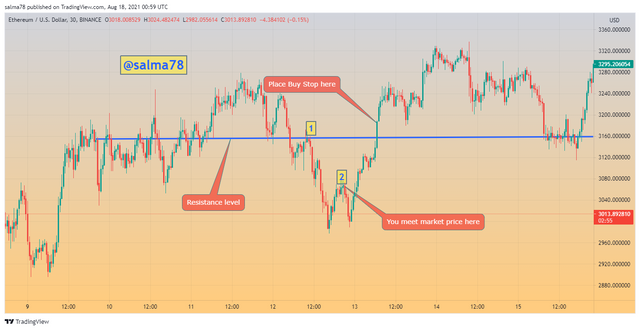
From the chart shown above, we can clearly see that we met the market at the point which is indicated with number 2, if a trader wishes to buy the asset then he/she waits until the price breaks the resistance level. Traders then tend to open or execute a buy stop order so as to keep them in trade when the price breaks the resistance level.
Unlike the buy stop whereby the order is placed above the current price level of the asset, sell stop is a kind of order that is placed below the current price level of the asset. In this type of order, the order is executed in the future. Traders mark a support level and immediately the price of the asset crosses below the support level marked, they place the sell stop order at that point. Traders mostly do place this type of order in order to join the bearish trend of the asset. I would illustrate this in the following chart below.
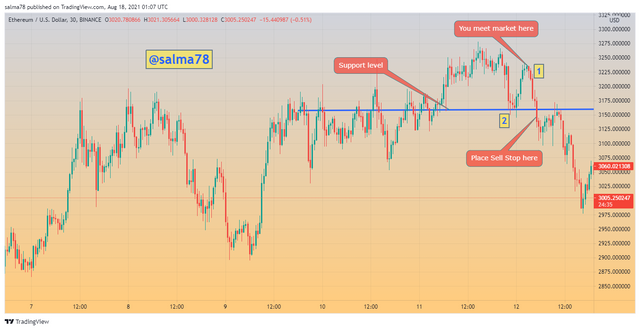
From the chart shown above, when a trader meets the market at the marked level (1) and wishes to sell the asse when the price breaks the support level then the trader can place a sell stop order just below the support level as indicated above.
The Buy limit is a kind of order that a trader places below the price of the asset aiming to buy the asset at a discount price thus buying the asset at a cheaper price. Buy limit order is mostly used by traders in order to maximize their profits and minimize their losses as well. This means that when a trader wants an asset at a price of say $100, the trader waits for the price of the asset to fall to say $50 so he/she can purchase double the quantity of the asset he/she would have gotten if he was to buy at the current price. I would illustrate this in the following chart below.
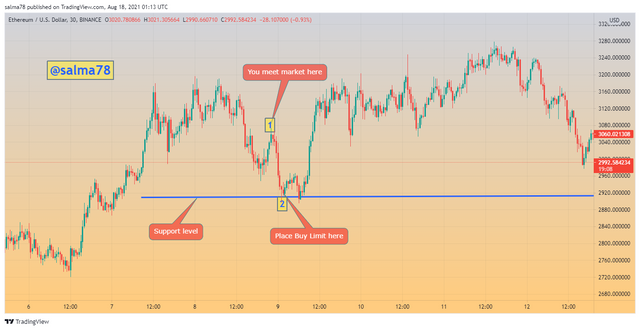
From the chart indicated above, when a trader meets the market at point 1 and then makes his analyisi and realize that the when the prize hit the support level indicated a trend reversal shall occur then a Buy Limit order is executed.
The sell limit order is the kind of order in which a trader places above the price of the asset aiming to sell an asset at a price higher than current price so as to maximize profits. This order is usually set for the future. A good example is let's say a table which cost $100 currently, but the seller tends to sell that asset at a price of $150. This means that the seller would have to wait for the price of the asset to reach $150 then the asset would be sold out. I would illustrate an example from the following chart below.
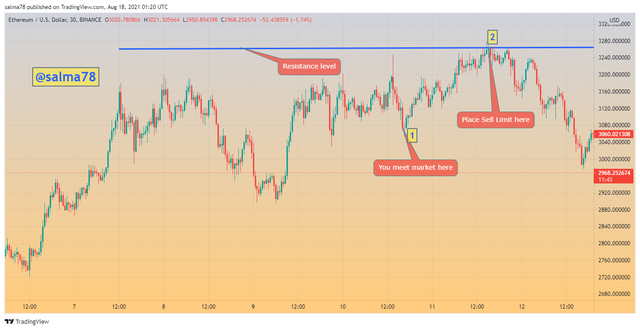
Similarly, from the chart indicated above when a trader meets the market at the point marked 1 and realize from his analysis that the there would e a trend reversal of price at the resistance level indicated then a sell limit order would be executed by the trader so as to maximize profits.
When the price of an asset either rises above or falls below a particular point of the buy level then a strategic technique is utilized in order to adjust the stop loss of the asset so as to lock profits earned and avoid any loss when there is any trend reversal of price in the trade. Usually, traders do use the trailing stop-loss strategy to protect and guide their trade. I would illustrate a typical example of how trailing stop loss strategy is used from the chart below.
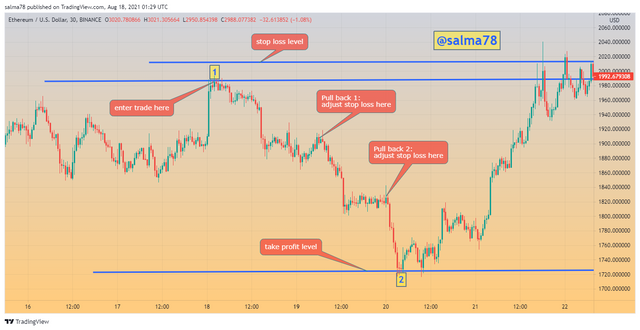
From the chart shown above, we can clearly see that te trader entered the trade at the point marked 1 and the stop loss set just above the entry level. We see that the price of the asset falls to a certain point and then creates a pull back the lower high point. we then adjust the stop loss level to that point. The price again falls and then create another lower high which corresponds to the previous high point. Another price pull back occurs then the stop loss is adjusted to that level. This continues subsequently until the take profit set is reached and executed.
Usually in trading, traders do pay a cetrain amount of money to brokers which serves as equity to allow him/her to partake in the trade. The amount of money deposited by the trader is what the brokers use as an opportunity to offer him/her a margin. A margin refers to the minimum amount of capital a trader is required in order to place a trade. When an account is spotted with no free margin to execute a trade, then a margin call is then executed. This means that when one's margin level goes below the threshold level, then this margin is then executed in order to alert the trader so he/she can make more deposits in order to partake in a trade.
For example; supposed an investor or a trader purchase a vehicle at $10,000 using $5,000 of his/her own capital then borrows the remaining $5,000 from the broker. Let's say a maintenance margin of the investor's broker is 25% then we would calculate for the investor's equity in terms of percentage using the following formula.
Investor's Equity As Percentage = (Market Value of Securities – Borrowed Funds) / Market Value of Securities.
From the example given;
Investor's Equity As Percentage = ($10,000 - $5,000)/$10,000 = 50%
This implies the investor's equity as a percentage was 50% at the time of buying the vehicle. In case the value of the vehicle decreases in 3 or 4 weeks later to $6,000 then the investor's equity would also fall to $1,000. i.e. (market value - borrowed money) = ($6,000 - $ 5,000)/$6,000 = $1,000.
This amount in percentage would be 16.67%. Now we can see the equity level below the maintenance margin of the broker and when this hapens, the broker executes a margin call which request the trader/investor to deposit at least $5,00 in order to meet the maintenanance margin. This minimum amount needed to meet the maintenance margin is calculated using the formula below;
Amount to Meet Minimum Maintenance Margin= (Market Value of Securities x Maintenance Margin) – Investor's Equity.
This implies that; Amount to Meet Minimum Maintenance Margin= ($6,000 x 0.25) - ($1,000) = $5,00
Question 2
Practically demonstrate your understanding of Risk management in Trading.
- Briefly talk about Risk management
[Be creative (I will expect some illustrations]- Use a Moving averages trading strategy on any of the crypto trading charts to demonstrate your understanding of Risk management. (screenshots needed)
Risk management is defined as the strategic method used by a trader in protecting and managing his/her account so as to avoid losses and maximize profits. There are so many risks involved in trading and such traders have to find ways in order to minize these risks as low as they can. The following process involved how to manage risk in trading:
Setting a trading Plan
One of the most important steps a trader should take first is to set a trading plan. A trader should first of all make a concrete plans for his/her trade and should be followed as well. A trader must first of all analyze the kind of assets he/she wants to trade and after that, the trader should also diversify his/her trades and shouldn't invest all his capital into one asset.
Furthermore, traders should also set up a portfolio where all their trading assets are being added and monitored strictly in order to avoid loss and gain more profits. Also, traders should also set up a watchlist so as to keep an eye on his trading assets easily without searching through a whole lot of assets before identifying the assets he/she owns. Traders should also identify the kind of trader he/she is good at and then know where to strengthen his trading strategy.Know when to risk and when not to
Although the risk is something very we must avoid in trading but at a certain point in time, we must incur risks sometimes. A trader must know that the amount of money deposited to the broker is a risk and shouldn't invest all his live savings capital into trading. A trader must also put in mind that the money or capital invested in trading wouldn't only bring out profits but also losses as well. A trader will know how to manage risks involved in trading if and only he is aware of gaining profits and also making losses as well.
It should also be in the mindset of every trader the amount of loss he/she can incur during trading. For instance when one deposited an amount of $2,000 in his trading account and decides to risk a percentage of 3% of the total amount. Then this means that the amount set at risk would be 3/100 x $2,000 which would be $40. This implies that the trader would lose an amount of $40 for each trade that he losses. This implies that the trader can trade for 50 times with the $2000 and it's impossible to lose all 50 trades without a win. With this, it is good that a trader sets a limited number of trades to be executed within a day and must comply with it no matter the situation.Set Stop Loss and Take Profit points
Stop loss and take profits as we have learned from other lessons in the advanced course is one of the ways to manage risk and avoid losses and maximize profits as well. The stop loss helps traders to avoid or minimize losses especially during incidents when trading is against the trader. Also setting take profit allows traders to exit a trade with profits made without any loss.Have time in managing your trade
Traders or investors should not just open positions for trades and then relax on it ut rather they should set time and monitor their trades to see the smooth running of the trade.
I would be illustrating this using the Meta Trader 5 app (MT5) application.
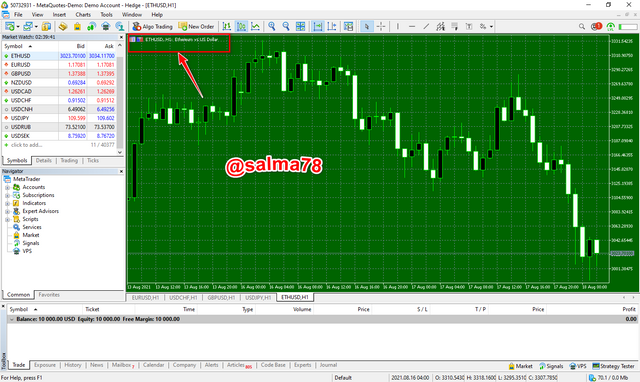
First of all I click and open the MT5 application and then get connected.
Click and select the trading pair which I would be using the ETHUSD Pair so I search and select the ETHUSD pair.
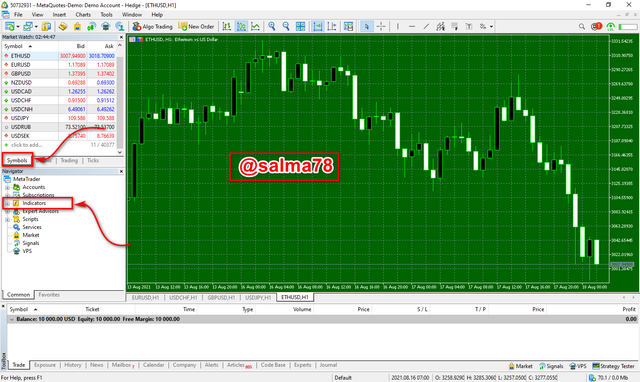
- After successfully added the ETHUSD pair, I would then on Indicators from the Symbols tab.
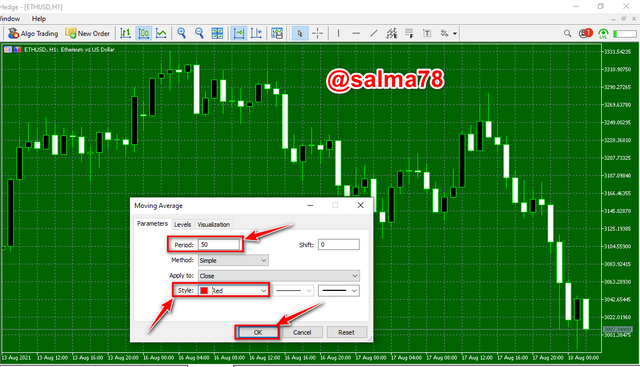
- Click on Trend and then select and click on Moving Average indicator.
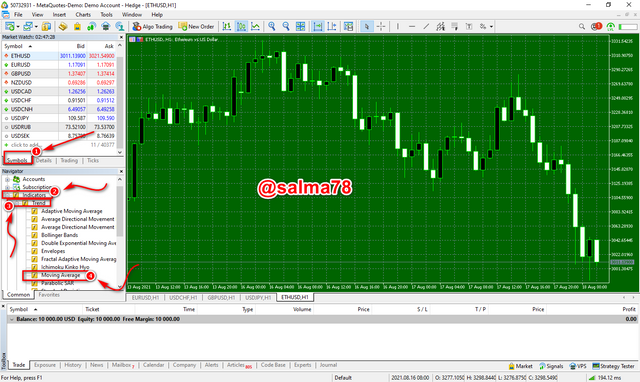
- Set the indicator settings and I would be using two periods that is 50 periods and 100 periods simultaneously.
- Follow the above process and add the 100 Periods to the chart.
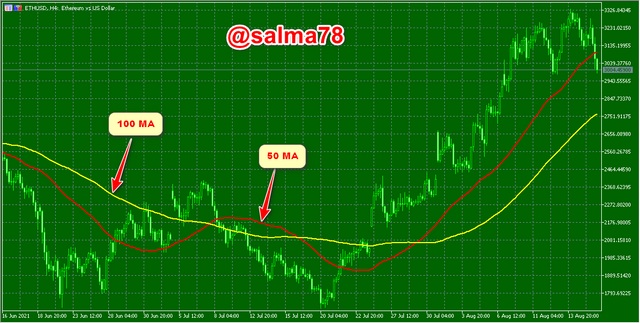
- After successfully added the two periods, we going to use this demonstrate the understanding of how to manage risk in trading.
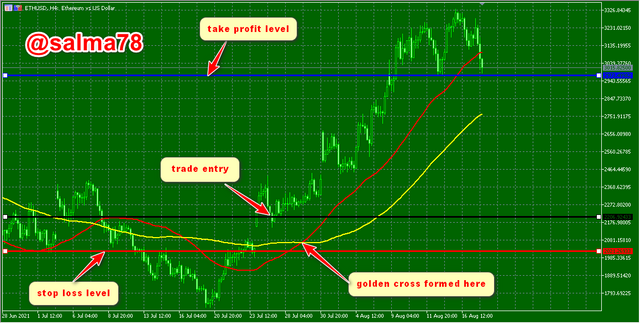
When an asset remain in a long period of downtrend, it reaches a time where there would be trend reversal and this is indicated by the Moving Average when the two periods crosses each other. The cross that happens here is called the golden cross. A buy trade is executed immediately the golden cross is formed. The stop loss is also set below the golden cross so that in case when the price falls below the cross the buy trade would not be valid and take profit would be implemented just below the resistance level.
Frome the above ETHUSD Chart shown a buy trade is executed after the golden cross was formed at a price of $2,206.9 and stop loss was also set at a price level of $2,021.27 then take profit at ****.
To calculate the risk involved in this trade executed, we would be using;
Risk = Entry Price of asset - Stop Loss Price of asset
Risk = $2,206,90 - $2,021.27 = $185.63 which is approximately $186.
This implies that the risk is equal to 186 pips.
Also the reward involved in this trade is calculated as follows;
Reward = Take Profit level - Entry price level
Reward = $2,973.50 - $2,206,90 = $766.6 which is approximately to $767
This implies that in this trade, I would be risking 186 pips in order to earn 767 pips.
Let's look at the risk to reward ratio.
Risk/Reward
186/767 which is 1: 4.12 and approximately = 1:4
This indicates that a risk of 1 is used to earn 4 reward. This indicates some of the benefits of setting a stop loss and take profit levels in trading. As we already know this aids to minimize losses and maximize profits as indicated.
To conclude with I would like to give a summary of what we have done so far in this article. First of all we looked at some of the terminologies of trading including Buy stop, Sell stop, Buy limit, Sell limit, Trailing stop loss, and margin call as well. We also demonstrated with examples on crypto charts on how to place these orders and the reasons why traders utilize these orders.
We also practically demonstrated the understanding of risk management to a layman term including setting an example. Furthermore, we looked at how to set moving average on charts of assets and also used that ti explain the concept of risk management.
Risk management in trading is one of the most vital part of trading in which traders must put much efforts to in order to avoid losses and maximize profits.
I would like to say thank you to professor @yohan2on for such a wonderful lecture taught this week and I look forward to participating in your subsequent homework tasks.
Thank You.
Hi @salma78
Thanks for participating in the Steemit Crypto Academy
Feedback
This is good content. Well done with your practical study on Risk management.
Thanks professor for your kind remarks.🤗