Crypto Academy / Season 3 / Week 7 / [@Homework Post for @yousafharoonkhan] / Trading View by @salma78

Question No 1:
Defining the TradingView site and how to register an account in tradingView? what are the different registration plans? (screenshot necessary)
Defining the TradingView Site
TradingView site is a platform that comprises information regarding the current and previous data of the market. The TradingView platform enables traders to earn more profits through its exploration and use. It also helps traders to capitalize their income by providing them with detailed information which aids in guiding them during trading. The TradingView platform also aids traders in determining when to go for a buy trade and when to go for a sell trade by proving traders with indicators that help them in determining all these.
This TradingView platform provides users with a couple of features that make their platform user-friendly to its user. I would touch on a few and later provide detailed information on these features in the next question. Some of these features include; Trade which provides the platform for users to buy and sell assets on its platform. Also, the Chart feature helps traders to know how the trend movement of an asset is in, whether it's in an uptrend or a downtrend. This chart feature again helps traders in predicting the future movement of an asset by adding indicators from the tools provided in the chart menu.
The TradingView platform also provides accurate and precise predictions of cryptocurrencies with the aid of the Screener feature. The TradingView also serves as a platform that provides users with detailed and latest news on crypto experts. The TradingView platform also provides a feature that allows users to easily have access to their assets without any difficulty. It also provides the platform for users to get access to other market options including, Forex trade, Stock markets, and the Gold market as well.
Now let's take a look at how to register an account in tradingview.
How to Register an account in TradingView?
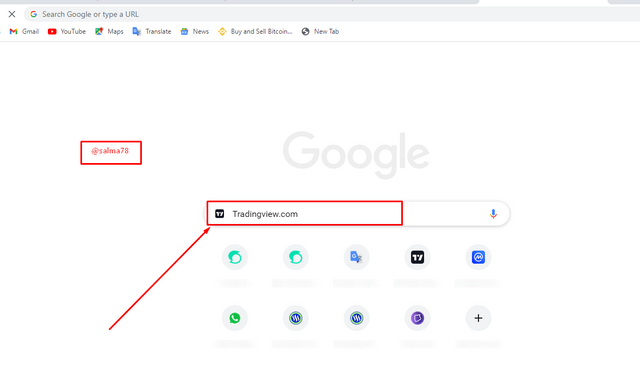
- First of all, visit the website from google search tab TradingView.com
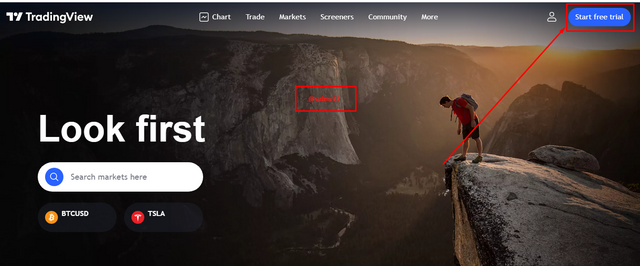
- From the main page click on Start free trial
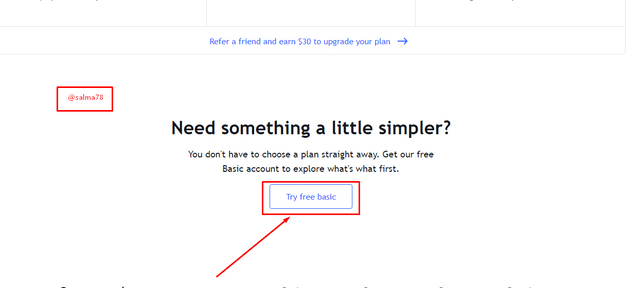
- From the next page opened Scroll down and click on Try free basic to register.
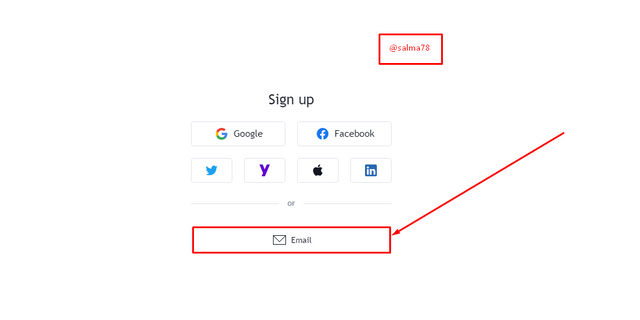
- This provides users with different signing up options including email, Facebook, Google, Yahoo, Apple IOS, Twitter, etc. For the purpose of this assignment I would be selecting Email so I then click on Email to continue.
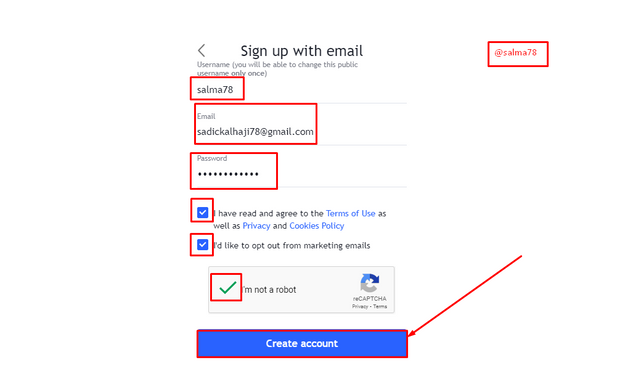
- I entered my details include username, email address, password, and then checked the small box to accept the terms and conditions. I also check the Captcha Box and did verification to prove that I am not a robot. After inputting all the required details click on Create Account.
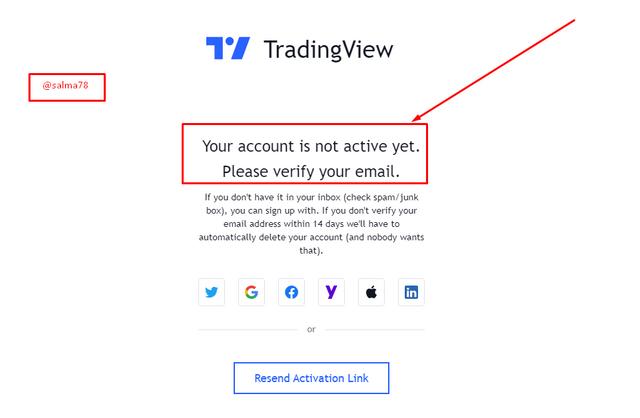
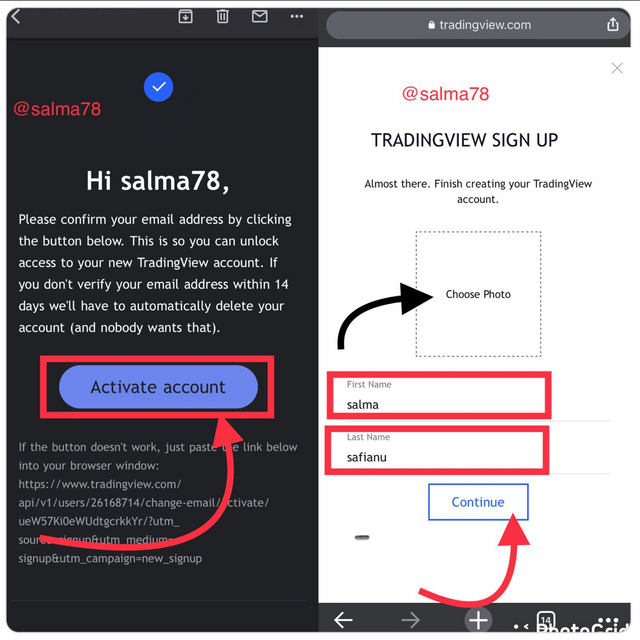
- A link was sent to my email address used where I clicked on Activate Account to continue. From the next page, I entered my first name and Last name as well. There is also an area that allows one to add photo as a profile but I wouldn't be adding any for now. After filling in all details click on Continue.
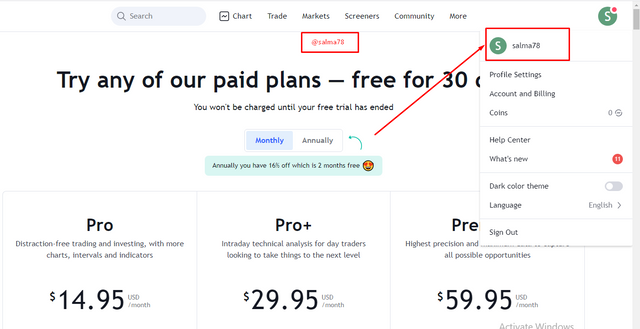
- Now my account is logged in successfully directly after clicking on continue.
It should be noted that I used my mobile phone to complete these steps and it can be seen from my screenshot below.
The differen Registration Plans in TradingView Site
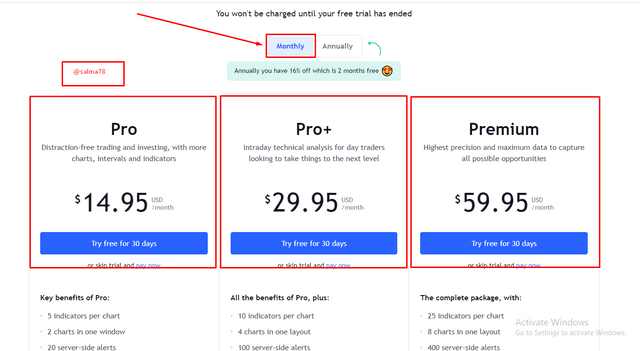
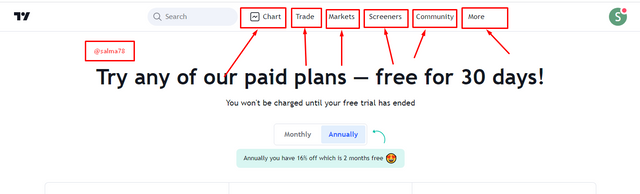
Generally, there is two main registration package in the TradingView platform which include Monthly and Annually and also the free basic plan as in the case of the plan we used when registering for the account. I would look at each separately in the following;
- The Monthly Package
This package or plan includes; Pro, Pro+, and Premium.
The Monthly Pro Plan:- This plan has a fee of $14.95 charged every month. It provides a distraction-free environment for trading and investment. It also includes more charts, indicators, and intervals. The key benefits of this plan include; the use of 2 charts in a single window, the use of 5 indicators in a chart, free from any form of adverts, provides custom time intervals, provides 20 server-side alerts, provides volume profile indicators, provides a bar replay on intraday bars, and also provide volume indicators.
The Monthly Pro+ Plan:- This plan has a fee of $29.95 charged every month. It provides an intraday technical analysis environment for day traders who are looking to take trading to the next level. The key benefits of this plan include; the use of 4 charts in a single layout, the use of 10 indicators in a chart, free from any form of adverts, provides chart data export, provides 100 server-side alerts, provides the possibility to set indicators on different indicators, provides access for 2 devices to use it at the same time, provides charts based on customed formulas, and also provide volume indicators.
The Monthly Premium Plan:-This plan has a fee of $59.95 charged every month. It provides the highest precision and maximum data that allows traders to achieve all available opportunities. It also includes more charts, indicators, and intervals. The key benefits of this plan include; the use of 8 charts in a single layout, the use of 25 indicators in a chart, provides 400 server-side alerts, provides 5 devices the possibility to connect to it at the same time, provides second-based intervals, it also provides alerts that do not expire, it allows for publishing invite-only indicators and also provide 4x more data on charts (20K bars)
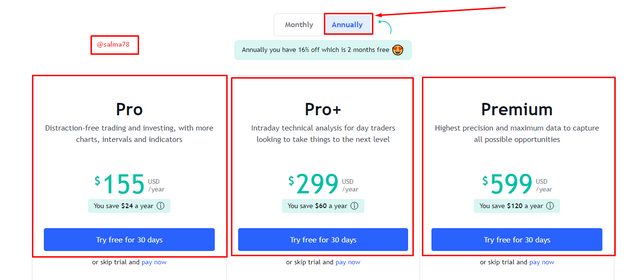
- The Annually Plan:- This plan is just similar to that of the Monthly plan benefits. The only difference is the amount of money for the packages. The amount for the annual packages include the following;
| Package/Plan | Amount ($) |
|---|---|
| Pro | $155 USD/year |
| Pro+ | $299 USD/year |
| Premium | $599USD/year |

Question No 2:
Explain the different features of TradingView and what is your favorite feature and why? (screenshot necessary)
The Different features of TradingView
- The following includes some of the features in the TradingView platform which I would be exploring in this task.
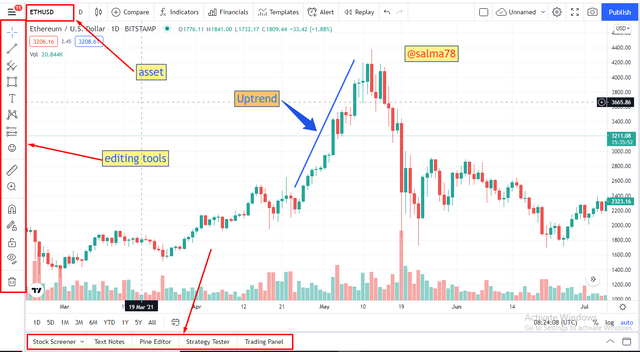
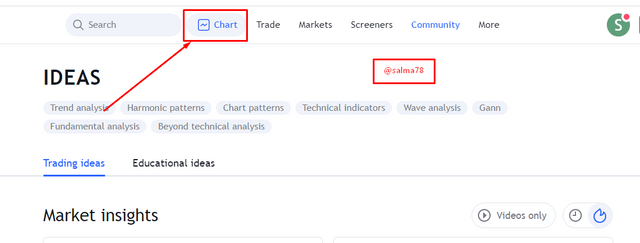
- The Chart Feature:-
This feature provides a clear view of how an asset's price is moving whether in an uptrend or a downtrend movement. This feature enables users to have access to different kinds of indicators used in determining the price movement of an asset. It also provides tools that help in making edits when marking the trend movement of an asset on a chart. It also displays support levels, resistance levels as well as stop-loss levels of an asset selected.
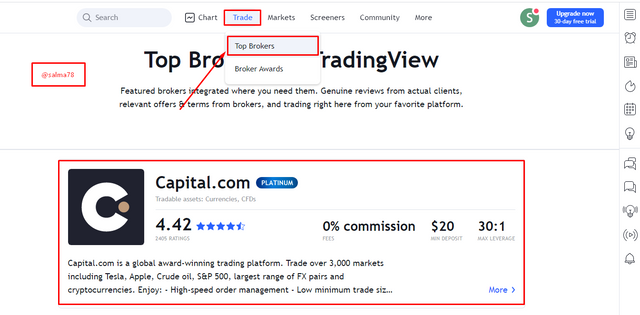
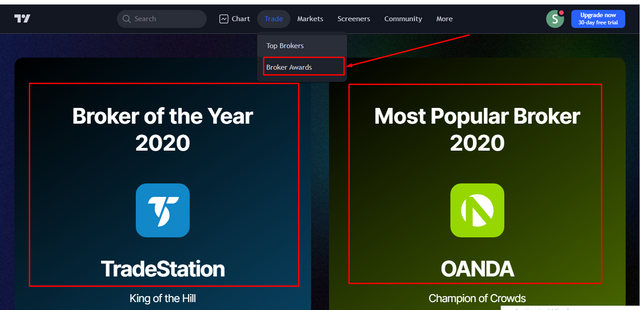
- The Trade Feature:-
This feature provides the list of brokers available on the TradingView platform and the minimum amount one can start with. It also displays each broker's benefits and their maximum leverages as well. The brokers available provide the chance for every user to open an account on their platform. The available top brokers on TradingView and brokers awards can be seen below here in the screenshot.
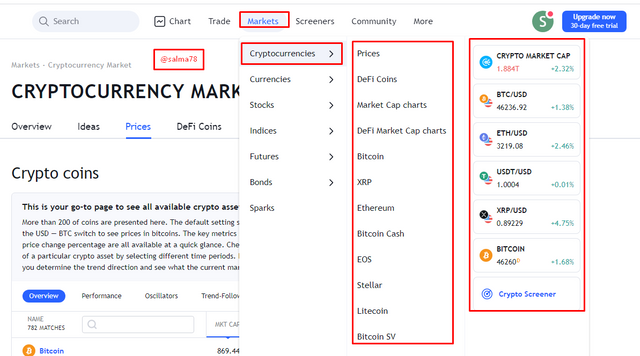
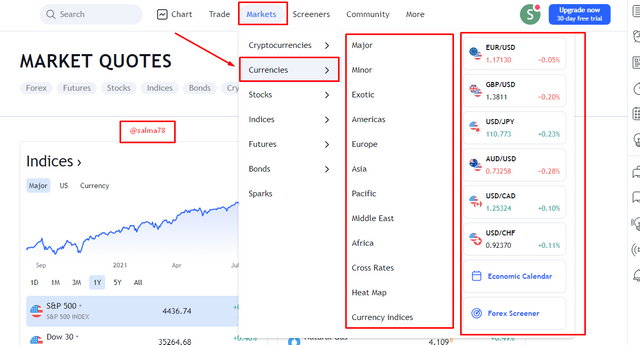
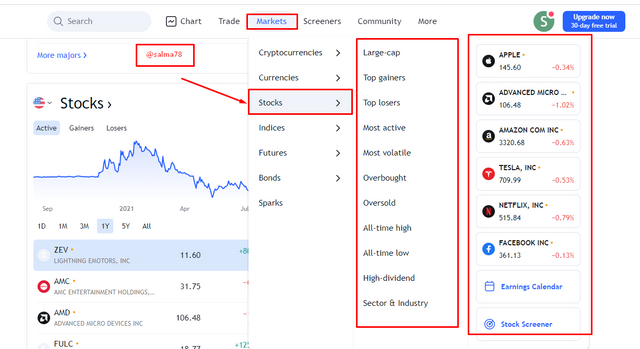
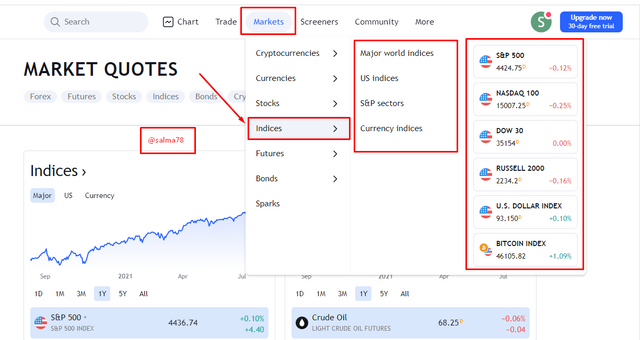
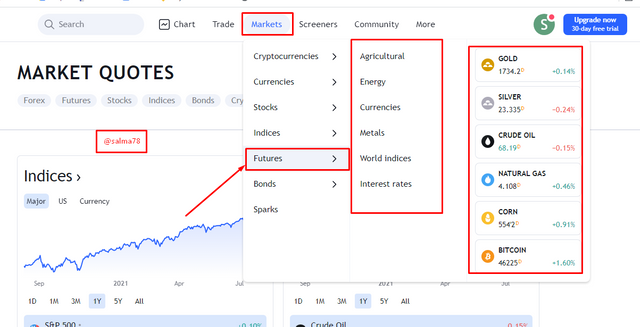
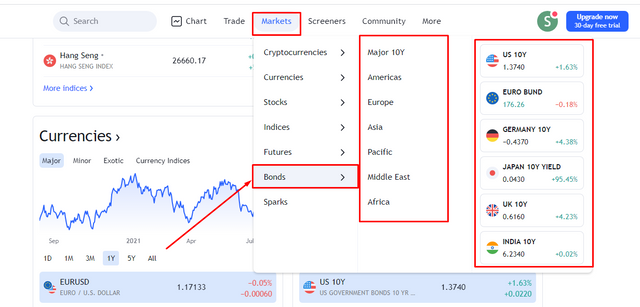
- Markets Feature:-
This feature comprises different sub-features including cryptocurrency, Indices, Bonds, Money, Currencies, Futures, and Sparks. It displays all the available market sections in the TradingView platform. Let's look at the sub-features;
Cryptocurrency:-
This sub-feature displays the prices of all cryptocurrencies available in the platform. This include Deficurrencies, Defi Market Cap Charts, Market Cap Charts, etc.
Currencies:-
This displays a full list of all available continents and their pair of currencies in the TradingView platform. Example is when one clicks on Asia, all available pair of currencies of Asian continent would be displayed.
Stocks:-
The stock feature displays options including top gainers, top losers, Most active, Most volatile, Overbought, Oversold, All-time high, All time low, High-dividend, Sector and Industry.
Indices:-
This feature displays indices by categorizing them in Major world indices, US indices, S&P Sectors, and Currency indices.
Futures:-
This feature provides information in different area of interest including; Currencies, Agriculture, Metals, World Indices, Interest rates, and Energy.
Bonds:-
The Bond feature provides information by classifying them based on continents types such as Americas, Europe, Asia, Pacific, Middle East, Africa and as well as Mahor 10Y.
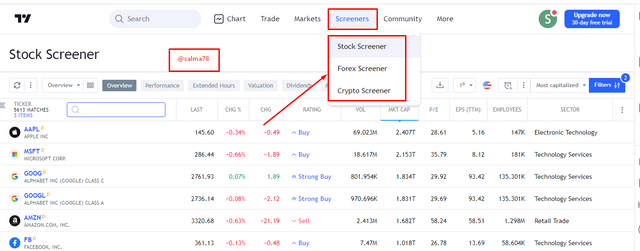
- The Screeners Feature:-
This faeture also has there sub-features which include Stock screeners, Forex Screeners, and Crypto Screeners. They provides accurate results of assets within the TradingView platform by providing guidelines on when to go for a buy option and when to go for a sell option in the market.
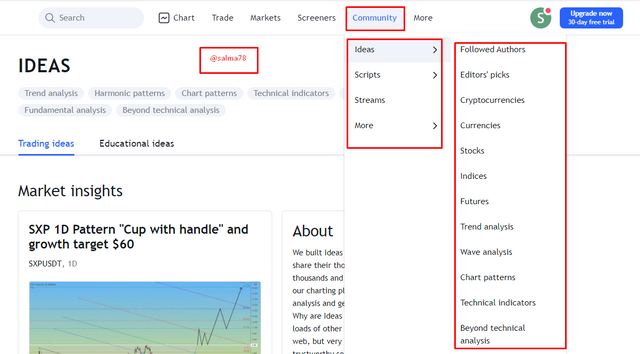
- The Community Feature:-
This feature comprise of gathered information of experts of cryptocurrencies and these information include the following; followed Authors, Editor's Picks, Currencies, Stocks, Indices, Futures, Trend analysis, Wave analysis, Chart patterns, Technical Indicators, etc. This is indicated in the screenshot below;
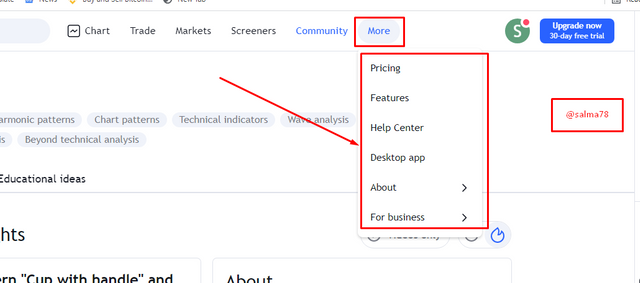
- More Option:-
This option provides other relevant features of TradingView including; Pricing, Features, Help Center, Desktop app, About, and Business aspects. This can seen in the screenshot below.
My Favorite feature and Why?
Among all the features I have discussed so far above in this article, my favorite feature is the Chart feature.
The following include the reasons I chooses the chart as my favorite feature.
This feature as discussed earlier displays a clear analysis of an asset with just a single view format. It also displays the market trend of the asset one is working with or in one's watchlist. It provides marks or points of the resistance level, support level , and stop-loss level of an asset in a single view without any stress. Thus it helps traders in making profits and avoiding losses by trading in the right time. Another most important feature on the chart feature that makes it my favorite is the indicator option available on its menu. It has the able to add more indicators on it so as to read the trend and identify the future movement of an asset in the market.
Question no 3:
How to set up a chart in TradingView and use two tools to edit it. (screenshot necessary)
How to Set up a Chart in TradingView
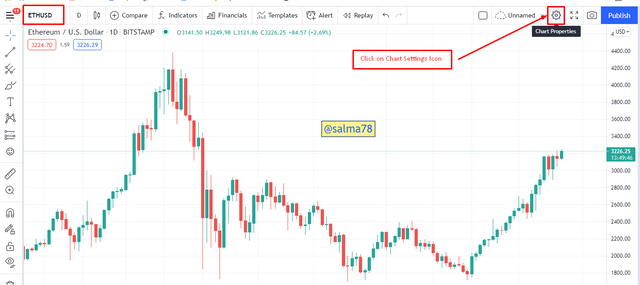
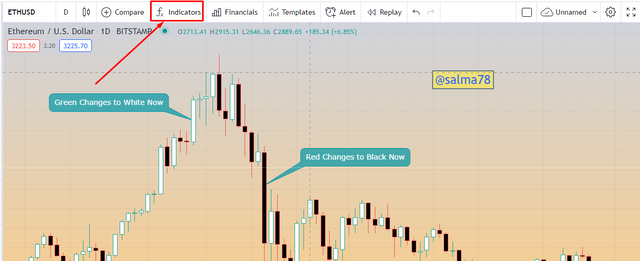
- Firts of all, click on the Chart tab at the top screen of the main page of TradingView after login. I would be using ETHUSD pair in this set up.
- Now, click on Settings Icon on the top right corner of the chart window.
From the chart settings, I would be using the Apperance and Symbol tools here in making my edits on the chart.
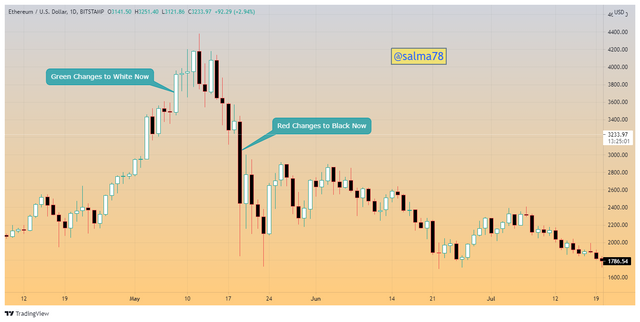
From the symbol tool, I would change the candle's body color to black and white instead of the normal green and red. Change Green to white and Red to Black.
Click on the green color of the body section and select white and then click on the Red color of the Body section and select Black.
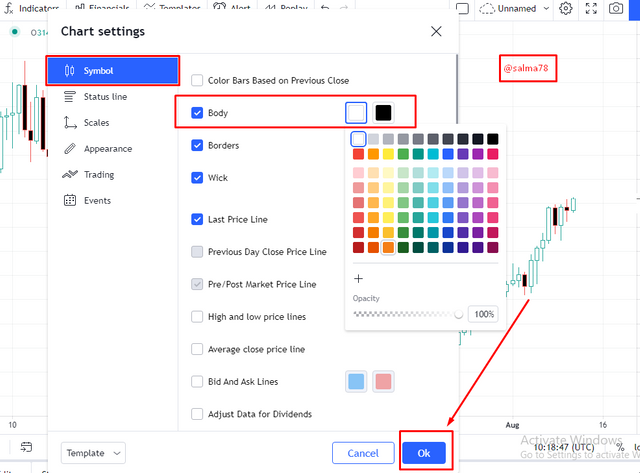
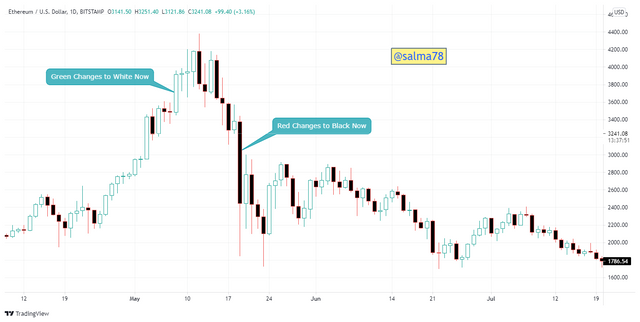
- Now click on Ok to save the changes. Changes now occurred as indicated from the screenshot.
- Now click on the Apperarance to edit the appearance settings. Click on Solid and then choose Gradient to change the Background settings of the chart.
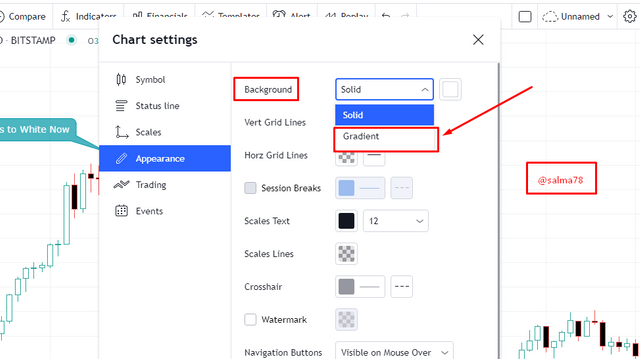
- I would then change the first color to light ash color and then the second to a light orange color as shown form the screenshot below. Then click on OK to save new changes.
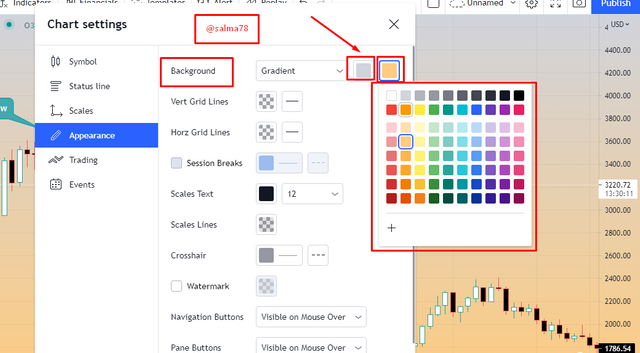
- Now the my changes has successfully been added as shown below.
Question no 4:
Explain how to add indicators in the chart, what is your favourite indicator and why? (screenshot necessary)
How to Add Indicators in the chart
- first of all click on Indicators from the toolbar shown above the chart.
- Enter or search the indicator you wish to add, I would be adding the MACD indicator in this case so I Search MACD and then it appears and I click on it to add.
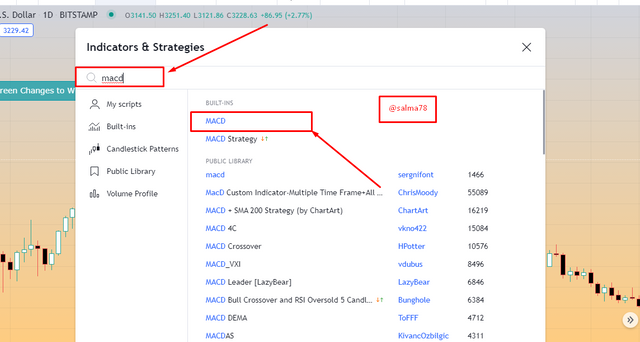
- Now close the indicators and Strateies search menu and we can see the effect as shown in the screenshot below.
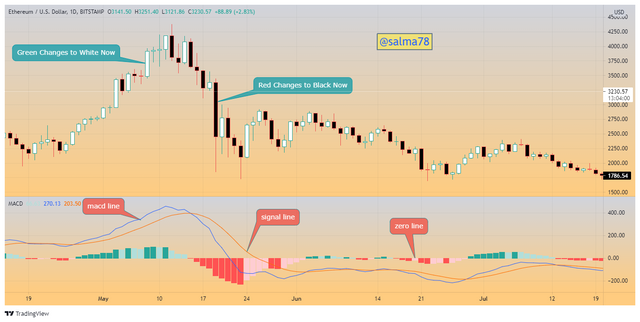
We can from the above chart that the orange line indicates the signal line and the blue line indicates the macd line from the macd indicator added.
Why is MACD indicator my Favorite
MACD indicator is my favorite because of the following reasons;
The macd indicator provides about 80 percent of accuracy in trading signals and when used with the aid of the RSI indicator then a 100 percent accurate results is assured.
It aids in predicting the future movenment of trends of an asset in the market.
Again the macd is best used for short-term trading which I does the most.
The macd indicator is a good indicator that favours all time frames in trading, i.e. daily, weekly, monthly time frames.
Furthermore the macd indicator provides a user-freindly interface which has no complexity in its indication of trends/patters like the other inidcators such as Ichimoku indicator.
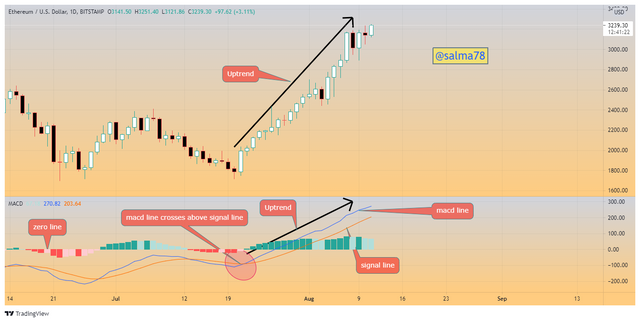
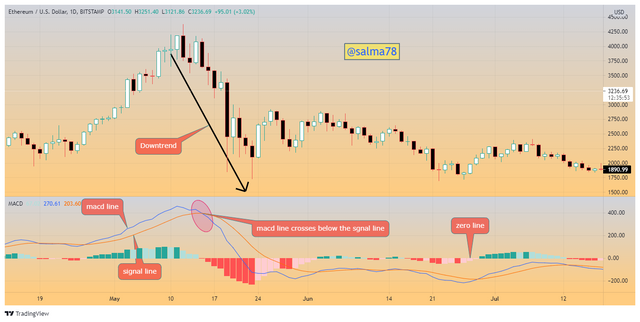
lastly, the macd indicator is easily used in determining trends or patterns of an asset in that when the macd line crosses above the siganle line then an indication of an uptrend is expected and when the signal line crosees above the macd line or when the macd line crosses below the signal line then an indication of a downtrend is suspected. I would illustrate an example in the following chart below.
MACD indicator showing an Uptrend
An Uptrend is indicated from this indicator when the macd line crosses above the signal line just as we can see from the screenshot below.
MACD Indicator showing a Downtrend
A Downtrend is indicated from this indicator when the macd line crosses below the signal line just as we can see from the screenshot below.
Question no 5:
Do you think TradingView is useful in predicting the market for cryptocurrency (trend / price)?
Usefulness of TradingView in Prediciting the market Price of Cryptocurrencies
Yes of course, TradingView is very important in the predicition of asset's price. The tradingView features helps traders in predicting the future trends of assets. The chart feature helps traders to easily have access to their watchlist and also have a simple view of their assets in any time frame in the crypto market.
TradingView provide traders with the necessary information needed in determining or predicting the future trend or price of an asset. TradingView also has an indicator feature that aids in the prediction of trends of assets. These indicators are of different types and as I already indicate my favorite as macd indicator which was taught by professor @kouba01 in his lecture during the season two period. The TradingView platform also provides user-frriendly interface which makes it easier for traders to easily spot and identify future trends of assets.
The TradingView platform allow traders to be educated and also have access to the trending news of users or brokers within the crypto market through the community feature. In a nutshell the prediction of price of assets in TradingView platform is through the aid of the indicators and also through historical data of assets.
Conclusion
To conclude with, I would like to briefly summarize what we have done so far in this article. First of all, we looked at the concept of TradingView where we said they contain detailed information of the previous and current asset's price that enables traders to make profit and avoid losses. We also looked at how to register an account in tradingview platform and we didi this through a series of steps which I have listed above. We further looked at the different types of registration of plans in tradingview platform and their benefits each.
Furthermore, we discussed the different features of TradingView platform and their usefulness. I also discussed my favorite feature among all those discussed where I select the chart feature and my reasons were stated above in this article.
We also looked at the procedure taken in setting up a chart in TradingView platform and also how to apply two different tool in making edit on the chart. In addition, we discussed the process in adding an indicator in the chart of an asset and also looked at my favorite indicator and reasons I chose that indicator among all inidcators. Finally, we looked at the significant of TradingView in predicting the price of an asset in the crypto market.
I would like to say thank you to professor @yousafharoonkhan for such a wonderful lecture taught this week and I look forward to participating in your subsequent homework tasks.
Thank You.
Respected first thank you very much for taking interest in SteemitCryptoAcademy
Season 3 | intermediate course class week 7
dear you explained every step very well and i liked your homework, keep continue good work ,
MACD indicator is my favourite because of the following reasons;
The macd indicator provides about 80 percent of accuracy in trading signals and when used with the aid of the RSI indicator then a 100 percent accurate results is assured.
It aids in predicting the future movement of trends of an asset in the market.
Again the macd is best used for short-term trading which I does the most.
thank you very much for taking interest in this class
Thank you professor for your kind review Sir. I wish for your convenience in your work. I am much grateful.