Crypto Academy / Season 3 / Week 6 - Homework Post for professor @cryptokraze by @salma78

Introduction
The concept of Liquidity Level
The concept of Liquidity in trading refers to a term used in trading which describes the efficiency at which an asset or a share is being converted to physical cash without any impact on the market price of the asset. Liquidity is mostly influenced by buyers and sellers in the market. The liquidity level is marked just above the resistance level or just below the support level. The reaction or interaction between buyers and sellers within the market leads to the pending of stop losses, take-profits, and orders within the liquidity level. Liquidity can be observed on crypto charts with the aid of candlesticks to determine the highs and lows level of asset's price.
Liquidity is formed at a point when the price of the asset from either a high or low level is being reversed from that point. This indicates that liquidity in the market usually results in a trend reversal in the market price. Liquidity level is generally directly proportional to the volume of the crypto asset and how orders of that asset are placed in the market. Institutions such as banks and other financial firms utilize liquidity levels in managing the price of assets due to high trading volume at the liquidity level.
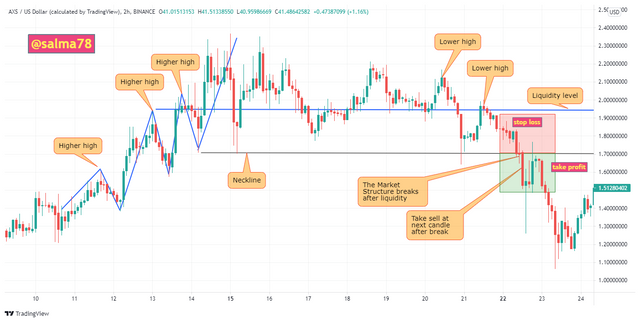
An example of liquidity on a Day AXSUSD Chart providing daily liquidity of the asset.
The liquidity level indicates the days at which most cash flows occurred between AXS buyers and sellers.
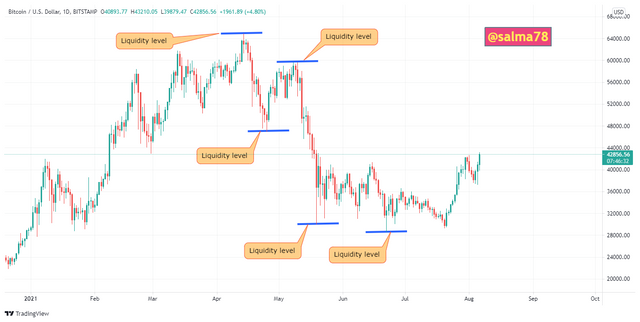
Considering an AXSUSD chart shown above, we can see that on the 14th April 2021 and on the 10th of May, 2021 there was liquidity at a high point indicating that most sellers sold their assets and made profits by taking cash. Again we can see from the chart that on 25th April 2021, 19th May 2021, and on 22nd June 2021, there was liquidity at low points indicating that most buyers bought the assets on those points through cash. These reactions of buyers and sellers at those points create liquidity levels at those points which tends to bring about trend reversal in the market.
Explain the reasons why traders got trapped in Fakeouts. Provide at least two charts to show clear fakeouts.
What are fakeouts?
Fakeouts refers to the term used in trading when the market is being manipulated by an institution's investors to obtain higher profits by manipulating it such that the market hits the stop loss of a retail trader. Fakeouts mostly occur at the resistance and support levels of an asset's price. Freakouts occur because big institutions with a huge amount of money utilize this strategy to make more profits with their money. Also, fakeouts do occur because some traders use it as an advantage to trap retail traders by letting the market hit the stop loss of the retail trader.
How Traders got trapped in Fakeouts
During liquidity levels of the price of an asset, a retail trader can decide whether to trade or not. When the retail trader decides to trade, then the chance or probability of manipulation of trade to hit the stop loss of retail traders by big institutional investors would be very high. Those big institutions supply a large amount of money in the market so as to hit the stop loss level applied by the retail trader and hence it tends to create a huge liquidity level in the market. The stop loss points of a retail trader are mostly placed just above or below the liquidity level.
When this huge liquidity is being created by the impact of the huge amount of money supplied, this lures retail traders to enter into trade thinking that it is a break in the market but rather a trap set by those big financial institutions so as to hit the stop loss set by retail traders. Investors of the big institutions supply more capital in the reverse trend of the trade especially when the liquidity of the market is in a good position. This indicates that when a trade is in the downtrend movement, the big financial institutions add more money in the opposite direction i.e. uptrend which will make traders set the stop loss above the liquidity level. This allows the liquidity level to hit the stop loss level thereby fulfilling the intention of the big institutional investors. Traders run a loss during the period when the price of the asset moves downwards and touches the stop loss level. This indicates how traders are being trapped in the manipulation of the market by big financial institutions. Traders who do not have experience with the knowledge of indicators and strategies within the market are most at times gets trapped in fakeouts.
I would illustrate how both buyers and sellers get trapped in the market using charts.
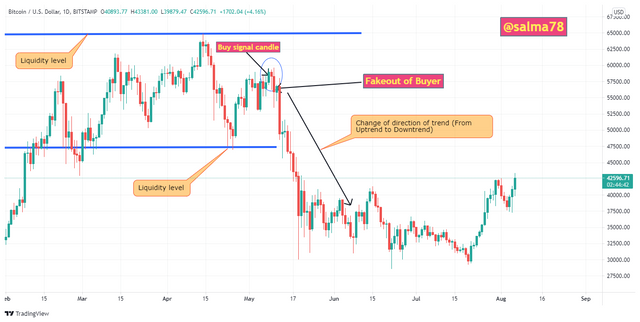
Buyers Trapped in Fakeouts
A fakeout trap happened on the 9th May 2021 in a BTCUSD market. This occurred as a result of a large amount of selling of BTCUSD in the market which tends to increase the liquidity in the market. Most traders do sell their assets here because they want to re-buy the asset at a very low price but unfortunately, the price of BTCUSD reversed in the other direction moving from an uptrend to a downtrend. This trade reversal occurred on the 13th May 2021 and this leads to a huge loss to retail traders when the price hits the stop loss level or point. This indicates how buyers are trapped in fakeouts. An illustration is shown below from the BTCUSD Chart.
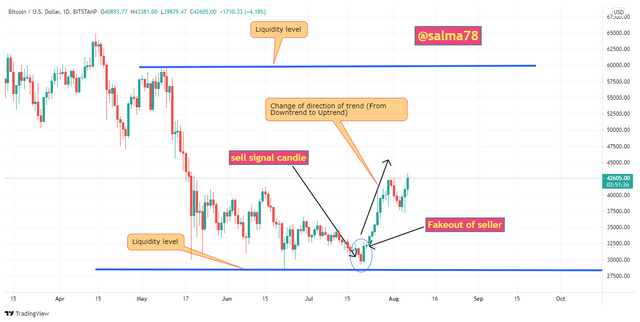
Sellers Trapped in Fakeouts
Again, the second condition is seen from the same BTCUSD Chart, where a fakeout trap is set for sellers. There was a long period of a downtrend in the market which creates liquidity in the market. There was a fakeout on 21st July 2021. This occurred as a result of the huge amount of money invested by the big financial institutions so as to create liquidity in the market. Sellers tend to sell their assets which tends to reverse trade and touches the stop loss set by the retail traders. This indicates how sellers are being trapped in the market. An illustration is shown below in the BTCUSD Chart.
How you can trade the Liquidity Levels the right way? Write the trade criteria for Liquidity Levels Trading (Clear Charts Needed)
In trading liquidity level in the market, the right way to do this is to analyze the liquidity level carefully and then utilize the two strategies we learned in our previous class, i.e. the market structure strategy and the break retest break strategy. One of these two strategies can be utilized in trading the liquidity level of an asset in the right procedure.
The Procedure that should be considered or followed when trading the liquidity level
First of all, check and analyze the liquidity level carefully by checking for a point or level where there is an ample amount of cash flow in the market.
Secondly, wait for either the market structure strategy or the break retest break strategy conditions to emerge.
The market structure break is utilized once its condition is favored in the market or we utilized the break retest break strategy when its condition is rather favored.
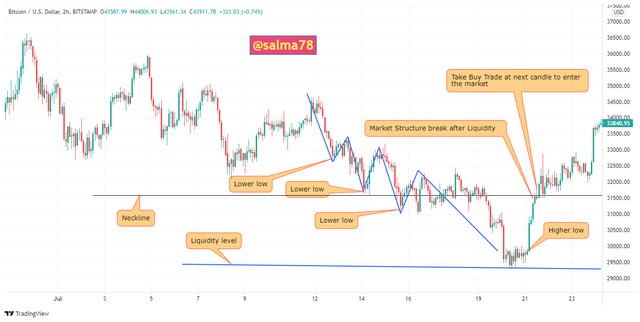
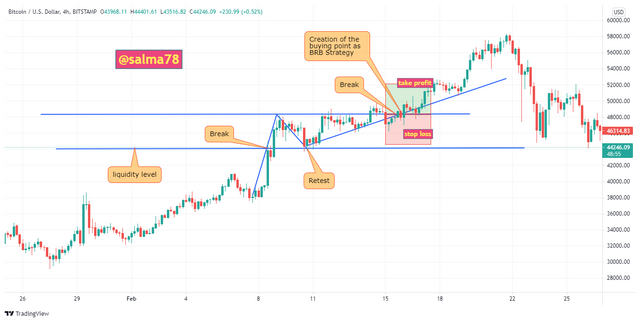
Let's consider these two conditions using 2-hour BTCUSD Chart.
The Market Structure Break Strategy.
Buying Trade Strategy
First of all, as stated earlier check and mark the liquidity level in the market of the asset and wait for the market structure break strategy conditions to emerge.
The liquidity level should be placed at a lower level of the candle when buying trade liquidity so as to avoid fakeouts in the market.
When the market structure break strategy conditions emerge then we follow the buy trade criteria for this strategy. Also, it should be noted that the market trend should be in a downtrend for a buy trade point and must be in a short time frame. In this case, I would be using a 2-hour time frame.
The price movement should create a higher low and after which a series of lower lows levels, after checking and confirming this points then make the support line just after the higher low point.
Patiently wait for a condition whereby a bullish candle breakout the support line and we term this as the market structure break strategy.
Now a buy trade can be initiated which will be just above the market structure break level as indicated below.
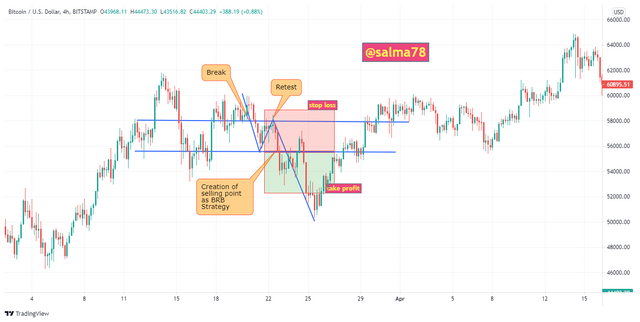
Selling Trade Strategy
First of all, as stated earlier check and mark the liquidity level in the market of the asset and wait for the market structure break strategy conditions to emerge.
The liquidity level should be placed at a higher level of the candle for selling trade liquidity so as to avoid fakeouts in the market.
When the market structure break strategy conditions emerge then we follow the buy trade criteria for this strategy. Also, it should be noted that the market trend should be in an uptrend for a sell trade point and must be in a short time frame. In this case, I would be using a 2-hour time frame.
The price movement should create a lower high and after which a series of higher highs levels, after checking and confirming this points then make the support line just after the lower high point.
Patiently wait for a condition whereby a bullish candle breakout the support line and we term this as the market structure break strategy.
Now a sell trade can be initiated which will be just below the market structure break point as indicated below.
The Break Retest Break Strategy
Buying Trade Strategy
Similarly, first of all, check and mark the liquidity level of the asset in the market and wait for the break retest break strategy conditions to emerge.
The liquidity level of the asset in a buying trade must be at higher level of candle. This indicates that the liquidity level should be in a selling condition so as to avoid fakeouts in the market.
When the break retest break strategy conditions emerge then we follow the buy trade criteria for this strategy.
Now create a resistance level but here the liquidity level should serve as the resistance line for the Break Retest Break Strategy.
Patiently wait for the asset's price trend to break the resistance line and then create a swing high point above the resistance break level.
Check the retest of the resistance level marked to see if the price of the asset moves towards the resistance level and a bounce back occurs which reverse the trend to an uptrend.
Look for a swing high that is higher than the previous swing high point created earlier.
Take buy entry just above the swing high break line.
An illustration is shown below;
Selling Trade Strategy
Similarly, first of all, check and mark the liquidity level of the asset in the market and wait for the break retest break strategy conditions to emerge.
The liquidity level of the asset in a buying trade must be at lower level of candle. This indicates that the liquidity level should be in a buying condition so as to avoid fakeouts in the market.
When the break retest break strategy conditions emerge then we follow the buy trade criteria for this strategy.
Now create a support level but here the liquidity level should serve as the support line for the Break Retest Break Strategy.
Patiently wait for the asset's price trend to break the support line and then create a swing low point below the support break level.
Check the retest of the support level marked to see if the price of the asset moves towards the support level and a bounce back occurs which reverse the trend to a downtrend.
Look for a swing low that is lower than the previous swing low point created earlier.
Take sell entry just below the swing low break line.
An illustration is shown below;
Draw Liquidity levels trade setups on 4 Crypto Assets.
Liquidity levels setup trade examples
- Example 1: LTCUSD Chart
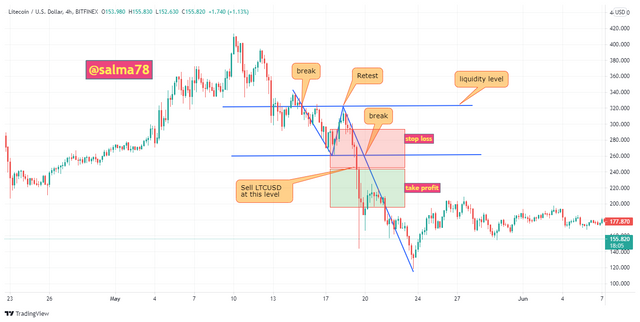
Above is a sell setup in which I used the Break Retest Break Strategy to trade around liquidity level
- Example 2: LTCUSD Chart
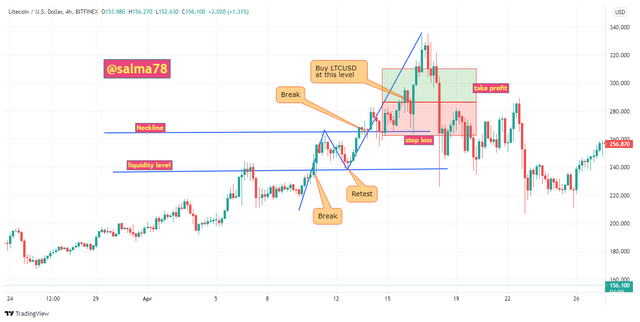
Above is a Buy setup in which I used the Break Retest Break Strategy to trade around liquidity level
- Example 3: MATICUSD Chart
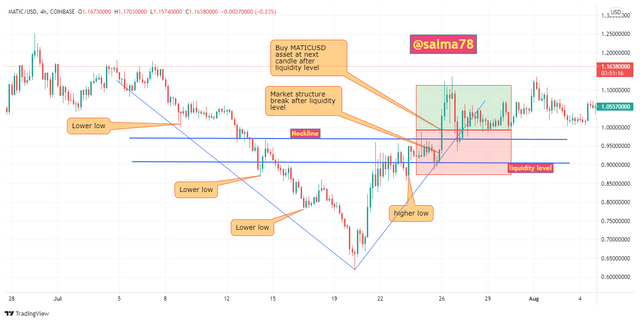
Above is a Buy setup in which I used the Market Structure Break Strategy to trade around liquidity level
- Example 4: ADAUSD Chart
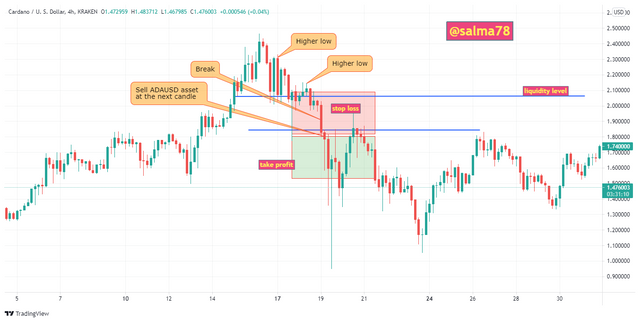
ADAUSD 4 hour Chart
Above is a Sell setup in which I used the Market Structure Break Strategy to trade around liquidity level
Conclusion
I would like to conclude by giving out a summary of what we've done so far in this article. First of all, we looked at the concept of liquidity level by providing charts. We explained the definition of liquidity level and we also touched on some of the benefits of liquidity level and how liquidity levels do occur in the crypto market. Again, we also looked at the reasons why most traders get trapped in fakeouts in the situation for both buyers and sellers in the market. Furthermore, we looked at the best way of trading with liquidity level using the market structure break strategy and the break retest break strategy by using Charts. We also looked at four different setups of crypto assets by showing liquidity levels on the charts.
I would like to say thank you to professor @cryptokraze for such a wonderful lecture taught this week and I look forward to participating in your subsequent homework tasks.
Thank You.