Crypto Academy | Season 3 | Week 8 [Homework Post for Professor @cryptokraze] Sharkfin Pattern by @salma78


Question 1:
What do you understand by Sharkfin patterns? Explain by providing clear charts.
The Sharkfin pattern is formed as a result of the quick reverse in the trend of an asset in the market when the market is previously moving in either an uptrend or a downtrend which tends to change the direction of the trend in the opposite way. When this occurs a V sharp structure is formed and this is what is termed as the Sharkfin pattern in trading. Sharkfin pattern comprises of two different kinds i.e. normal V shape and Inverted V shape.
The normal V shape sharkfin pattern is formed as a result of the movement of the price of the asset in the market from a downtrend to an uptrend. On the other hand, the Inverted V shape sharkfin pattern is formed as a result of the movement of the price of the asset from an uptrend to a downtrend which tends to create an inverted V shape. The sharkfin patterns usually give a clear reversal of the trend of an asset in trade. The trend reversals formed by sharkfin patterns are mostly short-term reversals that do not keep long. I would illustrate examples of the normal V sharkfin and Inverted V sharkfin patterns using crypto charts below here in this article.
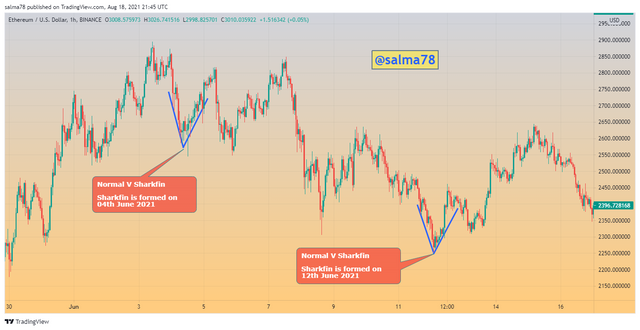
The Normal V Shape Sharkfin Pattern:-
- Let's consider the 1-hour ETHUSD chart shown below, we can clearly see that the price of ETHUSD on 04th June and 12th June 2021 was moving at a downtrend which later formed a swing low peak point and then reverses upwards. This reversal in trend creates a V-shaped point which is termed as the Sharkfin pattern specifically called the normal V shape Sharkfin. A good illustration is indicated below.
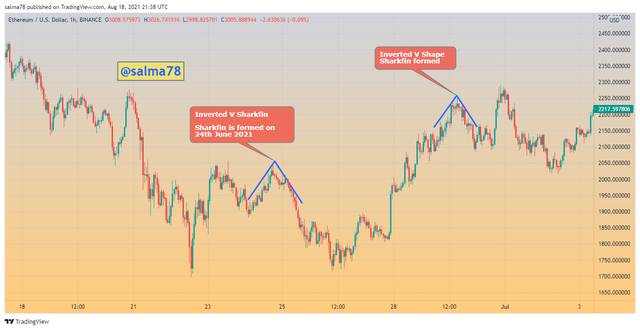
- Let's consider the 1-hour ETHUSD chart shown below, we can clearly see that the price of ETHUSD on 24th June and 29th June 2021 was moving in an uptrend which later formed a swing high peak point and then reverse downwards. This reversal in trend creates an inverted V-shaped point which is termed as the Sharkfin pattern specifically called the Inverted V shape Sharkfin. A good illustration is indicated below.
Question 2:
Implement RSI indicator to spot Sharkfin patterns. (clear Chart needed).
The Relative Strength Index indicator (RSI) is a type of indicator that enables traders to make good entry and exit points in trade. The RSI is also used in determining the trend of assets in the market. The RSI indicator is added to crypto charts so as to produce accurate Sharkfin patterns in the market and this is because some V-shaped patterns are just traps set by big financial investors to create false signals and trap traders in the trade.
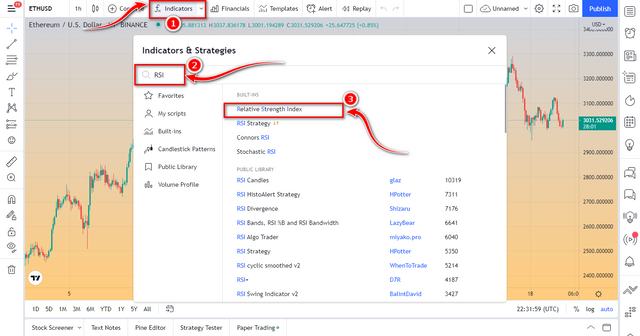
How to add RSI indicator
First click on Indicators & Strateties
Search and click on RSI to add the indicator to the chart.
How does the RSI work
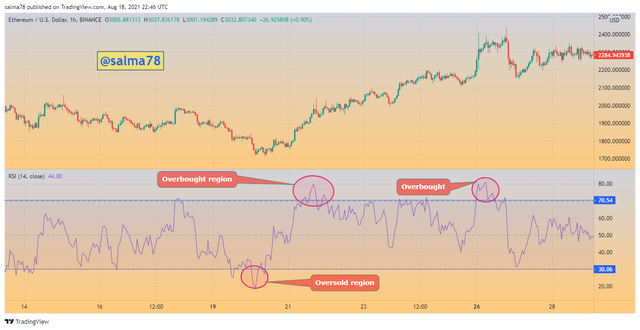
The Relative Strength Index has defaults settings of 14 periods and overbought and oversold regions with the overbought regions above the 70 mark and the oversold region below the 30 mark. Overbought regions are usually an indication to sell assets whilst oversold regions are also an indication to buy assets because of how low the price of the asset is. These overbought and oversold can be used in identifying accurate sharkfin patterns. Let's look at how these can be used in identifying both the normal V-shape pattern and the inverted v-shape pattern.
The Normal V shape with RSI
Whenever a normal v-shape pattern is formed, then the price of the asset would be in the oversold region using the RSI indicator. This indicates that when using the RSI indicator to identify a normal v-shape pattern the RSI line must move below the 30 level and then reverse and move above the 30 level again creating a normal v-shape pattern in the market. I would illustrate a typical example below here on a crypto chart.
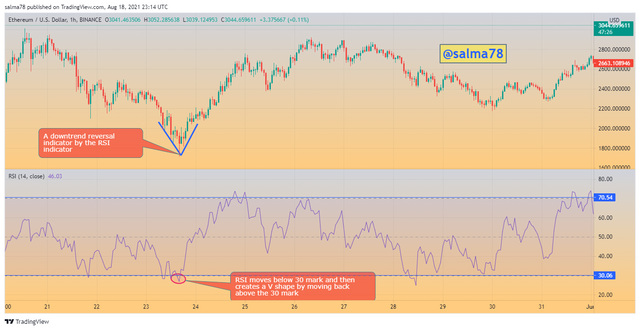
From the 1-hour ETHUSD chart shown above, we can clearly see that the indication of the downtrend of the asset was indicated by the RSI indicator also when the RSI line moves below the 30 mark. It immediately recovered by moving above the 30 mark again which then results in the creation of the V shape from the chart and also from the RSI indicator signal. This then proofs the indication of the normal V-shape Sharkfin formed in the chart above.
The Inverted V Shape Sharkfin with RSI
Whenever an inverted V-shape pattern is formed, then the price of the asset would be in the overbought region using the RSI indicator. This indicates that when using the RSI indicator to identify an inverted v-shape pattern the RSI line must move above the 70 level and then reverse and move below the 70 level again creating an inverted V-shape pattern in the market. I would illustrate a typical example below here on a crypto chart.
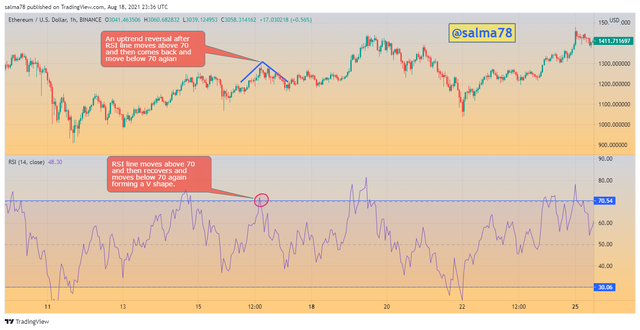
From the 1-hour ETHUSD chart shown above, we can clearly see that the indication of the uptrend of the asset was indicated by the RSI indicator also when the RSI line moves above the 70 mark. It immediately recovered by moving below the 70 mark again which then results in the creation of an inverted V shape from the chart and also from the RSI indicator signal. This proofs the indication of the inverted V-shape Sharkfin formed in the chart above.
Question 3:
How to make entry and exit trade using Sharkfin patterns for trading. Give example.
- Entry Trade for Buy Position:-
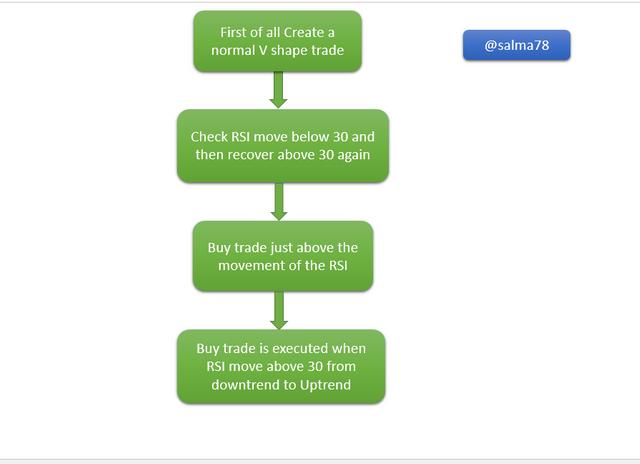
The following points should be followed when using the sharkfin pattern to enter a buy trade;
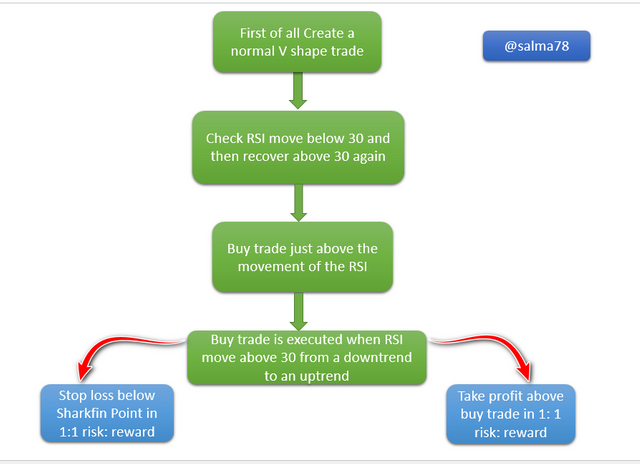
First of all, a normal V-shape shape is created whereby a downtrend in asset's movement tends to reverse and moves in an uptrend direction on both RSI indicator and asset's chart.
We then patiently wait until the asset's price breaks the oversold region below the 30 mark and the recover again and move above the 30 mark again.
A buy entry is executed once when the RSI line is spotted just above the 30 mark in the market.
Check carefully to see if the RSI line and the Sharkfin are in the right order before placing the buy trade.
I would like to illustrate the above on a chart to elaborate more on that.
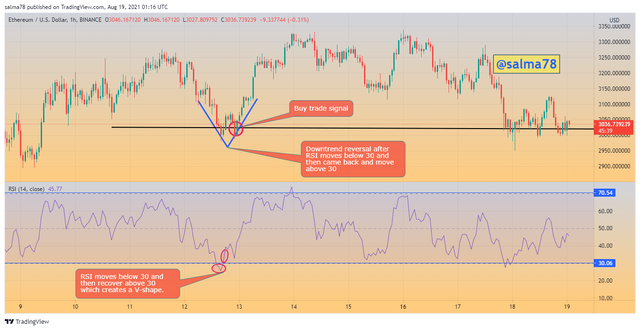
- From the ETHUSD chart shown above, we can see that from 12th August to 13th August 2021, the RSI line is moving below 30 and then later moves above 30 again. When the RSI line further moves above 30 then a buy trade is executed and we enter into trade. The buy trade level is marked at $3,036.77 as seen from the ETHUSD chart.
- Entry Trade for Sell Position:-
The following points should be followed when using the sharkfin pattern to enter a sell trade;
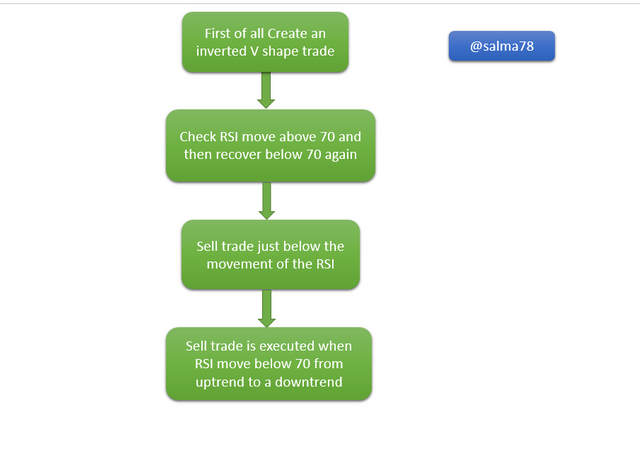
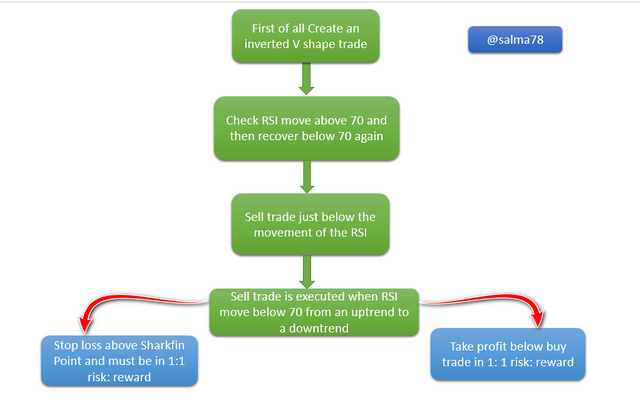
First of all, an inverted V-shape shape is created whereby an uptrend in asset's movement tends to reverse and moves in a downtrend direction on both RSI indicator and asset's chart.
We then patiently wait until the asset's price breaks the overbought region above the 70 mark and then recover again and move below the 70 mark again.
A sell entry is executed once when the RSI line is spotted just below the 70 mark of the RSI in the market.
Check carefully to see if the RSI line and the Sharkfin are in the right order before placing the buy trade.
I would like to illustrate the above on a chart to elaborate more on that.
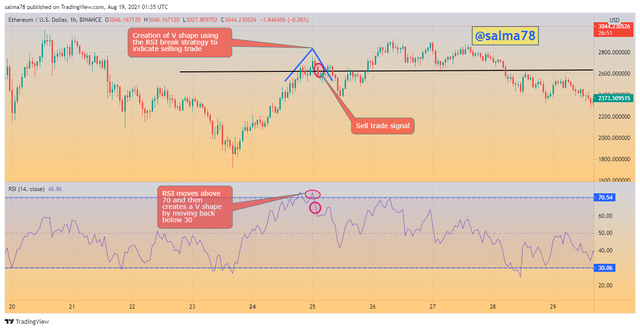
- From the ETHUSD chart shown above, we can see that from 25th May to 26th May 2021, the RSI line is moving above 70 and then later moves below 70 again. When the RSI line further moves below 70 then we take entry and sell the trade. The sell trade level is marked at $2,625.82 as seen from the ETHUSD chart.
When exiting in trades, the stop loss and the take profit levels are taken into consideration and utilized correctly so as to avoid losses and make profits.
- Exit Trade for Buy Position:-
The following steps or procedures must be followed when exiting in trade using the Sharkfin pattern trading for a buy position.
First of all, set a stop loss so that in case the trade goes wrong then it will help avoid huge losses.
The stop loss should be set below the Sharkfin pattern trading point.
When the price of the asset hits the stop loss level set then this indicates a weakness in the trade and thus, traders must wait patiently for a better trade situation formed in the Sharkfin trading pattern.
Use take profit at 1:1 risk: reward condition. This implies that the take profit and stop loss point should have a ratio of 1:1.
Lastly, take profit should be placed above the buy position and in the same ratio with the stop loss. (1:1). When the price of the asset hits the take profit level then an exit trade is executed.
I would like to illustrate the above on a chart to elaborate more on that.
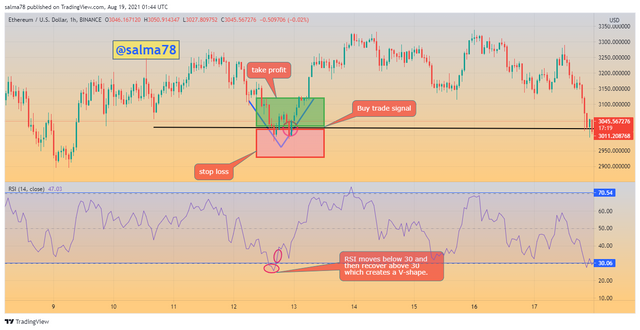
- From the same ETHUSD chart above, buy trade is executed but at this time around we set a stop loss to take profit ratio as 1: 1 Risk: Reward. From the chart above, the stop loss is placed just below the Sharkfin pattern whilst the take profit is placed above the buy trade point. When the price of the asset (ETHUSD) hits the stop loss then the trade is invalidated but when it hits the take profit level then we exit from trade with the profit earned.
- Exit Trade for Sell Position:-
The following steps or procedures must be followed when exiting in trade using the Sharkfin pattern trading for a sell position.
First of all, set a stop loss so that in case the trade goes wrong then it will help avoid huge losses.
The stop loss should be set above the Sharkfin pattern trading point.
When the price of the asset hits the stop loss level set then this indicates a weakness in the trade and thus, traders must wait patiently for a better trade situation formed in the Sharkfin trading pattern.
Use take profit at 1:1 risk: reward condition. This implies that the take profit and stop loss point should have a ratio of 1:1.
Lastly, take profit should be placed below the sell position and in the same ratio with the stop loss. (1:1). When the price of the asset hits the take profit level then an exit trade is executed.
I would like to illustrate the above on a chart to elaborate more on that.
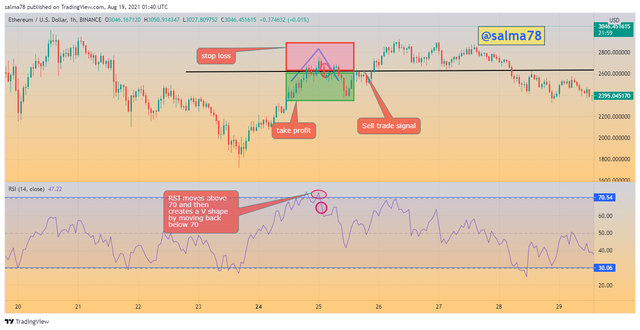
- From the same ETHUSD chart above, sell trade is executed but at this time around we set a stop loss to take profit ratio as 1: 1 Risk: Reward. From the chart above, the stop loss is placed just above the Sharkfin pattern whilst the take profit is placed below the buy trade point. When the price of the asset (ETHUSD) hits the stop loss the trade becomes weak and traders must wait for a better trade but when it hits the take profit level then we exit from trade with the profit earned.
Question 4:
Place two real/demo trades using Sharkfin pattern trading strategy.
I would be making demo trades on the XRPUSD and ADAUSDT chart using the Sharkfin pattern trading strategy.
Buying XRPUSD using the Sharkfin Pattern trading Strategy : (hitting stop loss)
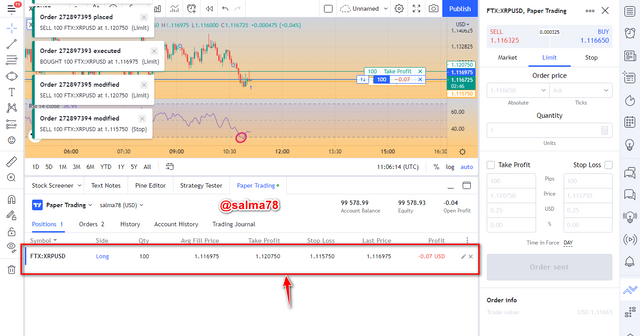
- We first of all check the RSI line to see if it moves below the 30 and then come back and move above the 30 again. When this reversal trend is formed then just above the cross of 30 we enter the trade and place a buy order. The XRPUSD asset was bought at a price of $1.118250 and the stop and take profit ratio was set at 1: 1.
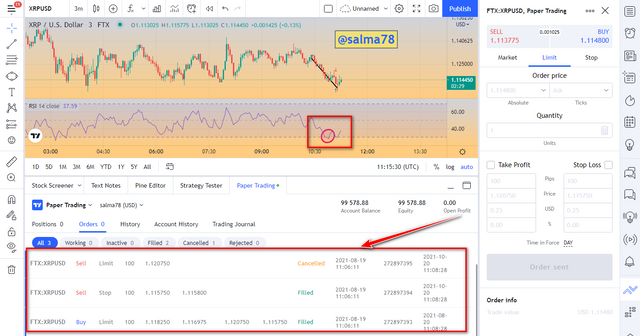
The stop loss was at $1.115750 and the take profit was set at $1.120750 which was in the ratio 1: 1 risk: reward. After some time, the price hits the stop loss whereby loss was incurred and we exit trade from the market. From the chart above, as indicated there was no formation of the sharkfin pattern and this caused the loss in the trade.
Buying ADAUSDT using the Sharkfin Pattern trading Strategy : (hitting take profit)
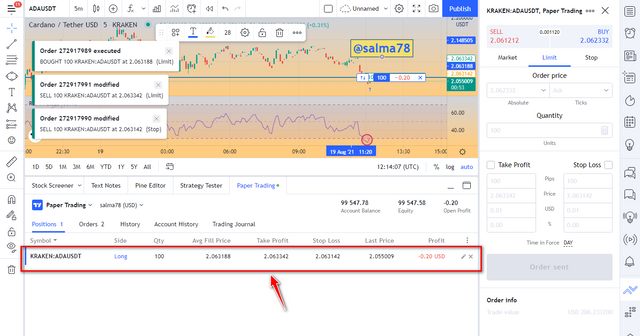
- We first of all check the RSI line to see if it moves below the 30 and then come back and move above the 30 again. When this reversal trend is formed then just above the cross of 30 we enter the trade and place a buy order. The ADAUSDT asset was bought at a price of $2.063188 and the stop and take profit ratio was set at 1: 1.
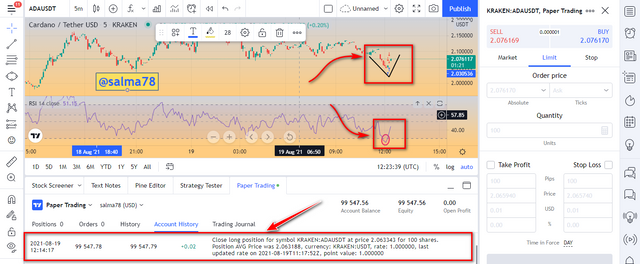
The stop loss was at $2.063142 and the take profit was set at $2.0263342 which was in the ratio 1: 1 risk: reward. After some time, the price hits the take profit whereby a profit of $0.02USD was earned and we exit trade from the market. From the chart above, as indicated the formation of the sharkfin pattern leads to the profits earned from the trade.
To conclude, I would like to give a brief summary of what we have done so far in this article. We, first of all, looked at the concept of the Sharkfin trading pattern and its formation. We discussed that the sharkfin patterns are in two forms namely the normal V-shape Sharkfin pattern and the Inverted V-shape Sharkfin pattern. Also, we looked at how the RSI indicator can be used in spotting sharkfin patterns. We used the RSI to discuss how a normal V-shape sharkfin pattern can be spotted on a chart and as well as the Inverted V-shape sharkfin pattern too.
We also looked at the criteria in entering and exiting trades using the sharkfin pattern strategy. We used crypto examples to illustrate these criteria. Finally, we performed two demo trades on two crypto-assets i.e. XRPUSD and ADAUSDT using the sharkfin trading strategy to illustrate examples.
I would like to say thank you to professor @cryptokraze for such a wonderful lecture taught this week and I look forward to participating in your subsequent homework tasks.
Thank You.