Advanced Trading: Multi-Timeframe Analysis and Market Cycles
 |
|---|
Welcome to class once again. Our discussing this week is combining Multi-Timeframe Analysis with Market Cycles. Have you ever been on a water body and the waves keep taking you up and down? Or a rollercoaster were you experience high and lows in a repeating manner? This week's topic is in a similar manner to this scenarios in relation to the financial market. I hope you get to learn something new too.
Understanding Market Cycles |
|---|
For us to understand this better, let's look at what the literature meaning of the words "market" and "cycle"
Market in it's literal meaning, stands for a place where people buy and sell things. This could be a physical location, like a farmers' market where you can find fresh produce, or it can be a virtual space, like an online store where you shop for products. However in a broader sense, the term "market" can also stand for buying and selling goods and services in an economy, including things like stocks, real estate, cryptocurrencies or any other type of trade.
While "cycle" on the other hand, literally means a series of events that keep repeating itself in a specific order, just like a circle where things go around and come back to the starting point.
For example, think about the seasons of the year where we have spring, summer, autumn, and winter, they keep repeating in that order every year. Therefore, we can say a cycle can refer to any pattern that goes through stages and then starts over again, like the phases of the moon or the ups and downs in the economy.
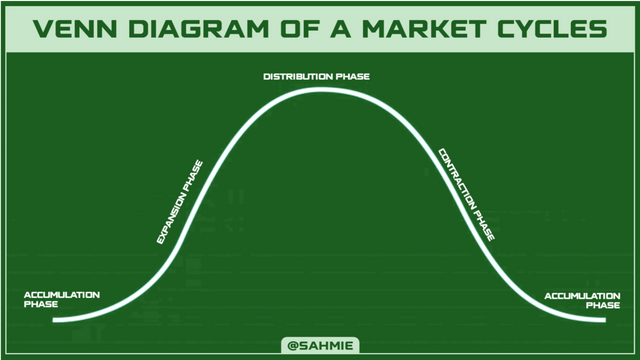
Therefore, we can say that a "market cycle" refers to the ups and downs that happen in a market over time. Just like the seasons in a year changes, markets also go through different phases, where it typically consists of four main stages:
Accumulation:
This is known as the phase where investors stock up their stores and this happens when prices are low, and smart investors start buying assets believing that the market will improve soon. This phase of the market is like picking up bargains hoping for better days ahead.
Expansion:
In this phase, the market starts to grow because more people notice the positive changes, and begin to invest, driving prices higher. Bring about businesses doing well and increase in confidence. It is a time of excitement and optimism, where everyone feels like they’re making good money.
Distribution:
This phase occurs when prices have risen significantly, and early investors start selling their assets to take profits because they believe the market might be reaching its peak or have made enough profit. Whereas new investors might be jumping in thinking the price will keep going up, but the seasoned investors are cautious.
Contraction:
Finally, this phase is when the market starts to decline like saying every action, results in a reaction. At this stage, prices drop reacting to early investors taking profit and many investors panic, leading to more selling turning the mood negative, and people are worried about losing money which can lead to recession, where the market takes time to recover before starting the cycle all over again.
 |
|---|
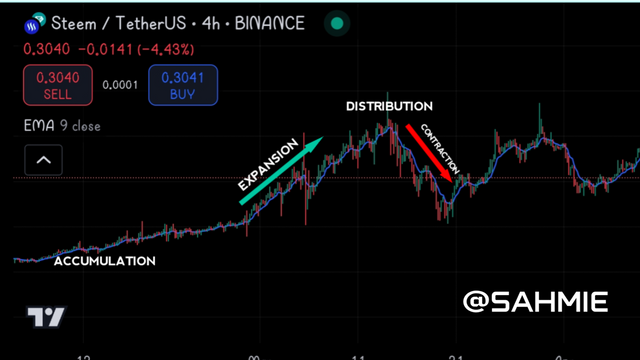
Now we can come across this different phases of a market cycle in a live trading scenario as shown below;
 |
|---|
From the above image, we can the various phases from how STEEM was accumulated by traders at a lower price, leading to an increase in price (Expansion phase) as the token supply was reducing, (increasing demand, increasing the price as supply reduces or remain the same). At the distribution phase, STEEM hit a peak price because the selling power meets the buying power as some traders starts taking profit while some are still entering the market with hopes it goes higher. However as more traders start selling, it caused pannick in market as everyone wants to take profit or mitigate their loses, thereby increasing the supply and reducing the demand which leads to the fall in price of Steem (Contraction phase). And as the price gets to a certain low point, traders starts to accumulated again, leading to another expansion phase, and this goes on, and on, and on making it a cycle (a repeated action).
Hence, understanding market cycles in cryptocurrency trading is really important for traders because it help traders understand how prices change over time in ways such as;
Understanding Trends:
Understanding the different phases that the crypto market goes through can give a trader an idea of what to expect and the direction of the market. For example, the accumulation phase because prices are low, smart traders start buying, then in the expansion phase, where prices rise and excitement builds as more people join in, it could be a good time to take profit. Therefore knowing this phases can help traders decide when to buy or sell.
Making Profits:
When we understand these cycles, we can make better decisions about when to invest. If we buy during the accumulation phase when prices are low, we can sell during the expansion phase when prices are high, making a profit.
Risk Management:
Market cycles also help with managing risks because if we notice that the market is moving into the contraction phase, the point where prices start to drop, we can be cautious and either sell our holdings or hold onto them until the next cycle starts, so we can avoid losing too much money.
Long-term Strategy:
For long-term investors, understanding market cycles can guide them on when to hold onto their investments and when to take profits. It is like knowing when to keep your money in a savings account versus spending it.
Applying Multi-Timeframe Analysis |
|---|
Multi-timeframe analysis for those new to the term, it is simply a way of looking at the same asset over different periods of time to get a better understanding of its price movements. Having to do a multi-timeframe analysis is to help you as traders to;
Have Different Views:
Imagine you are looking at a picture, now if you zoom in really close, you get to see the smallest of details, but then you might miss the bigger picture. However if you zoom out or step back, you get to see how everything fits together, this is exactly how multi-timeframe works. However Multi-timeframe analysis is like doing both at once. That is, you are looking closely at short timeframes (like minutes or hours) and stepping back to see longer timeframes (like days or weeks).
Finding Trends:
By checking different timeframes, you can spot trends that you might miss if you only look at one. For example, the daily chart might show that prices are generally going up, but the hourly chart may show a short-term drop. This can help you understand that the price might bounce back soon. A very good example is you noticed that the weather is sunny, but you know it is the rainy season. Therefore helping you plan better by leaving home with an umbrella expecting the rain.
For this understanding, let us look at some case scenarios below;
 |
|---|
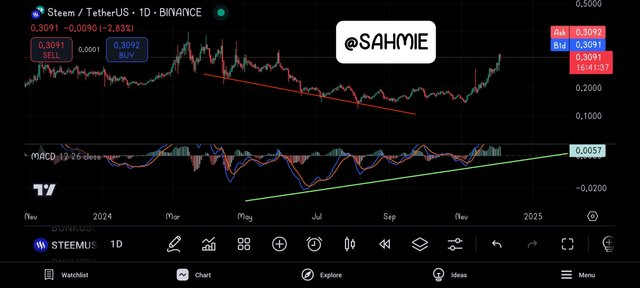
From the above screenshot, even though the at some point it seemed like Steem price was failing, applying the MACD indicator was showing higher lows, which indicates that Steem is on a uptrend in past few weeks.
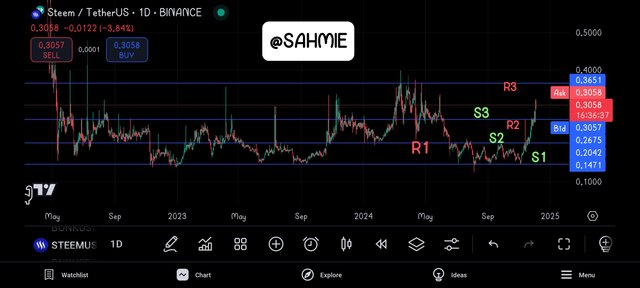
From this time frame, we can also mark out important support and resistance levels as shown below to help us identify reversals in the lower timeframe.
 |
|---|
The above screenshot shows all support (S1, S2 and S3) and Resistance (R1, R2 and R3) levels from the inception of the STEEM token to help us identify points of reversal and continuity.
Making Decisions:
Traders use multi-timeframe analysis to make smarter decisions. Let's say if a short-term chart shows a good buying opportunity, but the longer-term chart is still strong, it might be a good time to buy.
Confirming Signals:
Multi-timeframe analysis also helps confirm signals. For example, if both the short-term and long-term charts are pointing in the same direction, it gives more confidence in making a trade. This could be likened to getting a thumbs-up from your friend when you are about to try something new.
Now that we have come to know what multi-timeframe analysis is all about and how it can help traders, therefore to demonstrate how it can be used to identify trends and reversals during different market cycle phases using Steem/USDT charts, we have to:
Identify Trends on Different Timeframes:
How can this be achieved? All we need do is look at the daily or weekly chart of the Steem/USDT pair and take note of the price movement. For example, if the price has been consistently rising over the past few weeks. This served as an indication of a strong bullish trend.
 |
|---|
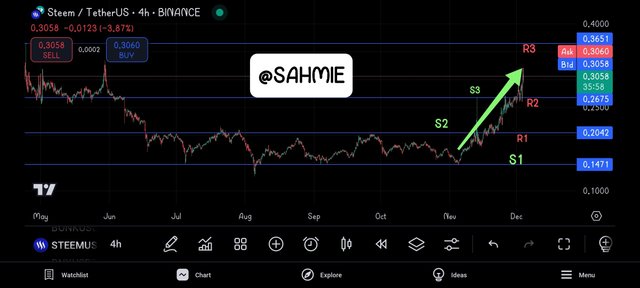
In the screenshot above, we have earlier confirmed an upward trend on the daily timeframe. But since it's a Multi-timeframe analysis, we need to switch to a lesser time frame, and let's say we switch to a 4-hour timeframe, and if we switch to the 4-hour chart, we might see some pullbacks or dips, well these dips could be temporary, as the overall trend on the daily chart is upward. This means that even if there are short-term fluctuations, the long-term outlook remains positive. So let us now look at the 4-hour timeframe to confirm the trend.
 |
|---|
Now, from the 4-hour timeframe, we can now confidently confirm that the market is on an upward trend as the price has broken through Resistance level R2, but yet to reach Residence level R3 therefore it has all tendencies of moving upwards further.
Spotting Reversals:
Now, consider that on the daily chart we see the price reaching a resistance level where it has struggled to cross over. At the same time, on the 1-hour chart, we notice a pattern of lower highs and lower lows forming. This could signal a potential reversal. And again, if the price breaks below a recent low on the 1-hour chart, it may suggest that the bullish trend is losing strength, and a bearish trend could be starting.
 |
|---|
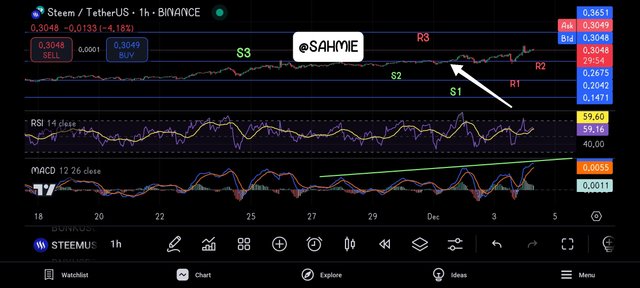
Looking at the above screenshot, we can see clearly how STEEM just broke the Resistance level R2 ($0.2675) which it has struggled to break through for a while. This suggests that Steem is on a upward trend even as the MACD indicator confirms this by producing higher highs whereas the RSI indicator is on a mid range, hence this level just broken becomes our now Support Level S3. Therefore, if Steem is to get to this point again and break below, this could signal a potential reversal.
Market Cycle Phases:
During a bullish market cycle, we might see higher lows on the daily chart, indicating a strong upward trend. However, when we check the 15-minute chart, we might spot some consolidation or sideways movement. This consolidation can be a sign that traders are taking profits before the next leg up.
Whereas, in a bearish market cycle, if the daily chart shows lower highs and the 4-hour chart shows sharp drops, this can indicate that sellers are gaining control.
Confirmation of Signals:
If we see a bullish signal on the 1-hour chart, like a breakout above a key resistance level, and it aligns with the overall bullish trend on the daily chart, it strengthens the case for entering a long position.
On the flip side, if the daily chart is showing signs of a downtrend and the 4-hour chart gives a sell signal, it might be wise to exit positions or consider shorting.
Combining Market Cycles with Multi-Timeframe Analysis |
|---|
To align multi-timeframe analysis with market cycles and refine our trading strategies, we need to follow these simple steps below;
Understand Market Cycles:
First, recognize that markets go through different phases which are the accumulation phase (where prices are low and buyers start entering), the expansion or uptrend phase (where prices rise), the distribution phase (prices peak and sellers start to take profits), and the contraction or downtrend phase (prices fall). Knowing where we are in this cycle helps us make better decisions.
Use Multiple Timeframes:
This involves us looking at a particular pair of assets chart in different timeframes. For example, we can use the daily chart to see the overall trend, where if it is going up, we know it is a bullish phase. Then, we can check the 4-hour chart to find our entry points. If the daily chart shows a strong uptrend, we look for buy signals on the shorter timeframe.
Confirm Signals Across Timeframes:
When we see a potential buy signal on the 4-hour chart, we should check if it aligns with the daily chart. This is because if both indicates an upward trend, it makes for a stronger signal to buy. But then, if the daily chart is showing a downtrend and the 4-hour chart gives a buy signal, we might want to be cautious and avoid buying because the daily chart represents the overall trend.
Adjust Your Strategy:
If you notice that the market is moving from an uptrend to a downtrend (like after a peak), you can adjust your strategy. For instance, if the daily chart starts showing lower highs, it might be time to sell or avoid new buys. On the other hand, if you see a reversal pattern on the shorter timeframe while the daily is still bullish, you might consider it a temporary dip to buy.
Over all, by aligning our multi-timeframe analysis with the market cycles, we can refine our trading strategies to help us make more informed decisions that take into account both the big picture and the smaller price movements, as this approach can help us maximize our profits and minimize risks.
Therefore using multi-timeframe analysis and understanding market cycles in volatile markets can really complement each other in a few key ways:
Big Picture vs Details:
The multi-timeframe analysis allows us to see the big picture on a longer timeframe, like the daily chart, while also giving us the details on shorter timeframes, like the hourly or 15-minute charts, helping us to understand the overall trend while spotting quick opportunities to enter or exit trades.
Confirmation of Trends:
In a volatile market, prices can swing wildly. Hence, by checking multiple timeframes, we can confirm whether a trend is strong or just a temporary movement. For example, if the daily chart shows a strong uptrend but the hourly chart shows some pullbacks, we can be more confident that the overall trend is still up, even if there are short-term fluctuations.
Timing Our Trades:
Volatile markets can change quickly, so timing is crucial. With multi-timeframe analysis, we can find the best entry and exit points. That is, if the shorter timeframe shows a clear signal to buy, and it aligns with the longer timeframe's trend, we can take advantage of that moment before the market shifts again.
Risk Management:
Understanding market cycles can help us manage our risk better. If we know the market is in a distribution phase (where prices are likely to drop), we can be more cautious about entering new trades, even if the shorter timeframe looks good. This way, we can avoid getting caught in a sudden downturn.
Hence, by using these tools together, we can navigate through the ups and downs of volatile markets more effectively, making smarter and better decisions which will increase our chances of success.
Developing an Advanced Trading Strategy |
|---|
To develop a trading strategy for Steem/USDT that combines both the market cycle phases and multi-timeframe analysis, we need to;
Identify Market Cycle Phases:
First, we need to understand the four market cycle phases which are accumulation phase (when prices are low and buyers start entering), expansion or uptrend phase (when prices rise), distribution phase (when prices peak and sellers start taking profits), and contraction or downtrend phase (when prices fall). Then, we also need to keep an eye on news or events that could influence these phases.
Use Multi-Timeframe Analysis:
Start by looking at the daily and weekly chart to identify the overall trend. Whereby, if these charts show an uptrend, we can now look for buying opportunities by switching to the 4-hour chart to find more precise entry points. And if the 4-hour chart also shows an uptrend, then we need to look for pullbacks (small drops in price) to enter our trade.
Entry Points:
On the 4-hour chart, we can set up buy orders when we see a pullback to a support level (which we know by now as a price point where the asset tends to bounce back up). We can use indicators like the moving average, RSI, MACD, Fibonacci levels to help identify these levels.
Set Stop-Loss and Take-Profit Levels:
Always set a stop-loss order slightly below the support level to minimize potential losses. For take-profit, we can aim for a resistance level (a price point where the asset tends to drop back down) or slightly below it on the daily chart. This way, we can secure profits before the market shifts.
Monitor the Market:
We have to keep an eye on the daily chart to see if the market is changing phases and if we notice any signs of distribution (like price stalling at a high), we can consider closing our positions or tightening our stop-loss to protect our gains.
Adjust as Needed:
This requires us to be flexible. That is, if the market starts showing signs of a downtrend on the daily chart, it might be time for us to stop buying and look for selling opportunities instead.
Here is a clear breakdown of my entry, exit, and risk management criteria for our Steem/USDT trading strategy:
Entry Criteria:
Look for a pullback on the 4-hour chart after a price increase. This is when the price dips slightly before continuing to rise.
Use a support level for your entry point. This could be a previous low where the price has bounced back up before.
Confirm our entry with a bullish signal, like a green candle (an indication that the price is going up) or an indicator like the Relative Strength Index (RSI) showing that the asset is not overbought.
Exit Criteria:
Set a take-profit level at a resistance point on the daily chart. This is where the price has previously struggled to go higher.
If the price reaches a take-profit level, close the trade to secure profits.
Additionally, if we notice signs of a trend reversal on the daily chart, such as a bearish signal (like a red candle), we should consider exiting our trade early to avoid losses.
Risk Management:
Always use a stop-loss order and learn to set it just below the support level where you entered the trade. We can use the Average True Range value to get a befitting stop loss. This way, if the price drops significantly, our losses are limited while also giving us room to avoid fake outs.
Risk only a small percentage of your trading capital on each trade. For example, if you have $1,000, you should risk no more than $10-$20 on a single trade.
Regularly review your trades and adjust your stop-loss and take-profit levels based on market conditions and your analysis.
Mitigating Risks in a Volatile Market |
|---|
Managing risks and avoiding false signals as we trade across multiple timeframes during different market cycles can be tricky, but then we mitigate the risk by;
Understanding Market Cycles:
First, we need to understand that markets go through different phases, which we have learned in this lesson. Therefore, knowing which phase the market is in will help us make better trading decisions on whether to enter, hold or exit.
Using Multiple Timeframes:
When analyzing a trade, we should learn to look at different timeframes. For example, we should use a longer timeframe (like daily or weekly) to understand the overall trend and a shorter timeframe (like hourly or 15 minutes) for entry and exit points and if the longer timeframe shows an uptrend, we might look for buying opportunities on the shorter timeframe, but if it shows a downtrend, we should focus on selling or avoiding buys.
Identifying Key Levels:
We should learn to always mark key support and resistance levels on our charts. This way if we see a price approaching these levels, we will be cautious, as they can lead to false breakouts (that is, the price moves above resistance or below support but quickly reverses).
Using Indicators Wisely:
Learn to use indicators like moving averages or RSI to confirm our trades. For instance, if the price is above a moving average and the RSI is not overbought, it’s a good signal to buy. However, if the RSI is above 70 (the overbought), consider waiting for a pullback before entering.
Set Stop-Loss Orders:
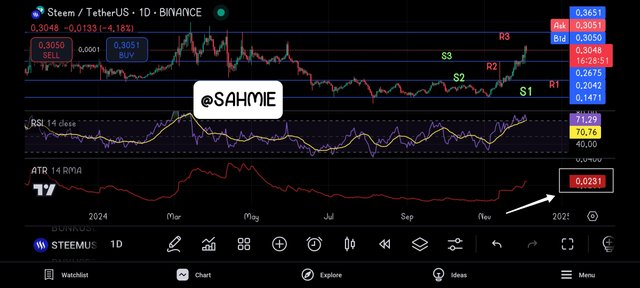
Always set a stop-loss order to limit losses and we can do this by either subtracting the ATR value from a support level when going long or by adding the ATR value to a resistance level if we are going short. This way, it gives room to avoid false break outs and also help minimise our losses if and when the market is truly against us. For example, below is a chart containing both the STEEM/USDT chart and the ATR value under the daily timeframe.
 |
|---|
In the above screenshot, we have the ATR value to be 0.0231 Assuming we are to take a long position from the Support Level 3 which is at $0.2675. Hence calculating our stop loss position from that point using the ATR value we will have to subtract 0.0231 from 0.2675, therefore;
SL = 0.2675 - 0.0231 = 0.2444
Therefore, if we are taking a long position our stop loss is at 0.244.
However if we are taking a short position from the Support Level 3, our stop loss will be adding the ATR value 0.0231 to the 0.2675. Therefore our stop loss will be;
SL = 0.2675 + 0.0231 = 0.2906
Therefore, if we are taking a short position our stop loss is at 0.2906.
Staying Informed:
Keep up with market news and events that could impact prices. Sudden news can create volatility and lead to false signals. Being aware of upcoming events can help us avoid entering trades right before major announcements.
Reviewing and Adjusting:
After each trade, review what worked and what didn’t. This will help us to learn from our mistakes and adjust our strategy. If we notice that certain indicators or timeframes led to false signals, we should consider changing our approach.
DISCLAIMER: Everything on this publication is not in any way a trading advice but just a piece of my understanding for learning purposes.
I wish to invite @starrchris, @bossj23, @ngoenyi, and @ruthjoe.
Thank You for your Time
NOTE: Always have a smile on your face, as you are never fully dressed without one.

Upvoted! Thank you for supporting witness @jswit.
Congratulations! This post has been voted through steemcurator09. We support quality posts, good comments anywhere and any tags.
@uzma4882, you did read the Curation Guideline to NOT VOTING on the homework posts for the Teaching Teams, right?
Here I send you the link. https://steemit.com/steemit/@steemitblog/steemit-update-november-28th-2024-community-curators-for-december
and the screenshot
Yes, I knew these rules very well but I thought crypto Academy is not part of teaching team. This is always seem in the engagement challenge. If this is also consider in teaching team then I will be careful next time. Thank you for highlighting.
Hello friend greetings to you, hope you are doing well and good.
You have the best understanding of the market. The graphs available here are just extra ordinary. I really follow your posts dear. Happy to see such a knowledgeable post of yours.
I wish you best of luck in the contest dear friend. Keep blessing.