Technical Indicators - Crypto Academy / S4W2 - Homework post for @reminiscence01
Hello everybody, Hope you all are fine and in good health!
My this post is a Homework Task assigned by professor @reminiscence01 which is about Technical Indicators

Question. 1a)
In your own words, explain Technical indicators and why it is a good technical analysis tool.
Technical indicators are tools used in technical analysis used by traders. These indicators predict future market trends based on the market movement in history. There are various indicators for different situations in the market to pinpoint right trends and buying and selling signals.
Traders also combine these indicators for more accurate setups. The calculations on which the technical indicators are based are determined from the historical data as the market is cyclic. The data is in the form of high, low, closing and opening price in defined periods which are then used as a reference for the future prediction of trade signals.
They are in the form of average lines, or bars which summarize historical market calculations.

Question. 1b)
Are technical indicators good for cryptocurrency analysis? Explain your answer.
In crypto trading technical analysis is the key tool and therefore every trader should have a better understanding of technical indicators. Traders who make calculated decisions while trading always excel with their trades.
As discussed, crypto markets are cyclic and the psychology of the market repeats after a certain period so indicators indicating future trade signals based on the historical market references are valid for these markets.
It is to be understood that no indicator is absolute but these surely enhance the ability to make right decisions rather than trading without these indicators.
They also help in identifying the trade entry and exits, stop loss and take profit levels.
Question. 1c)
Illustrate how to add indicators on the chart and also how to configure them. (Screenshot needed).
In order to illustrate how to add charts I will be using the tradingview platform.
Here the chart I selected is of ADA/USDT
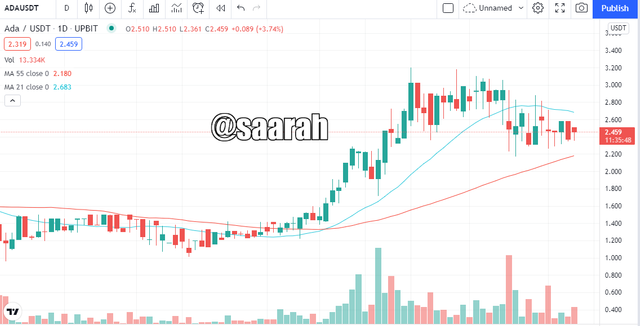
On the top bar click on the indicators option
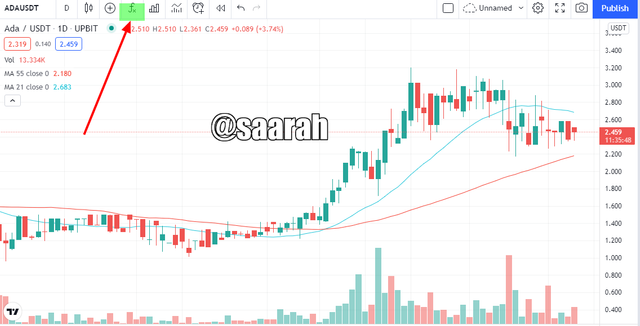
Then from the drop down menu you can choose any indicator
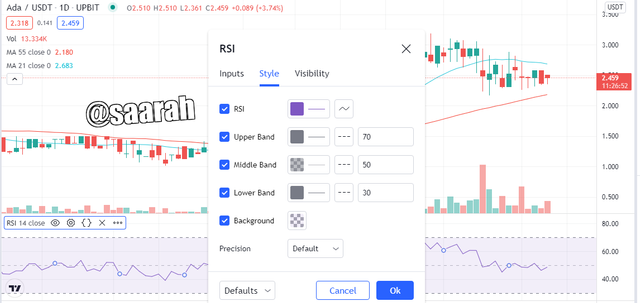
Search any name in the search bar here I am demonstrating RSI.
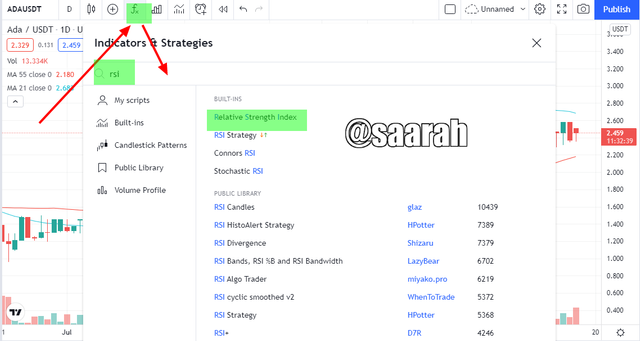
You can click on it to add it in the chart
The indicator will be added to the chart now close the menu
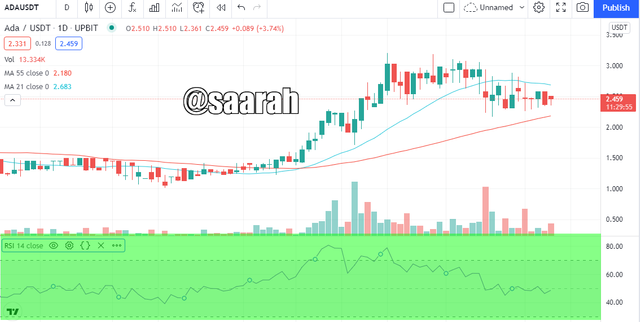
You can combine several indicators such as here I have combined MAs RSI
You can also change the settings by clicking on the settings icon

From here you can change periods, visibility color
Question. 2a)
Explain the different categories of Technical indicators and give an example of each category. Also, show the indicators used as an example on your chart. (Screenshot needed).
There are various categories of indicators like
Trend Based Indicator
Volatility Based Indicator
Momentum Based Indicator
Trend Based Indicator:
We often see two types of the trends in the market: up trend or bullish trend and bearish trend or downtrend. To speculate these trends for buying and selling opportunities we use Trend-based indicators. The market structure without the trend is called the sideways market. it is common phrase that
Trend is your friend and trading against the trend is foolish. Indicators such as Average Directional Index (ADX) is a trend-based indicator.
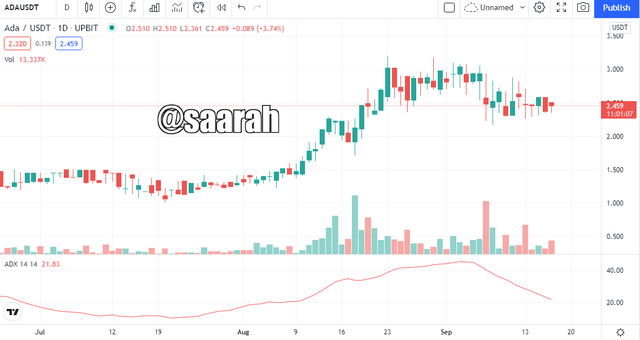
In the chart above I have added an ADX indicator. ADX represents the trend strength based on the scale of 0-100, 0-25 is weak or no trend, 25-50 is strong, 50-75 is very strong, and 75-100 is extremely strong.
Momentum based-indicator
The indicators that indicate the overbought and oversold conditions of the market are referred to as the momentum based indicator. These trends are determined by the supply and demand as well as the market volume.
The higher transaction volume when the trend is bullish indicates a stronger buying trend and an increasing volume in the downtrend indicates a higher selling trend. The overbought and oversold conditions represent the momentum of the market and are identified on the basis of the Momentum based-indicator.
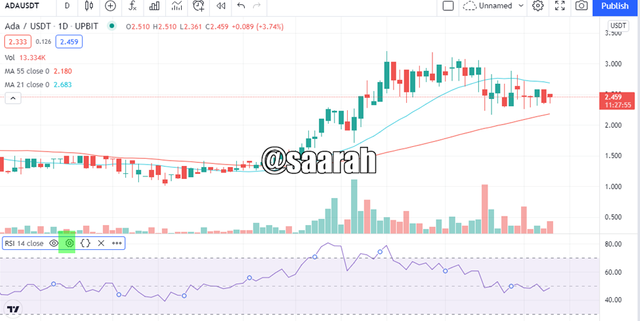
For example in the chart above we see RSI. The RSI shows overbought and oversold conditions based on the scale 0-100, values below 30 are oversold while above 70 are overbought signals.
Volatility based indicators
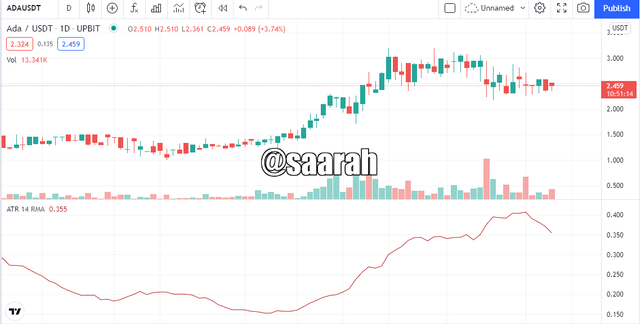
The crypto market is very volatile and there are sudden price fluctuations. Some indicators are based on the volatile history of the asset; these are called Volatility based indicators such as the ATR. They identify market swings and pinpoint buying and selling signals. For example in the chart below we see ATR.
Question. 2b)
Briefly explain the reason why indicators are not advisable to be used as a standalone tool for technical analysis.
As they are various indicators that cover different aspects of the market it is always better to use a combination of indicators. Using an indicator alone can give lagging or inaccurate signals resulting in wrong trading entries and exits.
Every indicator has its shortcomings and advantages and using a combination helps in accurate trading. Relative Strength Index (RSI), Moving Average (MA), Average True Index (ATR), Average Directional Index (ADX), Random Index (KDJ), and Ichimoku Cloud are some of the commonly used indicators.
Some good trade setups can be produced if we combine ADX with RSI, ADX with ATR and MA, ADX with KDJ and ATR.
Question. 2c)
Explain how an investor can increase the success rate of a technical indicator signal
Traders or investors can increase the accuracy or success rate of the technical indicator signal by educating themselves on the variables on which the indicators are based.
Good understanding of the technical analysis tools is the key to best trade setups. In addition to that, understanding how an indicator shows buy and sell signals is also very important. In some indicators we have to look for certain levels, in others we have to look for crossovers or the position of the lines.
The right choice of indicators based on the market condition, asset profile and the trading style is also important. In addition to that, the right configuration of the indicators is also crucial to accurate trade setups.
Traders should also focus on the right combination of the indicators for better results.
Conclusion
Technical indicators are important technical tools. They help in drawing accurate analysis for entering and leaving the market at the right times. For better analysis use a combination of indicators valid for different styles of trading and situations of the market.
Hello @saarah, I’m glad you participated in the 2nd week of Season 4 of the Beginner’s class at the Steemit Crypto Academy. Your grades in this task are as follows:
My Reviews and Suggestions:
You have completed the given task.
Your general explanation is still very lacking, please give more effort to the task you make.
Your explanation of indicator configuration is incomplete.
You only explained some categories of technical indicators, but you did not explain the indicators you chose as an example in the question.
There are some grammars that are still wrong, please pay attention again.
Thank you!