Heikin-Ashi Trading Strategy - Steemit Crypto Academy / S4W2 - Homework Post for Professor @reddileep
Hello everybody, Hope you all are fine and in good health!
My this post is a Homework Task assigned by professor @reddileep which is about Heikin-Ashi Trading Strategy
Question. 1)
Define Heikin-Ashi Technique in your own words.
Heikin-Ashi pattern is one of the very common candlestick patterns. It was developed by Munehisa Homma. It is based on the Heikin-Ashi Technique. In Japanese, Heikin-Ashi is known as the average bar. This pattern represents average prices of an asset. The Heikin-Ashi pattern is a modern-style candlestick pattern.
Every next candle in the Heikin-Ashi pattern is constructed from the average of the data of the previous candle. Many traders use this pattern to locate buying and selling positions as it is a much smoother chart with less noisy candles.
Like in the traditional candlestick pattern a typical candle in the Heikin-Ashi pattern has a high, open, close, and low. One conspicuous feature of this pattern is that every new candle opens from the middle of the previous candle.

Question. 2)
Make your own research and differentiate between the traditional candlestick chart and the Heikin-Ashi chart. (Screenshots required from both chart patterns)
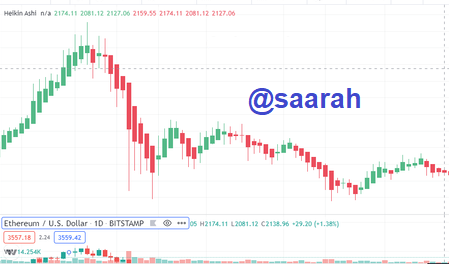
In this part of the post we will compare the two charts simultaneously
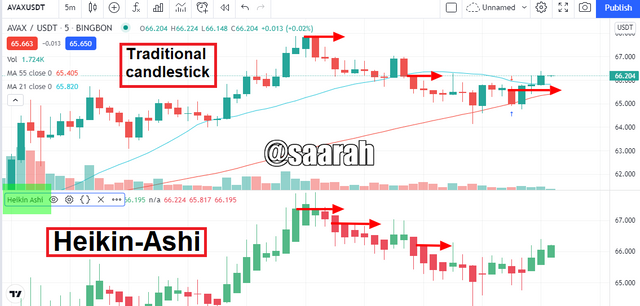
In the chart above we see the traditional candlestick pattern above and Heikin-Ashi pattern below. In the lower pattern every new candle is opening from the middle of the previous candle. In the traditional candlestick pattern the candles are opening from the start, middle or even from any point of the previous candle.
The trend in the traditional candlestick pattern is not that regular; it moves in an ebb and flow pattern however in the modern candlestick pattern in the lower chart we see a smooth candlestick pattern in an uptrend. Hence a trend a modern candlestick pattern is clearer than the counter.
Furthermore an uptrend in the modern candlestick pattern consists of upper wicks and the downtrend trend consists of lower wicks. While the candles in the trends of the traditional candlestick pattern do not have such regular wicks.
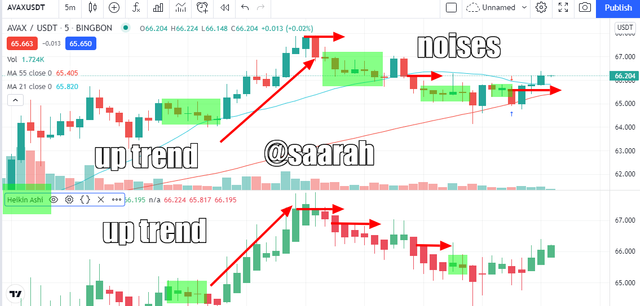
The highlighted patterns are noises and we can clearly see less noises in the modern candlestick pattern. Thus a Heikin-Ashi pattern is more smooth.
Question. 3)
Explain the Heikin-Ashi Formula. (In addition to simply stating the formula, you should provide a clear explanation about the calculation)
The Heikin-Ashi Formula emphasizes on the rule that the opening price of every new candle is based on the data of the previous candle and then the closing price, high and low can be further constructed on the basis of the data of the current candle. Mathematically,
Open = (Open of a previous candle + close of a previous candle)/2
Close = (Open + Close +High + Low of current candle)/4
High = Max value among (High, Open or Close) of the current candle
Low = Min value among (Low, open, close) of the current candle
In the chart below we have considered two candles one as current and the other as the previous we have marked their different levels.
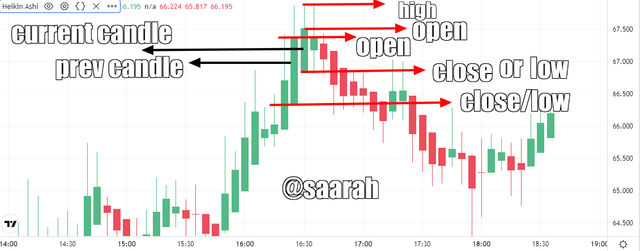
For calculating the opening price of the current candle we will have to sum the open and close prices of the previous candle and then divide the sum by 2.
To calculate the closing price of the current candle we will have to add Open, Close, High, Low prices of the current candle and then divide the result by four.
The high value is taken as the highest value among the high, open and close values of the current candle.
The low value is taken as the lowest value among the low, open and close values of the current candle
Question. 4)
Graphically explain trends and buying opportunities through Heikin-Ashi Candles. (Screenshots required)
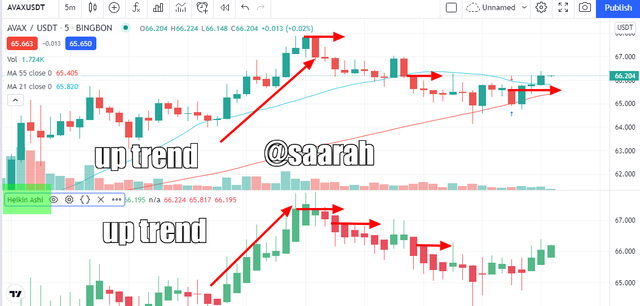
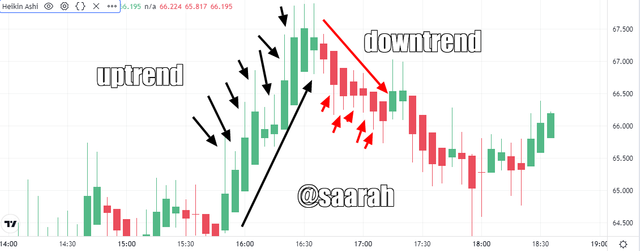
In the chart below we see bullish candles with wicks pointing upward and the bearish candles with wicks below the body. The bullish candles constitute an uptrend whereas the bearish candles constitute a downtrend. Thus from this demonstration we got to know that when the wicks are above the body the market trend will be bullish and when the wicks are below the body the market trend is bearish.
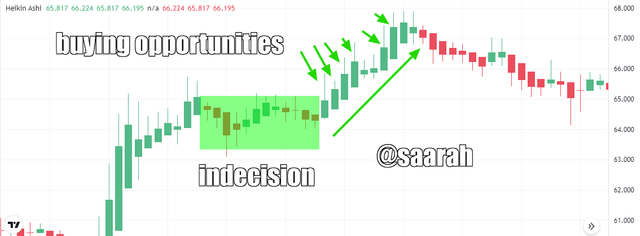
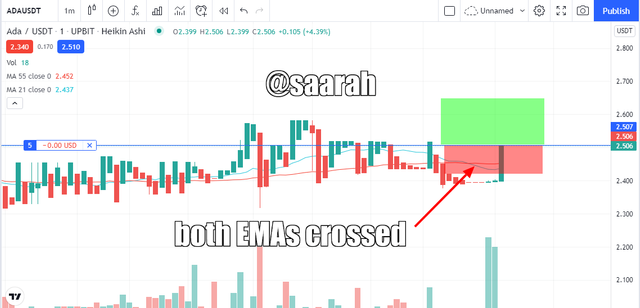
For buying opportunities you have to look for an area of indecision. The indecision area is a sideways market structure in which there is a corresponding population of the buyers and sellers. Once the indecision is over the market shows a definite direction. If after the indecision period you notice bullish candles with wicks above the body you may see various buying opportunities as indicated in the chart below.
Question. 5)
Is it possible to transact only with signals received using the Heikin-Ashi Technique? Explain the reasons for your answer.
There is no definite but a situational answer to this question. Many schools of thoughts believe in the fact that no single indicator or tool can give 100% satisfying results or signals. For this reason experienced traders use combinations of indicators such as the volume indicators and the oscillators. The most commonly used are the volume RSI and the MACD, or RSI.
In the same sense using Heikin-Ashi Technique alone without any other indicators can give false signals keeping in view the highly volatile nature of the crypto market. But many others say that since it gives average data, using it alone by comparing it with the current market for identifying the right trading signals can be a good trade setup too.
But whenever I use Heikin-Ashi Technique I use it with other indicators for more accurate signals. It is because due to the volatile market behavior I think It is not very reliable to be used alone.
Question. 6)
By using a Demo account, perform both Buy and Sell orders using Heikin-Ashi+ 55 EMA+21 EMA.
Sell order
In the ETH/USDT chart below I saw a sell opportunity
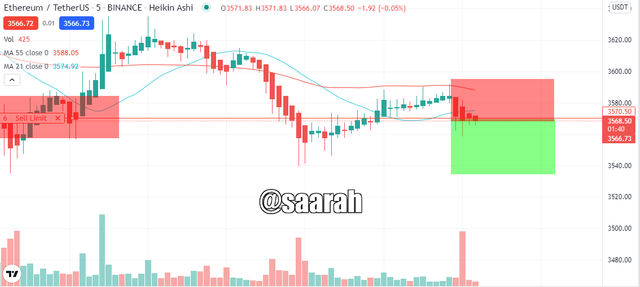
The two EMAs crossed and the market was in the period of indecision for some time. After that the market showed bearish candles. I placed the sell order after it crossed the EMA line. The trade went well
I closed the position after taking a profit of 51.80$ although it was earlier to my take profit level but since it was a risky trade therefore I decided to make a safe move.
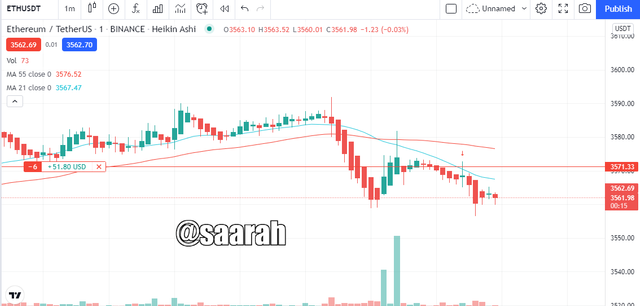
Buy order

The market was moving downward for a while, the EMAs. When I saw the two EMAs crossing I waited for the formation of 2 to 3 bearish candles. When I saw a long bull candle I placed the buy order. The take profit to stop loss was set to 2:1.
Conclusion
Heikin-Ashi when used along with the moving averages provides one of the accurate trade setups. It is widely used by traders. The modernization of the traditional candlestick pattern proved very valuable for better understanding of the market. The only drawback of this pattern is that it may falsify during many volatile seasons of the market.