Crypto Academy Season 4 | Intermediate Level Course for Week 5 : [ Trading with Accumulation / Distribution ] by @allbert
Hello everybody, Hope you all are fine and in good health!
This post is a Homework Task assigned by professor @allbert which is about Trading with Accumulation / Distribution
.jpg)

Explain in your own words what the A/D Indicator is and how and why it relates to volume. (Screenshots needed).
Indicators are key analysis tools they are used to understand the price action and market structure. The A/D indicators are one of the very-useful indicators that combine the impact of volume and price changes on the movement of the market of an asset. It was developed by Marc Chaikin and focuses on the major two phases of the market that are the accumulation and distribution phases of the market.
The accumulation phase indicates that there is high buying pressure and the buyers have dominated the market and there is sufficient demand of the coin and the bullish price trend is strong. The distribution phase of the market marks the dominance of the sellers and more supply of the coins.
The A/D is related to the volume as it relates to the price action and strength based on the volume changes. During the up-trending price movement, an increasing A/D indicates that there is a sufficiently high buying transaction volume and thus the trend is strong similarly If the price is increasing but the A/D shows a bearish divergence it is the direct indication that there is no sufficient buying volume to support the trend and thus after some time the price breaks.
The indicator consists of a single line that oscillates on a scale the direction of the A/D line is very important in determining the strength of the trend as discussed above.
The only problem with the indicator is that it is not very reactive to small signals and is thus not very sensitive and that is why it must be used with other indicators such as the RSI.
Through some platforms, show the process of how to place the A/D Indicator (Screenshots needed).
I will be using tradingview.com
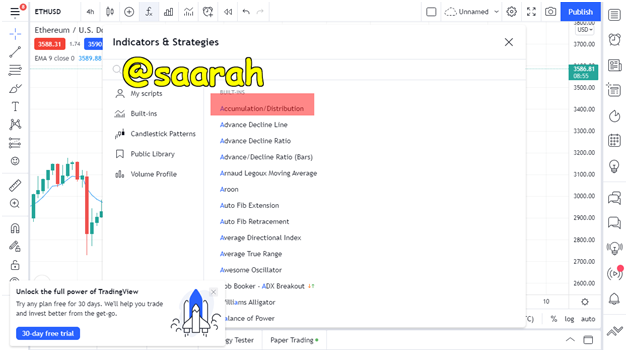
First go to the tradingview website and select charts of your choice The click on the (fx)/ indicators option
From the menu select your desired indicator or search its name
Then lastly click on it to add it in the chart After adding it to the chart you can configure different settings by clicking on the settings option in the bar aside the name of the indicator
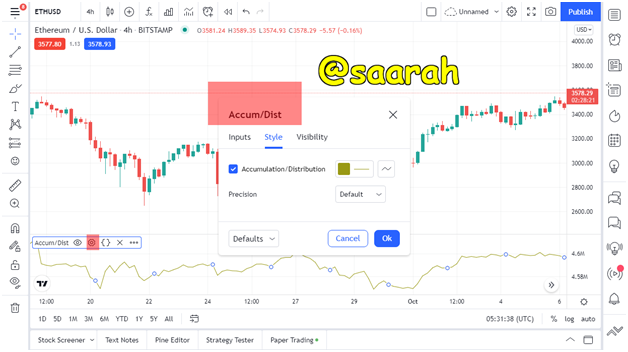
Here are the settings for the style but you can also change the period setting or the thickness of the A/D line and its visibility etc
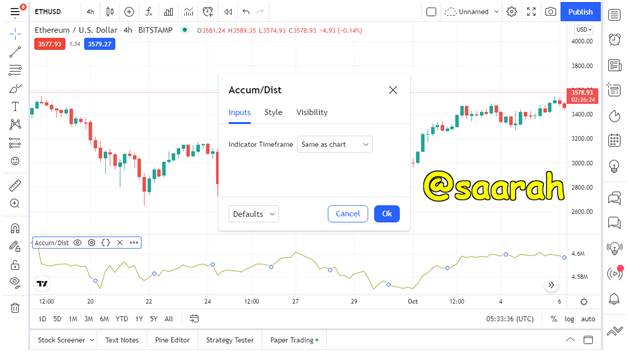
Here I have kept the period settings similar to the chart
Explain through an example the formula of the A/D Indicator. (Originality will be taken into account).
The formula of the A/D indicator is divided into three simple steps
- Calculation of MFM
- Calculation of MFV
- Summation of previous value of A/D and MFV to calculate A/D
The Money Flow Multiplier = (CP – LP) - (HP – CP) / (HP – LP)
CP is the closing price of the asset
LP is the lowest price point of the asset in the selected period
HP is the highest price point of the asset in the selected period
The recent Money Flow Volume =The Money Flow Multiplier X The Volume at the current period
Accumulation/Distribution Indicator =the previous value of A/D + The recent Money Flow Volume
Let’s take an example for better understanding
Close price = $6
Low price = $8
High price = $10
CMFV = 300
Previous Period AD = 380
The Money Flow Multiplier = (CP – LP) - (HP – CP) / (HP – LP)
The Money Flow Multiplier= (6-8)-(10-8)/10-8=-2
The recent Money Flow Volume =The Money Flow Multiplier X The Volume at the current period
-2 X 300 = -600
Accumulation/Distribution Indicator =the previous value of A/D + The recent Money Flow Volume
A/D = 380-600= -220
How is it possible to detect and confirm a trend through the A/D indicator? (Screenshots needed)
In this part of the post I will explain how A/D indicator can be used to study trends.
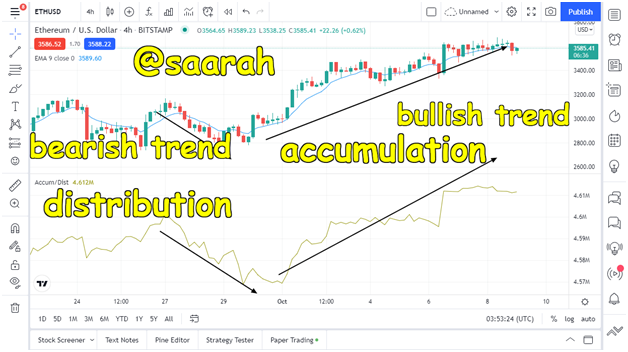
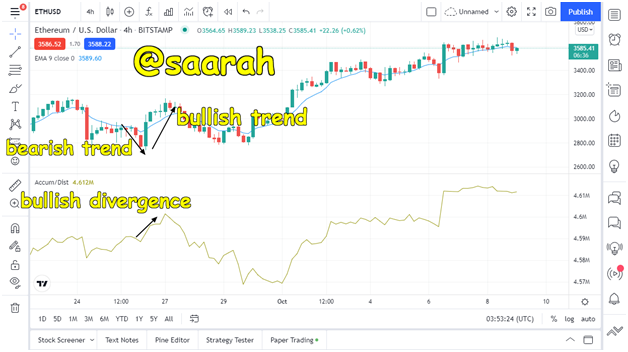
Bullish Trend
When the price action of an asset is continuously increasing and the A/D line is also increasing then this stage of the market is called the accumulation phase. The accumulation phase indicates that there is a high buying pressure as the volume for transaction is inclined towards the buyers. The accumulation zone is clearly visible in the ETH/USDT chart below when the upward motion and upward movement of the A/D are seen together.
Bearish trend
When the price action of an asset is continuously decreasing and the A/D line is also decreasing then this stage of the market is called the distribution zone. The distribution zone indicates that there is a high selling pressure as the volume for the transaction is inclined towards the sellers. The distribution zone is clearly visible in the ETH/USDT chart below when the down trend motion and downward movement of the A/D are seen together.
Divergence
Divergence is the pattern of the chart in which the movement of the indicator is opposite to that of the price action. These divergence patterns indicate price reversals as they indicate the strength of the trend is decreasing because the trading volume may not be enough to support the current trend. In the ETH/USDT chart below we see a bearish trend but A/D showed a bullish divergence after which the price reversed to bullish.
Through a DEMO account, perform one trading operation (BUY or SELL) using the A/D Indicator only. (Screenshots needed).
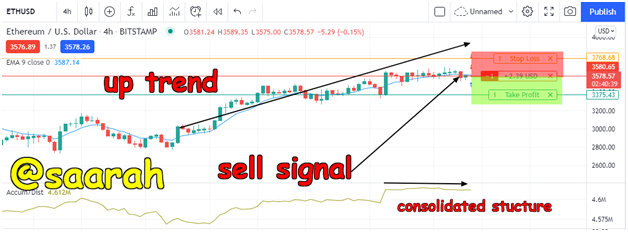
The above chart is the demonstration of a sell signal using the A/D setup. In the A/D setup we look for the divergence patterns to predict trend shifts and then place trade signals accordingly.
The current state of the market was bullish the A/D line was also rising with the price after some time A/D started showing a straight line although the straight line was still bullish. This indicated a contradiction in the price movement and A/D indicator I took it has a trading signal but waited for the price line to show a bearish candle once the bearish candle was successfully observed I placed the sell order. The take-profit and stop loss was in the ratio 1:1 the trade started going in profit but I did not close my position because the trend was seemed to have more downtrendning potential.
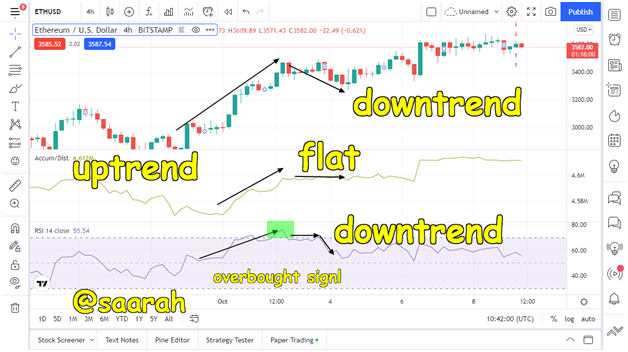
What other indicator can be used in conjunction with the A/D Indicator. Justify, explain and test. (Screenshots needed).
The fact that a single indicator cannot cover all aspects of the market is why we need more than one indicator. Traders use different indicators with A/D to form a better trade setup one such combination would be by using RSI.
In the chart below we see that the price line was trending up. The A/D also showed similar motion and the up-trend was confirmed when the RSI also showed an up-trending motion until an overbought condition was reached.
In RSI the overbought signal is the indication of an upcoming trend shift. After the overbought signal was over the market showed a downtrend although it was not so pronounced but it was a decrease in the market price. The A/D line shoed a consolidated structure indicating that there is a proportionate buying and selling pressure according to trading volume.
To confirm it was consolidated market and n to a strong downtrend we looked to RSI which also confirmed that after an initial downtrend the market did not have any trend and placing a trade signal would not do much here.
However the A/D was too quick to become flat although the price went bearish for some time and that for me a false signal the RSI indicator in this scenario helped me to identify a small bearish trend that could have been profitable if a sell signal would have been placed here.
Conclusion
from the last question I incurred that A/D is not very sensitive however it can be very beneficial if used along with other indicators. Its divergence patterns are reliable and traders wisely use them to place trading signals. it develops a connection between volume and price action and determines its accurate strength in a trend.
Regard
@saarah