Steemit Crypto Academy Season 4 - Homework Post for Task 10: Candlestick Patterns by @ryzsfa
Hello,
Professor @reminiscence01, I’m very grateful for your humble service as a Steemit crypto Academy professor and I’m also very glad to be your student. My sincere regards to other professors as well.
Here I’ll be present my homework accordingly based on the questions.
Topic is Candlestick Pattern.


b) In your own words, explain why the Japanese Candlestick chart is the most used in the financial market.
c) Describe a bullish and a bearish candle. Also, explain its anatomy. (Original screenshot required)

1a) Explain the Japanese candlestick chart? (Original screenshot required).
The Japanese candlestick chart is a very popular chart which is widely used in all parts of the world by investors. At first creation of the candlestick by a rice trader called Munehisa Homma in the year 1770s was used to make technical analysis of charts and also determine the price change of assets. This concept introduced into the rice trading made Munehisa Homma flourish in the rice market and he’s now considered a legend in rice trading.
The Japanese candlestick has become widely known due to its service and purpose. Thus, it shows investors the price movement whether it’s an upward movement or a downward with the help of distinct colors. These colors is mainly to signal traders the price movements.
This literally help traders or investors make good decisions on trades. This is also because the Japanese candlestick fill in traders on crypto currencies by displaying price changes of assets within a period of time showing the highest and lowest price at that time period.
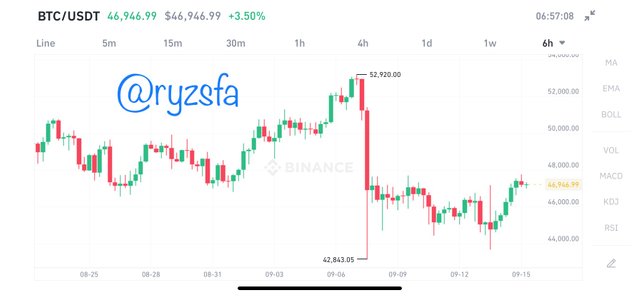
Here is a typical example from the binance exchange. Time period is 6h.

b) In your own words, explain why the Japanese Candlestick chart is the most used in the financial market.
First of all, I made a statement earlier on that the Japanese candlestick is a widely used tool worldwide. This is because these candlesticks presents accurate analysis of price movements of assets within a specific time period. Not only that, these candlestick is displayed in a graphical form which however denotes with the help of different colors a bullish and a bearish candlestick at given time period.
This graphical representation illustrating the highest and lowest price of an asset at a time period really aids investors in decision making.
c) Describe a bullish and a bearish candle. Also, explain its anatomy. (Original screenshot required)
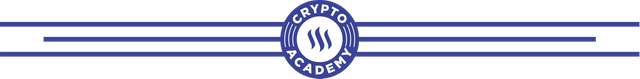
Bullish candle
A bullish candle generally signifies an uptrend in price movements. It tells investors that the price of the asset is certainly rising due to the dominance of buyers in the market. For a bullish candle, the open price is obviously below the close price of the asset since a bullish candle is said to be rising.
For a bullish candle it is mostly denoted by a green color at default.
Anatomy Of A Bullish Candle.
The bullish consist of the high, Low, Open and close which are its components. Here I will explain its functions accordingly.
This show the extreme price the asset has reached at a given time.
This shows the worst price the asset has reached at a given period of time.
This displays the starting price movements of an asset in a given time where it’s an upward movement for a bullish candle.
This displays the last price of an asset in a given time period.
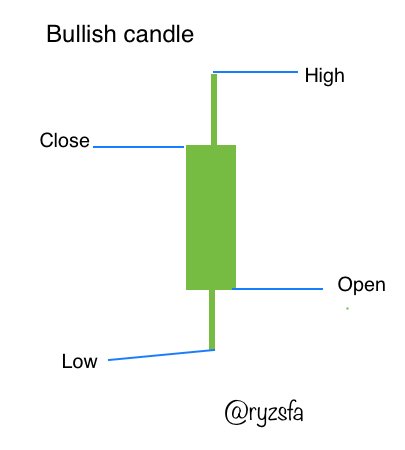
Bearish candle
A bearish candle signifies a downtrend in price movements. It tells investors that the price of the asset is fairly falling due to the dominance of sellers in the market. Considering a bearish candle, the open price is strictly above the close price of the asset since a bearish candle is said to be falling.
A bearish candle it is mostly denoted by a red color at default.
Anatomy Of A Bearish Candle.
The bearish consist of the high, Low, close and open as it components just like the bullish candle. Equally I will like to explain its functions accordingly.
This show the extreme price the asset has reached at a given time.
This shows the worst price the asset has reached at a given period of time.
This displays the starting price movements of an asset in a given time where it’s a downward movement for a bearish candle.
This displays the last price of an asset in a given time period.
Thank you.