Technical Indicators 2 - Crypto Academy / S4W4- Homework Post for @reminiscence01.


Thankyou Profesor @reminiscence01 for being our teacher in this class.
Technical Indicators are an excellent tool for analyzing the cryptocurrency market. In previous lesson by Professor @reminiscence0, we were introduced to technical indicators, now we continue the material about technical indicators more deeply.
Leading indicators is techical indicator that can show which direction the price of an asset in the market will move. This indicator precedes the price movement of the crypto tokens that we are monitoring so that it helps us anticipate future price movements.
Leading indicators are often used when the price of an asset in the market has moved and is used as a tool to assist investors in making decisions. So it is very suitable for analyzing market movements in the short or medium term.
Leading Indicator has the advantage of predicting the price of an asset that will have a big advantage in the market. This indicator can confirm price movements from just 1 candle and it helps in making quick entry decisions. However, this indicator tends to make us react too quickly to price movements, so we are often trapped in false signals. So, trading using the this indicators seems risky but tricky.
There are many technical indicators that can be classified as leading indicators. For example, the leading indicators that often used are:
•Stochastics
•Fibonacci
•Relative Vigor Index (RVI)
•Relative Strength Index (RSI).
The lagging indicator is an indicator that will confirm the price pattern after a trend is formed. This indicator is very important because sometimes many of the leading indicators used are unstable, and short-term fluctuations in them can obscure turning points or cause false signals.
Because this indicator can only be seen after the price movement occurs, so it has a predictive quality that is not too high. The lagging indicator is weak when there is no trending period but very useful during trending periods.
The focus of this indicator is more on signals during a trend, when there is no trend, this indicator will give less buy and sell signals. Lagging indicators that are more focused on trends make us slow to react so that it will reduce our profits in the market.
There are many technical indicators that can be classified as lagging indicators. For example, the lagging indicators that often used are:
•Bollinger Band
•Moving Average
•MACD
•Parabolic SAR
For good results it is better to combine these two types of indicators, because they can complement each other's weaknesses.
Answering question 1.b, I chose the leading indicator stochastics to describe what is happening on the chart. As we know, leading indicators have the advantage of predicting future price movements.
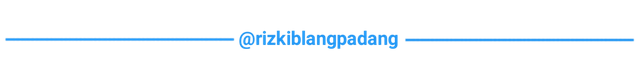
Stochastics indicator has two lines namely K and D drawn at the numbers "20" and "80" as a warning signal. A number that exceeds "80" is an overbought condition or a "sell" signal, and if the curve falls below "20", an oversold condition or a "buy" signal appears.
It can be seen on the chart below that the overbought and oversold zones have been above 80 and below 20 respectively. So that is a signal to sell on overbought and a signal to buy on oversold.
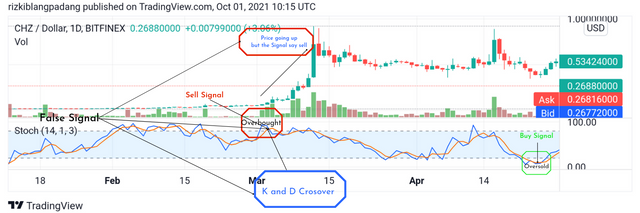
From the chart we can also see that there are false signals in the overbought zone. When the K line and D line cross, it is a signal for us to sell, but it turns out that the price of the CHZ token does not decrease and even goes up. So here the leading indicator gives a false signal, so if we follow the signal we will lose profit.
Of course, this is the weakness of this indicator, so it is not recommended that we only rely on one indicator to read market movements.
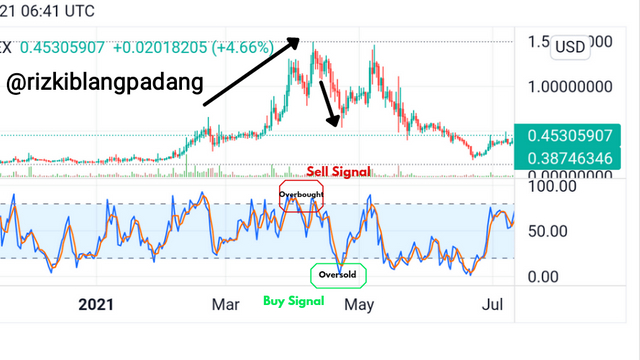
I chose Bollinger band indicator to explain the market reaction to lagging indicators in the chart. Bollinger bands are indicators that have been around for a long time in the trading world. This indicator can only be seen after the price movement occurs, so it often lagging.
Bollinger band consist of three types of lines, namely the upper band, middle band, and lower band. The upper and lower bands are the standard deviation of the middle band. Meanwhile, the middle band is a simple moving average. This indicator gives a buy signal when the price is in the lower band and a sell signal when the price is above the upper band. However, this does not always apply because it will depend on the trend.
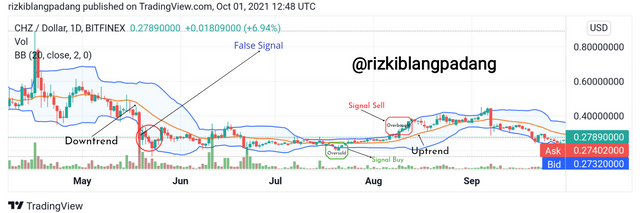
The trend can be seen from the SMA or midle band that goes up and down, when it goes down, it means there is a downtrend and vice versa if the middle band moves towards the top, there is an uptrend. False signals also occur in the Bollinger Band, when a BUY signal appears but the price does not go up and tends to fall and also when a SELL signal appears but the price is rising.
Our trading strategy is an important factor to understand before using technical indicators. This is a basic understanding for investors, to synchronize their strategy with the technical indicators of their choice. When there is an understanding of trading, it will be easier to choose a technical indicator that is suitable for us to trade.
For example, our market strategy looks at the market trend that is happening, it will be more suitable if we use trend-based indicators such as Moving Average, Parabolic SAR, dan On balance volume.
There are so many indicators that we can use to help us trade. After understanding how our trading strategy is, the next thing that becomes our consideration is how we have to understand the types of indicators that we will use. Understand about the types of indicators and their respective uses. It really helps us in making our choices to fit our trading strategy.
In general, there are several types of indicators including trend base indicators, momentum base indicators, Volatility based indicators as well as what we just learned about leading indicators and lagging indicators.
To use technical indicators, we have to study the market. Due to the highly dynamic fluctuations of the cryptocurrency market, we need to adapt our chosen technical indicators to the state of the market.
Market conditions will determine what indicators we use. For example, when there is a trend, the indicator we use is a trend based indicator. Likewise, when the market is sideway, it is better to use momentum-based indicators as well as volatility-based indicators.
One indicator that we use in the chart is often unconvincing, so we need another form of technical analysis to confirm the signals given by the indicator. The same signal information provided by various tools in the chart is a confluence.
For example, using a combination of Bollinger Bands with support and resistance levels. When the price reaches the upper band it means that it has been overbought and if the upper band coincides with the resistance level, a downward movement is likely to occur.
As we all know, confluence in cryptocurrency refers to a situation when several tools give the same signal. Combinations of technical indicators often produce Confluence but sometimes it can also be a price pattern or price action.
In the case of a good entry, for example, we need confirmation from several technical indicators to state that the signal we received is correct. Although that's not the main goal of confluence, but for a beginner like me it's an important to understand.
For this reason, some traders fill their charts with multiple indicators because they want to get Confluence. For beginners like me whose knowledge of the trading world is still very limited, I can only use indicators on the chart according to my understanding.
Below is a chart of the STEEM/USD I chose to briefly explain the confluence of buy and sell entry signals.
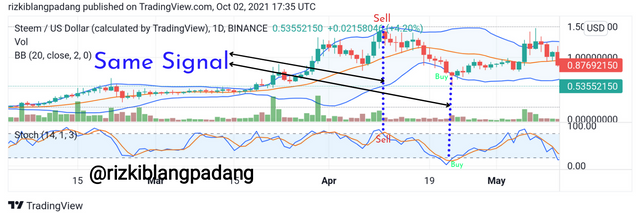
I chose to combine leading indicators and lagging indicators namely stochastics and bollinger bands in the chart. On the chart above we can see that the sell and buy signals on both indicators show similarities. In the overbought zone, both indicators agreed that it was time for us to sell the asset, the same thing happened to the buy signal.
We often find that sometimes technical indicators give us false signals so we are trapped if we don't pay close attention to price movements. If we believe too much in indicators without paying attention to price movements, we can be very misled.
We can see on the CHZ chart below, how the stochastics indicator has given a sell signal while the price is increasing. So if we follow the indicator's signal without first filtering the price trend, we might lose profit.
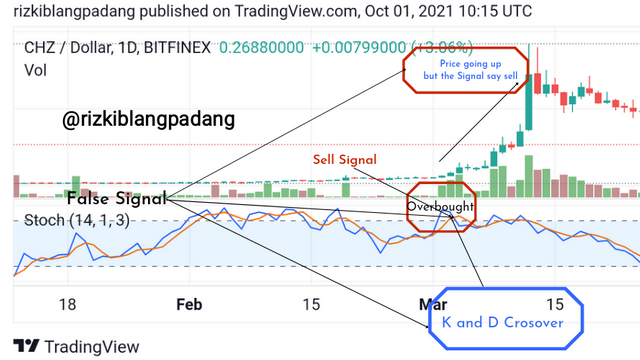
As I said at the beginning, technical indicators are tools that cannot stand alone so they often give false signals for beginners who are just starting to trade like me. The key is not to rely too much on indicators alone, so that we forget to observe the market.
Divergence is an early sign of a trend change that can indicate when the trend is weakening. When a trend is moving in one direction, the real forces are getting ready to reverse. In simple language, divergence is a useful pattern for providing information about the potential direction of a strong trend. Divergence itself is useful for us to be able to identify when a trend will continue and when a trend starts to slow down and even tends to reverse direction or reversal.
In the world of trading, there are two types of divergent, namely bullish divergent and bearish divergent. Bullish divergent occurs when the price is in a lower to a low position while the indicators are in a higher to a low position. This indicates an indication of a trend reversal (reversal) from a down trend to an uptrend (bullish). On the other hand, bearish divergent occurs when the price reaches a higher to high condition while the indicators are in a lower to high position. This condition shows an indication of a trend reversal (reversal) from an uptrend to a downtrend (bearish).
Divergent signals are very helpful for us to see whether a trend will continue its movement or whether a trend will weaken and potentially experience a reversal. It certainly really helps us in trading.
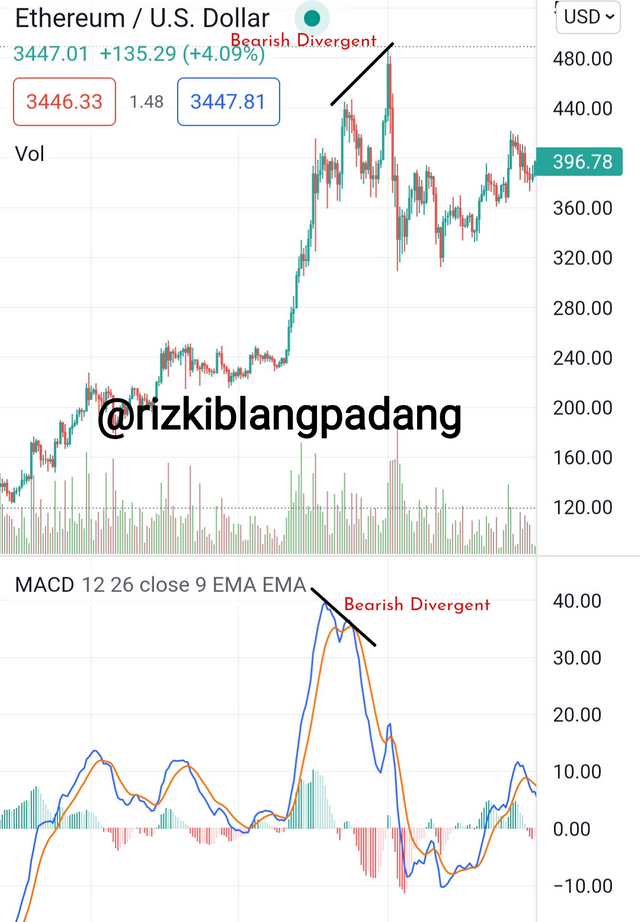
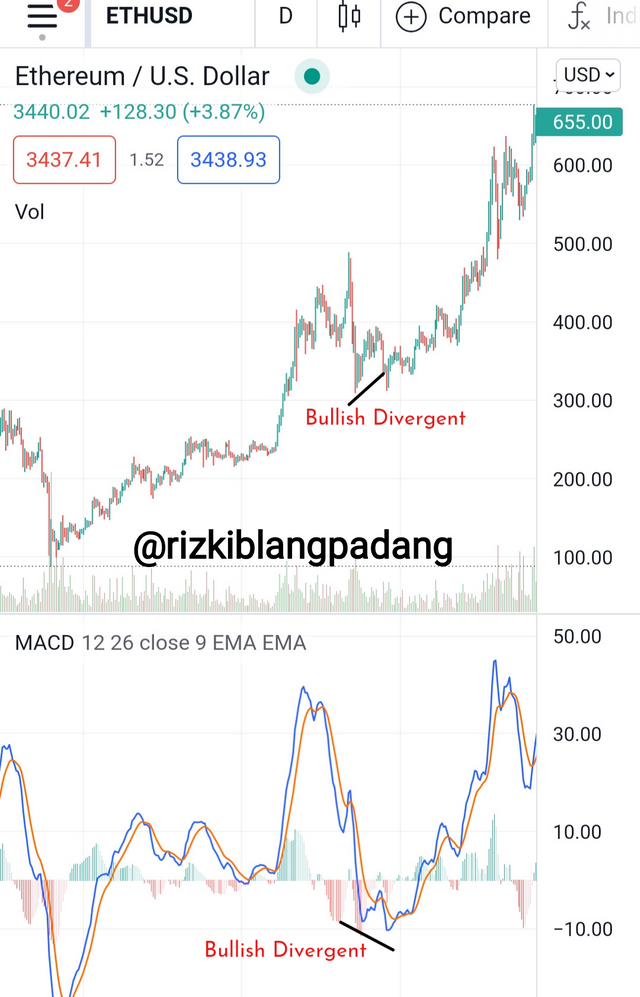
To explain the Bullish Divergent and Bearish Divergent, ETH/USD is my choice and the Technical indicator I use is MACD. Let's look at the following chart.
I will explain Bearish Divergent first. In the chart below, it can be seen that at the highest level of the price there was an uptrend in the price, but MACD reacted on the contrary starting to see a downtrend in the price. It is a bearish divergent signal, as a sign that the trend will soon change. It's true that the ETH/USD price trend changes instantly.
The chart below shows a bullish divergence on ETH/USD, where the price shows that the chart continues to decline, while the indicators show a bullish divergent signal, which is a sign that a reversal is likely to occur.
Leading Indicators and Lagging Indicators are two types of indicators in the trading world, each with their own advantages and disadvantages. As an indicator that cannot stand alone, it must be complemented by other indicators so that the trading we do is successful.
One of the combinations of indicators is convergence, which uses not only technical indicators but also price movements. Besides that, we can also see opportunities by understanding bullish and bearish divergents.
That's my little understanding of technical indicators. Of course, there are still many mistakes and shortcomings in this homework post. Thank you to my brothers at TSS who never get tired of guiding and directing me. You Are Amazing, Guys.

Hello @rizkiblangpadang , I’m glad you participated in the 4th week Season 4 of the Beginner’s class at the Steemit Crypto Academy. Your grades in this task are as follows:
Recommendation / Feedback:
Thank you for participating in this homework task.