Double Top and Wedge Trading - Crypto Academy S6W2 - Homework Post for @imagen
I have quit about 10 months ago from steemit because I was busy, during these 10 months I spent more time trading. Now after one of my friends informed me that in Steemit a cryptocurrency community was formed, I was interested and immediately tried it. This is the second homework that I have completed this second week

1). Explain in your own words the concepts of Double Top, Double Bottom and Wedges. How to interpret each?
Double top
Double tops often occur when prices form at the end of a bull market. At market price vs. the time chart, it appears as two consecutive peaks at roughly the same price. The lowest price between the two peaks is the valley . The price level at this minimum is known as the formed neckline. The formation is completed and confirmed when the price drops below the neckline, which indicates that further price declines are imminent or very likely.
The double top pattern indicates that demand exceeds supply (buyers dominate) to the first high, causing prices to rise. Then, the balance of supply and demand reverses. Supply exceeds demand (sellers dominate), causing prices to fall. After the price goes down, buyers dominate again and the price goes up. If the trader sees that the price did not break above the first high, the sellers may once again win, lower the price and form a double top. If the price breaks below the neckline, it is usually seen as a bearish signal.
The time between two peaks is also a factor in determining the existence of a double top pattern. If the peaks occur at the same level but in the very near future, they will most likely be part of a merger and the trend will continue.
Quantity is another indicator to explain this shape. The price first peaks when volume increases and then decreases when volume is low. Another attempt until the second peak should be at a lower volume.
Double bottom
The double bottom is a terminal pattern in a downturn in the market. Same with double top, only the price is inversely proportional. The pattern is formed by two minima separated by a local peak that defines the neckline. When the price rises above the neckline, the formation is completed and confirmed, indicating that further price gains are imminent or possible.
Most of the rules related to the double-top style also apply to the double-bottom style. Volume should show clear gains while price is flat at the bottom of the second.
Wedges
The wedge mostly appears on the way up or down, because it doesn't matter whether it's a strong uptrend or a sharp downtrend, the price can't keep going up or down, and there will be time for a break.
When the market is on a break, the trend K-line tends to be wedge-shaped. The wedge shape can also be said to be a gas station for a bull or a bear, generally does not last long, once the gas is filled, the price will start again. Wedges can generally be divided into rising wedges and falling wedges.
2). The main difference between Double Top and Double Bottom. Show screenshot.
The main differences between Double top and Double bottom are among others.
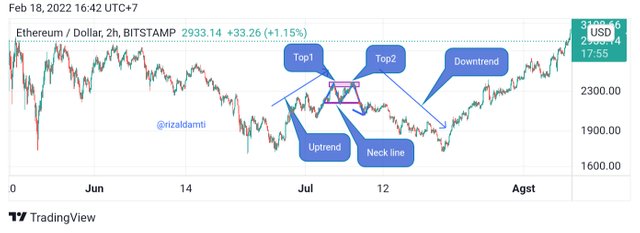
In Double top the pattern is as follows:
- First the price will go down creating a First High and going down.
- Then with residual buying pressure, the price will create a temporary HigherLow and Neckline.
- The price continues to rise creating a Second High but this Second High prevents the price from going higher than the First High.
- The price then went up and broke the neckline to confirm the double top pattern was completed and the reversal was confirmed.
Double top
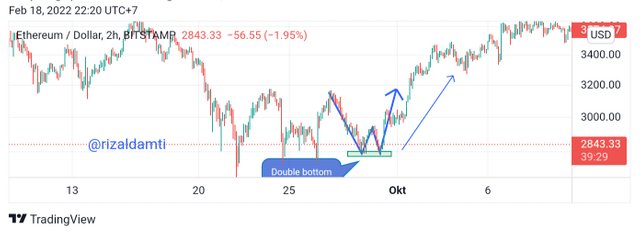
While in Double bottom the pattern is as follows:
- First the price will go down creating a First Low and go up.
- Then with the remaining selling pressure the price will create a temporary Lower High and Neckline.
- The price continued to fall creating a Second Low but this Second Low prevented the price from going lower than the First Low.
- Then the price went up and broke the neckline to confirm the double bottom pattern was completed and the reversal was confirmed.
Double bottom
3). Describe and highlight the main differences between a bullish wedge and a bearish wedge. Show screenshots of each.
To answer this question I will define what is a wedge?, The wedge pattern is a price pattern that occurs after an up or down trend, predicts a continuation of the trend or a possible reversal of the previous trend that has occurred and this wedge pattern will usually appear in the correction phase. When the uptrend or downtrend weakens.
The main differences between Bullish wedge and Bearish wedge include :
Bullish wedge is a pattern that has 2 trend lines that slope upwards (towards) and meet at a point.
Then the Bullish Slice can appear after an uptrend or downtrend. Breaking the trendline (wedge) will become a downtrend.
Even though it consists of 2 ascending trend lines, but as purchasing power starts to weaken, it is not strong enough to push the price higher.
This is indicated by the peaks formed in the Bullish wedge pattern which continues to increase in the form of new peaks that are lower than the old ones.
Bullish Slice
Whereas the Bearish Slice is :
A pattern with two trend lines sloping down (towards the bottom) and meeting at one point.
Then the Bearish Slice can appear after an uptrend or downtrend. Breaking the trend line ( wedge) will be an uptrend.
Even though it consists of 2 descending trend lines, because the selling power is starting to weaken, it is not strong enough to push the price down.
This is indicated by the low created in the Bearish wedge pattern in the form of a new bottom that is lower than the old one.
Bearish Slice
4). Subscribe the volatility that usually exists with respect to volume in wedges. When is there usually more volume? What happens if the pullback breaks the wedge support?
Talking about volatility, of course, when the volatility is high, there is a sharp decrease or increase in prices. Or it can be said, volatility is an indicator used to show the stability of the financial market, whether trading with a wedge pattern or with other patterns.
The amount of trading volume depends on the market situation, if the market is Bullish, the trading volume will increase sharply this is caused by traders who trade either selling or buying in the hope that the price of the asset will be bullish than before.
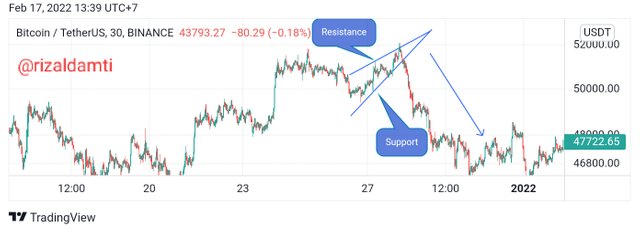
The next pullback occurs when the price breaks the wedge support level, then returns to the previous breakout position, the wedge support now acts as resistance and the price continues to move lower than before.
When the price finds a solid resistance level but then breaks it, then we who do not anticipate this breakout and sell before it happens, the position will be lost when the price rises and also breaks the resistance level.
However, when the price drops back to the previously broken resistance level, those of us who have been selling will want to close our positions once losses are minimized. And as we know closing a short position means buying. This action creates buying pressure thus pushing the price higher than before.
In this situation, traders will see that the previously formed resistance is now acting as support. So there will be participants who buy this point. This additional buying pressure together with previously closed short positions has added buying pressure and could create momentum for a new uptrend.
5). Find and analyze the double top pattern on at least 2 charts. Show your own screenshot.
Two Tops (Two consecutive highs) - a technical analysis term for two consecutive increases at the same price in a security. On the chart, this looks like an M-shaped. The specific price level at two consecutive highs that occurred is considered a resistance level for the stock, as Technical technical analysts believe that a troubled security rose above that level, the opposite of the two lows (two lows consecutive).
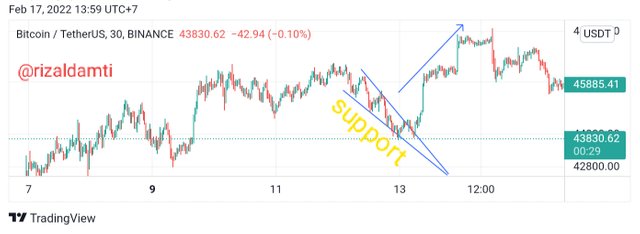
Volume is a great tool for determining the momentum of the current trend.
The bullish wave that made the first peak was supported by a very good increase in volume.
As shown in the BTC/tetherUS 2h chart below.
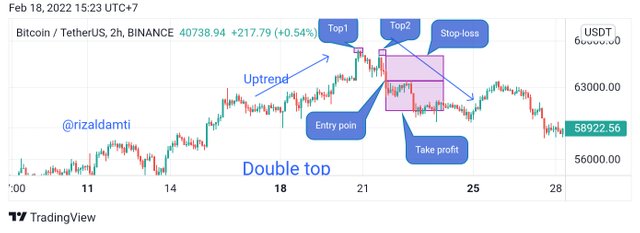
BTC/USDT
- The price continued to press down but below the support of the previous bullish wave the price pushed up again creating a second peak.
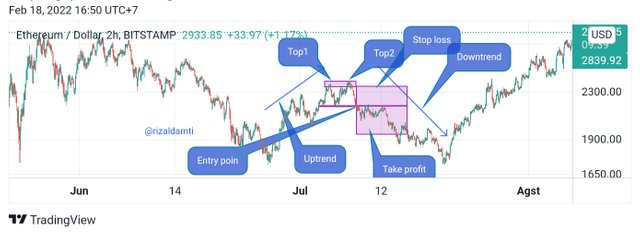
ETH/USDT
But how do you see the volume of the second wave? The volume of the second wave is gradually decreasing, indicating that now the price has no motivation to advance further.
Now a double top pattern is formed and if you enter a sell order here, you will have a very high win rate.
6). Find and analyze at least 2 rising and 2 falling wedges on at least 2 charts. Show your own screenshot.
One of the patterns used in technical analysis of price charts is the Wedge Pattern. Depending on the case, this could be a price reversal pattern or a continuation pattern.
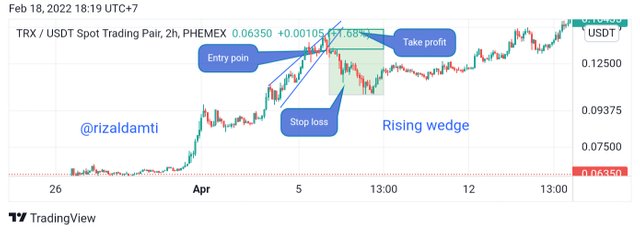
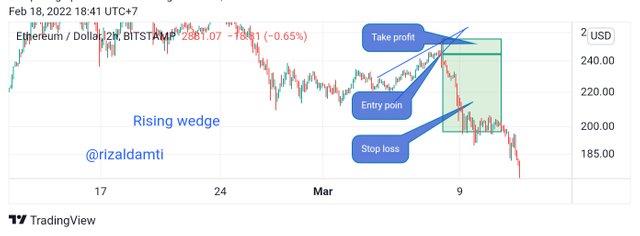
If the rising wedge pattern is in an uptrend, it is a sign of a reversal. Even though in this pattern the next peak is still higher than the previous one, they have a weaker impetus (the slope is decreasing compared to the slope of the support line connecting the trough).
This means that selling pressure increases. At some point the pressure is strong enough (and usually there is underlying support behind it) to break that support and go down.
In my analysis this time I used the ETH/USD and TRX/USDT charts as shown in the screenshot below:
True to its name, the Falling Wedge has a pointed tip that points downwards. Both the support and resistance lines are sloping down.
In my analysis for this falling wedge I also use the ETH/USD and TRX/USDT charts as shown in the screenshot below:
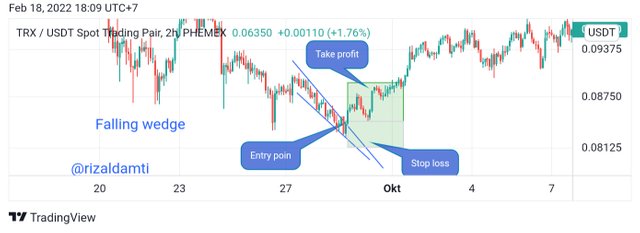
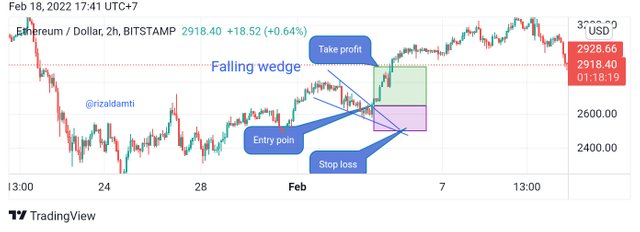
If the falling wedge pattern is in an uptrend, it is a sign that the trend will continue. The “wedge” formation only serves as a pause for accumulation.
If the Falling Wedge pattern is in a downtrend, it is a sign of a trend reversal. During the formation of the “wedge”, although the bottom bottom is still lower than the previous one, the downward force is reduced (indicated by the slope of the support line which is smaller than the slope of the resistance line). The result is usually the price will reverse up.
7). The importance of patterns in technical trading.
Patterns in technical trading are very important because technical analysis works on the premise that prices will move in trends, and these movements often follow patterns that are relatively determined by market sentiment. That is, based on the belief that traders will react the same every time they face the same situation, therefore this technical analysis is very much needed by traders.
Technical patterns in trading do not attempt to measure or value the fundamental value of a particular currency. But it uses indicators, and familiar chart patterns such as wedges, double tops, double bottoms and many more that can be used to predict possible future moves.
Then we can use this pattern to help in reducing the risk, so that we can manage the risk by marking the stop loss in our trade. For example, we want to mark stop losses according to key levels in the price chart, this can minimize the impact of losses on the assets we trade.
The main purpose of this technique is of course to predict and take big profits and we don't swallow losses so that we can disappear and can't invest anymore.
8). Do you find it effective to use these patterns in trading? Justify your answer.
The patterns we have discussed above are certainly very effective for us to use in trading, but we should not be hung up on these patterns alone because it is possible that these patterns give false signals, so we must combine these patterns with several indicators to detect them. false signals that may occur.
With these patterns, it is certainly very helpful for traders to know the direction of the trend that is going on, is the market currently Bullish or Bearish?, they will find out with some of these patterns.
So I can say that the pattern we use in trading will be effective if we do it in the right way based on the results of the analysis and the right strategy according to the pattern we use.
Conclusion
Double top, Double bottom and wedge are trading patterns that are needed by traders to see how the market is currently, so everyone or market participants of this pattern become their reference to invest, of course, be careful and always look at the resulting risks, because almost everyone who trades wants to buy when prices are low and resell when prices are high.
Finally, a big thank you to Professor @imagen for giving an amazing lecture, have a nice day.
Gracias por participar en la Sexta Temporada de la Steemit Crypto Academy.
Espero seguir corrigiendo tus futuras asignaciones, un saludo.