Japanese Candlestick - Steemit Crypto Academy Season 5 - Homework Post for Task 10
Hello steemians. It is another great time at cryptoAcademy. This is my presentation on Japanese Candlesticks by Prof @reminiscence01
1a) Explain the Japanese candlestick chart? (Original screenshot required).
b) In your own words, explain why the Japanese Candlestick chart is the most used in the financial market.
c) Describe a bullish and a bearish candle. Also, explain its anatomy. (Original screenshot required)
Question 1a

Explain the Japanese candlestick chart? (Original screenshot required).
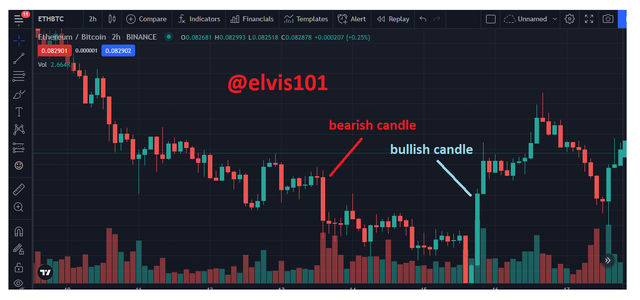
Japanese candlesticks are historically the invention of Homa Munehisa, a rice trader in the 1700s who understood the psychology of supply and demand, which he put forth in the form of a candlestick.
The Japanese candlestick has since been modified and adapted to modern trading because of its usefulness. It is now used on wall street, stocks, and crypto markets.
They are a combination of side-by-side bullish and bearish candles that depict the action of demand and supply, giving a trader information of price action in a market within a particular time frame.
Japanese candlestick charts give an accurate visual representation of the struggle between buyers and sellers in a market. It shows the acceptance and rejection of price by both buyers and sellers in a market.
Japanese candlesticks give us detailed information on price action within a particular time frame i.e., what happened between the time the market opened and the time the market closed and who had the last say in price action within the time frame whether the bulls or the bears.
Where other forms of charts may only show the direction of price, the Japanese candlestick gives the trader insight into both the direction and momentum of price in a market. It does not only show where the market is going or what the market is doing but it shows the trader to what degree the market is doing what it is doing and why it is doing so relative to previous price action.
Japanese candlesticks are grouped into two – Bullish and Bearish candles. The bullish candle is usually represented as a green candle while the bearish candle is represented as a red candle. They both have a body, an open, a close, and a shadow (also referred to as wick or tail).
Question 1b
In your own words, explain why the Japanese Candlestick chart is the most used in the financial market.
- Japanese candlestick is often used in financial markets because they give more accurate and detailed information of price action within a particular time frame.
- They give the trader insight on both momentum and direction of price.
- Unlike lines and bar charts, Japanese candlesticks give a trader a clearer signal of entry position
- They do not just tell the trader what the market is doing, they also tell the trader why the market is doing what it is doing
- Japanese candlestick charts work well with technical indicators than any other form of a chart.
- Though other forms of charts give information on trends in a market, Japanese candlesticks are best for understanding trends including trend continuation and reversal patterns.
Question 1c
Describe a bullish and a bearish candle. Also, explain its anatomy. (Original screenshot required)
- Bullish candlestick
A bullish candle is a candle that closes higher than it opened in a set time frame as depicted by green color in most candlestick charts though they can be changed to other colors.
Using an auction as an analogy, if a one-hour scheduled auction of an asset, say a piece of gold opened at $100 but was later priced at $50 and $60 within the scheduled time before finally sold at $200 at the expiration of the set time, then price can be said to be bullish because the price of the asset closed at a higher rate than it opened even though at some point it was priced below $100.
Note: The wick of a candlestick is a major determinant factor a trader would want to give attention in order to get perfect information on the identity of a candlestick.
Bullish candlestick Pattern
In a trend, a bullish candlestick pattern is a combination of candlesticks that signal trend reversal to the upside when they occur in a downtrend. They have the potential for moving the market upwards. Some notable examples of bullish candlesticks are bullish engulfing pattern, morning star, bullish harami, and hammer, etc.
- Bearish candlestick
A bearish candlestick is a candle that closes lower than it opened depending on the set time frame.
Like in the above analogy, if an auction scheduled for one hour opened at $100 but was finally sold at $50, I dare to say the price is bearish because the auction closed at a lower price than it opened.
Bearish candlestick Pattern
In a trend, a bearish candlestick pattern is a combination of candlesticks that signal trend reversal to the downside when they occur in an uptrend. They have the potential for moving the market downwards. Some notable examples of bearish candlesticks are bearish engulfing pattern, evening star, bearish harami, tweezer bottom, and hammer, etc.
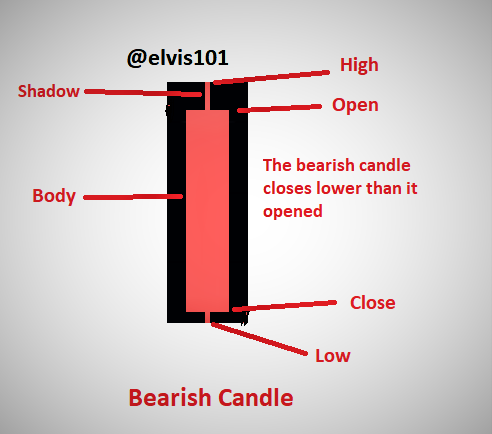
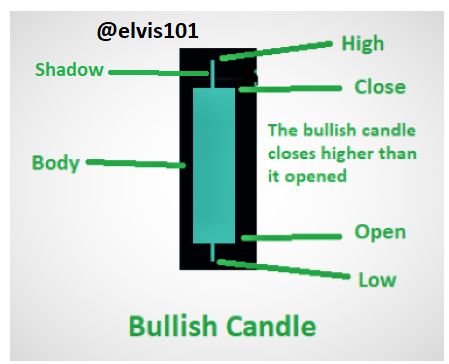
Open: The open is where the traders start to either buy or sell an asset as dictated by a set time frame. For example, on a one-day chart, the open is the first action of traders at the beginning of a new day.
Close: This is where traders close a trade as dictated in a set time frame. For example, on a one-day chart, the close is the last action traders took at the end of the day. It shows whether buyers or sellers had the last say at the end of the day.
Body: The body shows the price action or what happened in the period between the open price and the close price of an asset. The body shows the momentum of price action: it shows to what extent price moved between the open and close price.
The shadow: The shadow shows where price actually moved to before it was eventually rejected. This gives a trader additional insight on whether a candle is bullish or bearish irrespective of the color of the candle.
High: The high of a candle is the highest point price ascended to within a particular time frame.
Low: The low is the lowest point price descended to within a particular time frame.
Japanese candlesticks are simple and easy to understand by a trader. They continue to be the most used charts because they give more detailed information of price action than virtually almost every other trading chart.
However, the simplicity and accuracy of the Japanese candlestick chart do not take away the uncertainties associated with any market traded by humans, so it is really important that as a trader we give time to understanding candlestick patterns and all the other dynamics revolving around trading.
Thank you for reading.
Courtesy: Prof @reminiscence01
Hello @steemcurator02, my post expires tomorrow and it's not yet curated, thank you.