Crypto Academy Week 16 Homework post for prof @fendit on The Wyckoff Method by @rich-ben
Hi everyone, welcome to my homework of post on the wyckoff method of doing market analysis. Thank you so much prof. @fendit for your self explanatory lecture. Now, without wasting much time, I would like to dive straight into the homework post for today. The questions for this post are as follows:

1.Share your understanding on "Composite Man" and the fundamental laws. What's your point of view on them?
The composite man cannot be talked about, without first understanding the Wyckoff method, due to the fact that the Composite man is a sub session of the Wyckoff method of technical analysis. It is against this backdrop that I would first of all talk about the Wyckoff method before going on to explain my understanding on the Composite man, in order for my readers to have a better understanding.
The Wyckoff method was proposed by Richard Demille Wyckoff. He lived in the 20th century and was a Keen student of the market, was a trader and a tape reader. He leartn from the Legendary stock operators of his time. It was by learning from some of the big stock operators of his time such as Jesse Livermore and JP Morgan, that he arrived at the method we refer today as the Wyckoff method. He believed that market prices can be predicted simply by studying informations associated with market volume, price action and also time frames. This study will make such a person understand the supply and demand pattern of the asset under review. From the the above study/analysis entry of long and short positions can be determined. He proposed that the best time to place a long order is when the chart is almost at the end of an accumulation region. On the contrary, he proposed that the best time to enter into a short position is when the supply is becoming greater than the demand.
The Wyckoff method is based on 3 fundamental laws which are:
- The price direction in any market is dependent on the laws of demand and supply
- Cause and Effect: This simply states that no event in the market happens just like that. There is always a cause and effect to every event in the market, he proposed.
- The law of effort vs result: Here, effort talks about the volume of a given asset. Given this law, when there is a relationship between volume and price actions, then we can say that the trend would go on its course, on the contrary, where there is no relationship between volume and price, then we can predict that the trend is about to change.
Note:
A high volume is equal to a Big effort while a low volume/sideways movement is equal to a small effort.
One of the major ideas of the Wyckoff's method is the presence of a composite man. You may be asking the meaning of a composite man. I would be giving a detailed explanation below.
Wyckoff came up with an explanatory tool in order to help understand price actions in the Market. He termed it "Composite Man". From Wyckoff's idea, all the movements in the market were to be analysed as the result of one man's operation. Wyckoff called this man "The Composite Man". According to Wyckoff's theory, this Composite man sits behind the scene and is responsible for price manipulations in the market. If one understands the theory of the composite man, It is to his advantage and people who don't understand this theory are at a risk of making alot of loss. Meaning that the market is controlled by a single entity, rather than a group of people.
This composite man acts selfishly with the intent to buy at a low price and se at a higher price. Wyckoff advised that traders should try to trade the market as the composite man played his game, i.e buy low and sell high.
The following can be outlined from Wyckoff's composite man theory:
- The composite man plans, executes and concludes his campaigns carefully.
- The composite man tries to get the public, buy an asset which he has already accumulated at a very low price. This can be likened to what Elon Musk did when he tweeted that Tesla would now accept bitcoin. It pushed the price up.
- Investors need to study stock charts with the intent to understand the behaviour and motive of those who dominate the market.
- One can have the ability to interpret the motives underlying the actions which a chart portrays by constant study and practise.
PHASES OF THE WYCKOFF TECHNIQUE
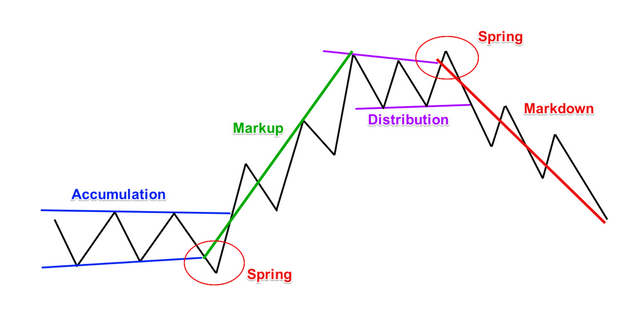
ACCUMULATION PHASE: At this phase, there is no much change in price and volume, therefore the chart moves sideways. This is where the Composite Man accumulates his assets before other investors come in.
MARKUP PHASE: When the accumulation ends, and the supply becomes scarce, the Composite Man will then try to push the price up. Since the asset has more volume and movement, the price will move up. The upward price movement would also attract other investors to buy the asset. The chart at this point portrays a higher demand than the available supply. Sometimes, during the markup phase, we can witness a re-accumulation.
DISTRIBUTION PHASE: At this point the chart portrays a movement sideways due to the fact that the composite man, at this point proceeds to selling off his assets. He does it slowly until the demand is totally absorbed. At this distribution phase, the price reaches its peak and there are only few last moment investors coming into the asset.
THE MARKDOWN PHASE: When the Composite Man is done selling his assets, he would make efforts to push the price down again, so as to buy low again. Usually, supply is greater than demand at this phase due to the fact that the remaining investors would try to sell their assets too because the price at this point gets very bearish.
From my point of view, this technique is a unique one, but it only favours a few investors i.e, those who get into an asset early enough and try to influence others to join, later dumping on the rest of the investors that did not join early enough. Anyone who does not have a proper understanding of this method may tend to lose alot of money due to buying at the distribution phase when the market is about to make a correction. Like I earlier cited an example with what Elon Musk has been doing recently. He bought bitcoin low, sold high and is trying the send the price downward again, probably for him to buy more.
This technique only favours a few who have great influence over the market.
Share a chart of any cryptocurrency of your choice (BTC or ETH won't be taken into account for this work) and analyze it by applying this method. Show clearly the different phases, how the volume changes and give detail of what you're seeing.
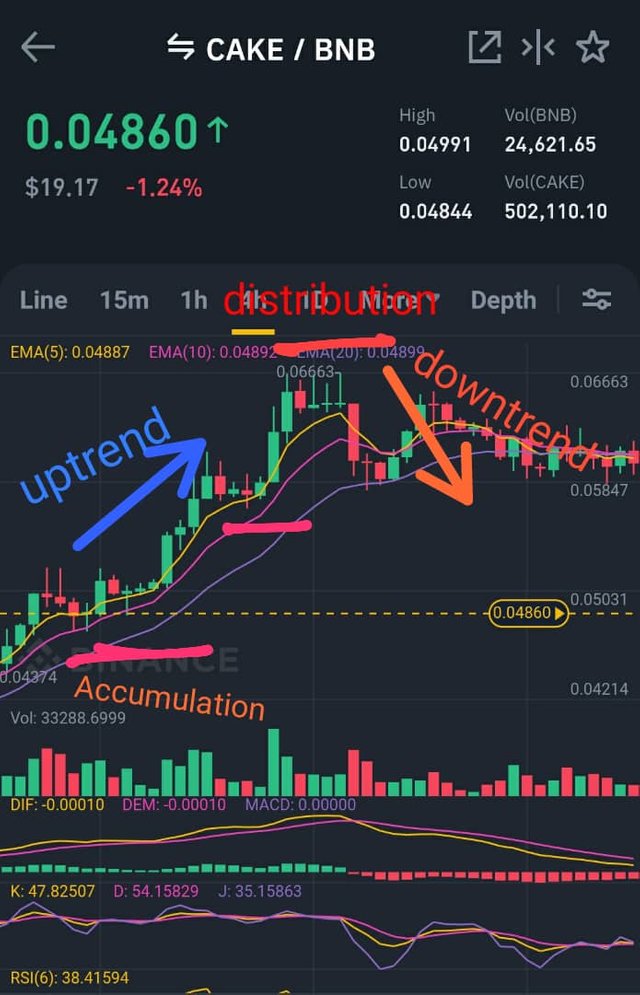
[Source](Binance App)
The above pair is for Cake/Bnb.
The above chart potrays an example of the Wyckoff cycle.
The first phase marked, shows the accumulation phase. At this point, the price does not make any major move. Rather it keeps moving sideways.
Suddenly we can see an increase in volume which further leads to an increase in the price of the asset under review. At a point the Volume reduces and this causes the price action to slow down, hence entering the second marked phase which portrays re-accumulation phase. The volume increases again and sends the price to its peak. when the price gets to its peak, there is another sideways movement at the top portraying the distribution phase, before the markdown/downward price movement.
CONCLUSION
The above technique has its unique advantages and disadvantages. Those who understand this strategy can use it to make a fortune out of the market, but on the contrary few wealthy individuals can use this strategy to manipulate the market in their favour as can be seen in the case of What Elon Musk recently did like I mentioned earlier.
Thank you so much prof. @fendit for this educating lecture.
Thank you for being part of my lecture and completing the task!
My comments:
Explanations were ok, but the most important thing about this task was to be able to point out correctly the pattern in the chart and you didn't.
What you showed as accumulation is clearly already an uptrend, the distribution isn't pointed out, the word's just there. The chart wasn't the best one to point this things out.
Overall score:
4/10