crypto academy season 2 week 4 homework post for prof @kouba01 by @rich-ben: RSI
source
Hello everyone, my name is @rich-ben, I must say a very big thanks to prof @kuoba01 for this detailed lecture. Actually, the lecture came very timely as I have become curious to know how the RSI is works, due to the fact that I hear it a lot when youtube crypto analysts are analysing charts. This has sparked up curiousity in me as to what this RSI means and how it can help my trading. The lecture was very detailed and self explanatory. without much ado, I would quickly dive into getting my homework post done.

WHAT IS RELATIVE STRENGTH INDEX (RSI)?
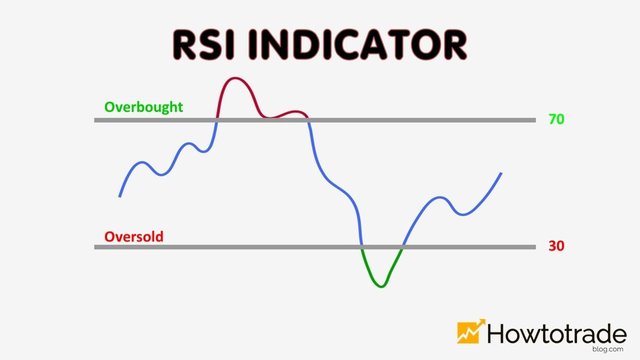
The relative strength index is a tempo indicator used for technical analysis. It is used in evaluating the degree of recent price changes in order to determine oversold or overbought conditions in the price of an asset, security or stock.
It is always represented by an oscillator and usually has a reading that ranges from 0 to 100 in numbers.
traditionally, it is interpreted that values above 70 i.e from 70 up to 100 indicates that an asset is in the overbought region and is imminent for a trend reversal or pull back in the price of such asset. On the other hand, an RSI figure/reading of 30 and below i.e from 30 to 0, indicates an oversold or undervalued asset and maybe set for a trend reversal in the upward direction of the price of such asset.
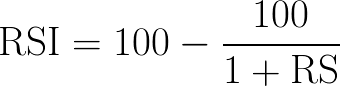
HOW TO CALCULATE RELATIVE STRENGTH INDEX (RSI)
The formular used for the calculation of RSI is given below:
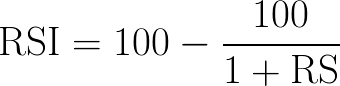
The average gain or loss used in the calculation is the average percentage gain or loss during a look-back period. The formula uses a positive value for the average loss.
source
The usual standard of measurement is using 14 periods in calculating the first RSI value.
With the above formular, we can calculate the RSI of any given asset or security.
NOTE: The RSI usually increases in line with the number and size of positive market closes and falls in tandem with the number and size of losses in price.
CAN THE (RSI) BE TRUSTED IN CRYPTO ANALYSIS?
In crypto trading analysis, the RSI should only be used with other trading signals such as the moving averages and other technical analysis tools as the RSI on its own may not be dependent enough to confirm a given trend at a particular time, therefore the RSI should not be solely depended upon in order to make trading decisions as this can lead to many false signals due to the fact that its true reversal signals are rare and can most of the times lead to false alarms. Sometimes the RSI remains in the overbought or oversold territory for a long period of time, making it difficult to solely depend on it for trading decisions.
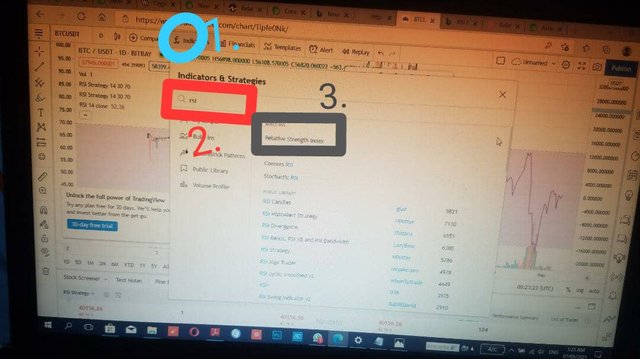
HOW TO CONFIGURE THE RSI ON A CHART
| STEP 1 | At the upper left of your screen, click on the (fx) option |
|---|---|
| STEP 2 | Type in RSI into the search space and some options would pop up |
| STEP 3 | Select the option with (Relative Strength Index) |
It is illustrated by the picture below
MEANING OF THE LENGTH PARAMETER
The length parameter is very important in RSI analysis. It is the deciding factor on how stable or volatile the RSI will be and how quickly the RSI would react to changing market conditions i.e upward and downward movement of new bars.
The conventional RSI period length is usually 14, however it can be changed by the user, but if a shorter RSI length is set, it would cause the RSI to reach extreme values i.e values above 20 and 80 more often, making it to to appear more volatile and unstable. I would like to illustrate it with pictures below, using a normal 14 period length and the adjusting the parameter length to 5.
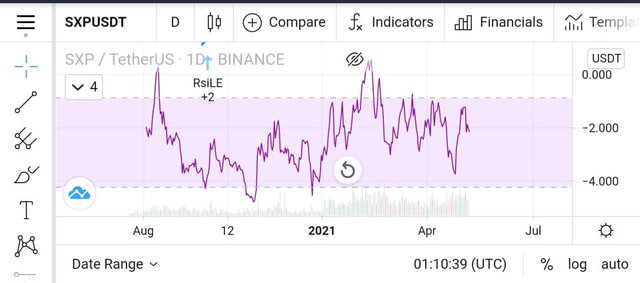
#Number 1. Normal RSI parameter length of 14.
#Number 2. how to change the RSI parameter Length (picture illustrations)
step 1.
click on the RSI setting
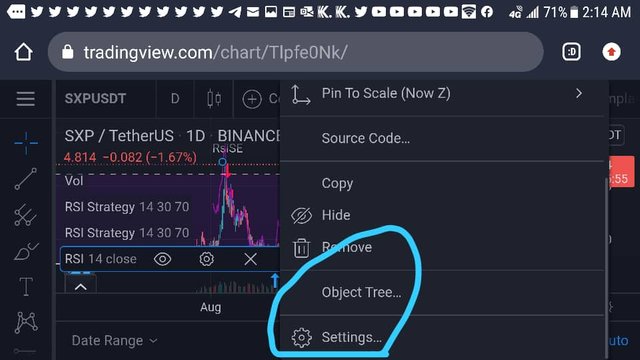
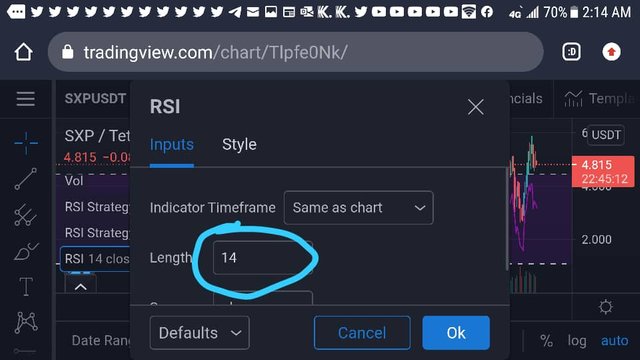
step 2.
The default parameter length of 14 would appear, you can change it from there by typing in any value you choose. As for me, I chose 5.
step 3.
After changing the RSI length to 5 the RSI chart would then look like the one below, having so many extreme values like i explained above.
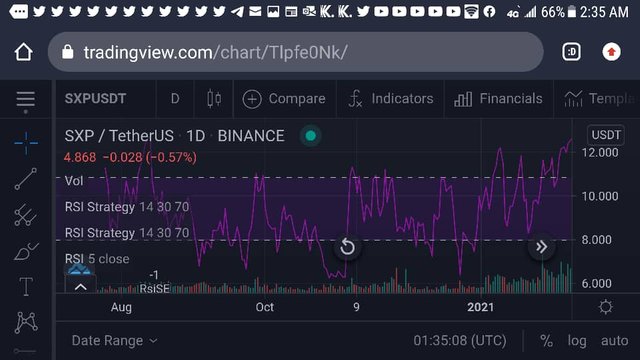
It can be observed that the first RSI chart above is different from the last one, this is due to the change in the RSI parameter length to 5. The change made the RSI very volatile with so many extreme points.
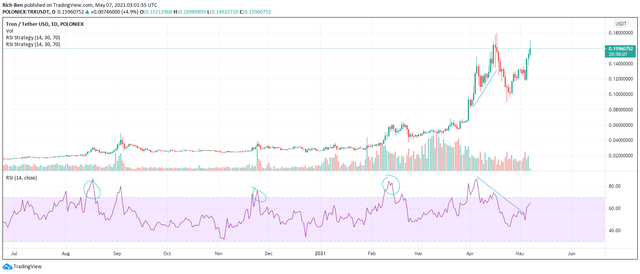
I would like to illustrate the oversold and overbought regions on the RSI using the chart below
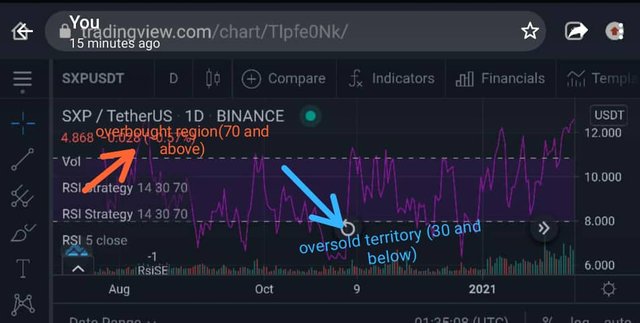
As can be observed from the chart above the oversold territory is usually ranging from 30 to 0. This have been said to most times lead to a trend reversal in the upward direction of the price of the asset while the over bought region ranges from 70 to 100 and has been said to most times lead to a trend reversal in the price in a downward direction.
source
The above photo chart depicts a bearish reversal signal.
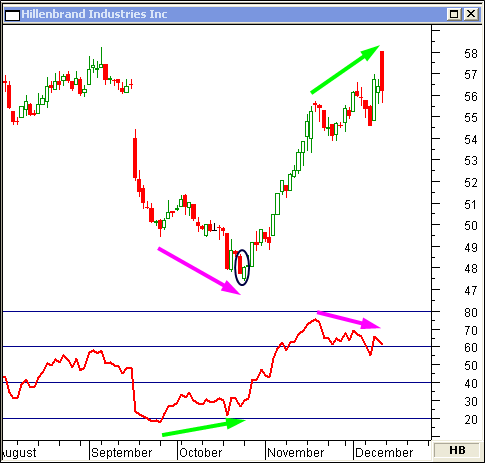
The above chart depicts a bullish and bearish divergence. The first marked point to the left indicates a bullish divergence while the marked point to the right signifies a bearish divergence.
The RSI is a very important tool in trading, however depending on it alone may go well, due to the fact that it can atimes indicate false signals. Therefore it is recommended that the RSI should be combined with other technical analysis tools and indicators in order to achieve a better result.
Thanks to prof @Kuoba01 for this educating lecture.
Hi @rich-ben
Unfortunately, you are not eligible to participate in the Steemit Crypto Academy because your Steempower is still less than 100sp.
Hi @yohan2on
I have quickly powered up the required amount of SP. Am sorry I did not read the requirement initially. But please consider me this once. I put in alot of work to get this post done. I now have the required SP powered up. Thank you for your anticipated favourable response