Crypto Academy Season 3 Week 8 - Homework Post for Professor @asaj on Crypto Assets and The Random Index (KDJ)
This is the final week of the Crypto Academy Season 3. I am grateful to be here to participate in this intermediate lesson by prof @asaj on the topic Crypto Assets and the Random Index (KDJ). I will be doing the homework tasks from it.


In your own words define the random index and explain how it is calculated

Random Index
The random index is also known as the KDJ index is a trading indicator used to predict trend reversals and entry/exit points in the market. The KDJ indicator is made up of 3 lines, the K-Line, D-Line and the J-Line used together to indicate reversals in the market.
The KDJ index is quite similar to the Stochastic Oscillator, with the only clear difference in their number of lines. The random index has 3 lines while the stochastic oscillator has just 2. The extra line in the random index is the J line that shows the divergence of the D line from the K line.
The random index shows when a market is oversold of overbought by setting levels of 70 or 80% for the overbought (top) level and 30 or 20% for the oversold (bottom level). When the lines cross over the top-level it indicates that the market has been overbought and when it crosses below the bottom level it tells us the market has been oversold.
The KDJ lines also converge to indicate a trade signal. For instance, when the J line crosses above the K and D line this indicates that the market is in an uptrend and when the J line crosses below the K and D line it tells us that the market is in a downtrend.
How to Calculate the Random Index
Calculation of the Random index can be done following the steps outlined below.
- First, the RSV (immature random index) value of the nth period is calculated using the formula.
n-day RSV = (Cn-Ln) ÷ (Hn-Ln) × 100
Where:
Cn = closing price of the nth day
Ln = Lowest price of the nth day
Hn = highest price of the nth day.
The RSV value is usually between 0-100
- Next, we calculate the value of the K, D, and J line
K value = 2/3 x previous day value of k + 1/3 x RSV value of the day
D value = 2/3 x previous day value of D + 1/3 X present day K value
J value = (3 x K value) - (2 x D value)
In a situation where there is no previous value for K and D lines, the value 50 is used instead.
Is the random index reliable? Explain
The Random Index indicator is quite reliable in predicting trend directions and ideal entry points in a trade. The random index tells us the current trend of the market by looking at the movement of the lines. J line crosses above line K and D it is an uptrend, when the J line crosses below Line K and D it is a downtrend.
The random index also shows us when a market is overbought and oversold by setting levels. When the KDJ lines cross above the overbought (top) level usually at 70% it indicates the market has been overbought. When the KDJ lines cross below the oversold (bottom) level set at 30% it indicates the market has been oversold.
The random indicator also changes the background color to indicate a change in trend. Green to show there is an uptrend and Red to indicate a downtrend.
The Random Index was developed to be an upgrade to the stochastic oscillator indicator. It is not 100% reliable as no indicator is, but when paired with other indicators it reduces the false signals.
How is the random index added to a chart and what are the recommended parameters?
To add the Random index indicator to a chart we have to first open a chart. I will be using the Tradingview platform.
- Clicking on tradingview.com or searching for trading view on google and clicking on it takes you to the homepage of the platform. On the homepage, click on the chart as shown below.
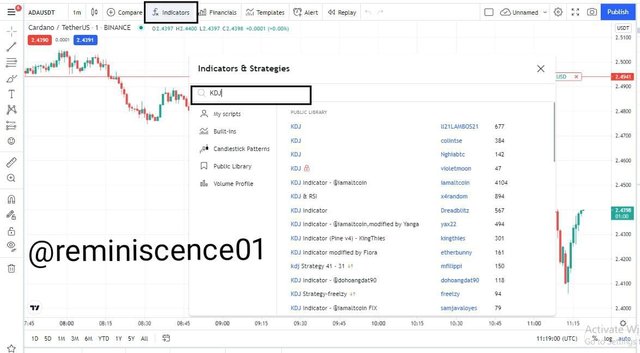
- On the chart page, click on Indicators and Strategy. Then search for KDJ on the search bar.
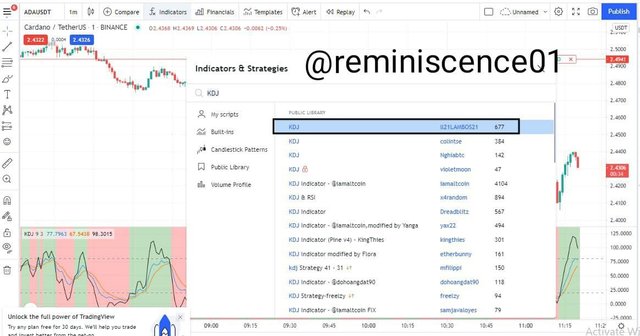
- Click on the KDJ by ll21LAMBOS21 as shown below.
The Random index indicator has been added to the chart.
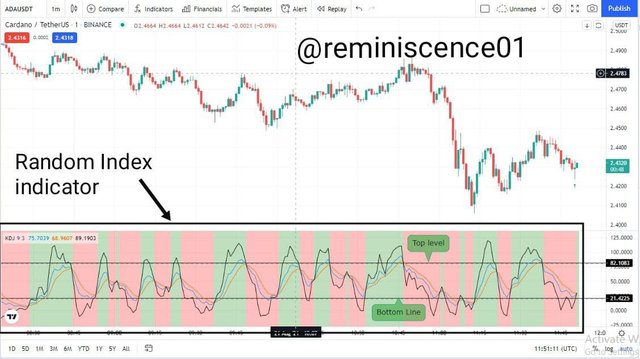
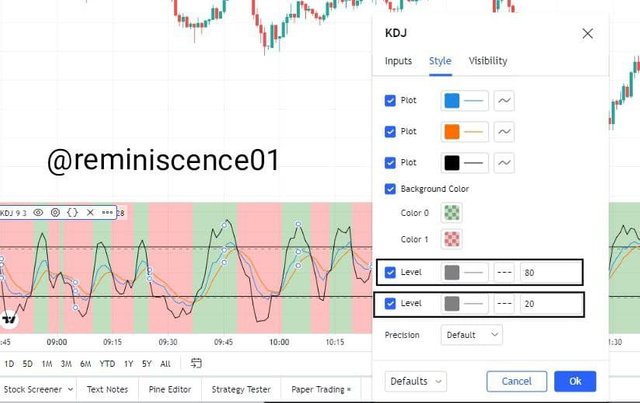
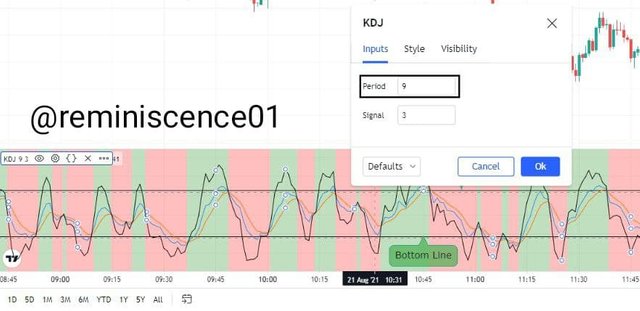
The recommended parameters of the Random Index.
The recommended parameters of the random index are:
- 80% for the overbought level
- 20% for the oversold level and
- 9 as the period length.
- Signal is set as 3. this is used to calculate the divergence of the D line from the K line
Differences between KDJ, ADX, and ATR
The difference between the KDJ, ADX, and ATR indicators can be seen in their function.
Random Index KDJ
This indicator is used to indicate when a market is overbought or oversold, trend reversal, and entry and exit points of a trade. Through the movements of the K. D, and J line, the random index indicator tells us when there is a change in the market. The overbought and oversold levels are used to showcase market bias.
Average directional Index ADX
The average directional index can be used to measure the overall strength of a trend. The ADX signals a weak trend when it is below 20 and a strong trend when it is above 25. used to determine entry and exit points in line with the -DI and +DI crossovers.
ADX is mainly used to indicate the strength of a trend.
Average True Range ATR
The average true range is used to accurately measure the market volatility. Though not used to indicate the price direction, it is mainly used to exit a market. ATR checks the difference between the closing price, lowest price, and highest price to show trend strength.
From their functions, the clear difference is that KDJ is used to indicate trend reversals indication the direction of a price but the ADX and ATR are focused on the trend strength and market volatility.
Use the signals of the random index to buy and sell any two cryptocurrencies.
Using Random Index signal to place a buy order on Tradingview.com
Buy Order
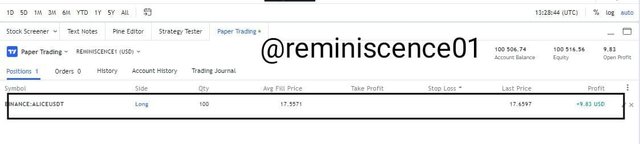
Buy order was placed on the ALICEUSDT chart using signals from the KDJ index.
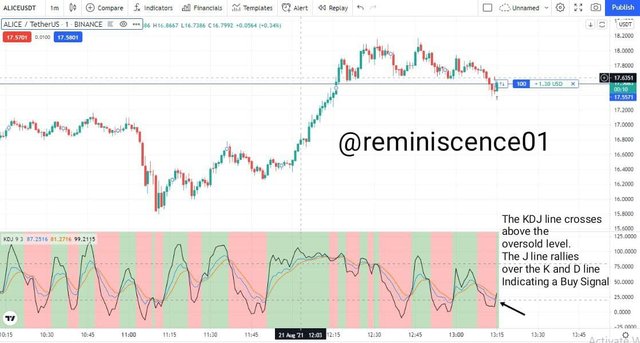
The K line, D line, and J line crossed over the oversold level indicating an uptrend movement and a trend reversal. Also, the J line rallied and crossed above the K line and the D line further confirming the price direction.
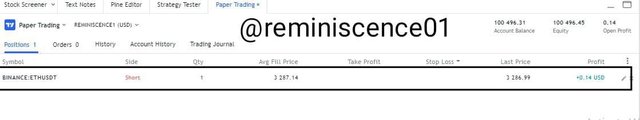
Sell Order
A sell order was placed on the ETHUSDT chart using signals from the KDJ index.
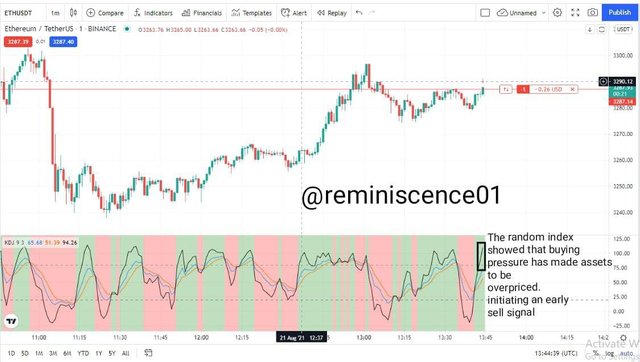
The KDJ index showed buying pressure has assets to be overpriced initiating an early sell signal. Placing a Sell order within the overbought territory isn't a bad idea. As shown below the trade is on profit.
Conclusion
The Random Index is an indicator that is composed of 3 lines (K, D, and J) and 2 levels (overbought level and oversold level) used by traders during technical analysis to predict trend reversal, identify price direction change, and a good exit and entry point indicator.
The KDJ index can be quite reliable and gives an accurate trade signal, especially when combined with other indicators. The KDJ signal is similar to the stochastic oscillator with the J line the significant difference between the two indicators.
Superb performance @reminiscence01!
Thanks for performing the above task in the eighth week of Steemit Crypto Academy Season 3. The time and effort put into this work is appreciated. Hence, you have scored 9 out of 10. Here are the details:
Remarks
Overall, you have displayed a good understanding of the topic. You have performed the assigned task excellently. However, the fourth task could benefit from more research.
That said, this is good work. Thanks again for your contributing your time and effort to the academy.