Starting Crypto Trading - Crypto Academy / S6W1 - Homework post for pelon53

Cover Image Created by Adobe PS
Hello Steemians!
Today I'm here to present my Homework for an attractive lesson created by Prof. @pelon53. So, our topic is "INITIATING CRYPTO TRADING" As I am practically much familiar with those topics, I thought to create a Homework post. So let's go straight to my explanations.


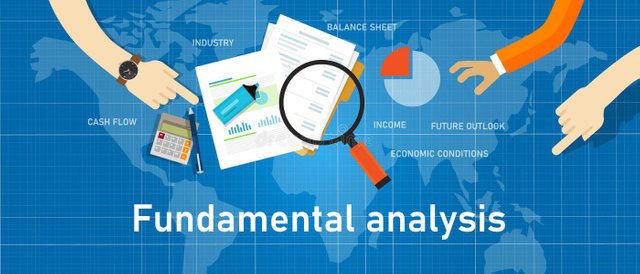
Image Source

In Crypto World, Fundamental analysis can be defined as a more important factor before buying a Coin or Token. Because most of the Crypto Traders are thinking that a coin or Token should be strong fundamentally. Simply put, as crypto traders we need to do a Fundamental analysis of a particular coin to determine if it is worth buying now or if it will be a good investment for the future.
Mainly, Fundamental analysis is the formal way of studying its financial projects, future programs or behaviour of the market considering supply and demand liquidity. With the help of these things, we have the ability to predict the future market behaviour of any project.
Another interesting thing here is that some mathematical concerns also cause changes in market behaviour. As an example, we can consider the calculation of a country’s Gross Domestic Product (GDP). And also, increasing inflation and increasing interest rates are also affecting the stock market as well as the crypto market. Let me clarify it further using a real example.
We all know that as soon as The Federal Reserve said it would raise interest rates, the stock market and the crypto market began to plummet. Below I have included a screenshot of that news.

Screenshot was taken from https://www.gobankingrates.com

When talking about the importance of this, we must remember why we need to do fundamental analysis. I will show a good example for this query. Below I have included a screenshot that I have taken from the Twitter Social Media Platform.
Here you can clearly see the answer given by the CEO of Binance exchange to someone who said that it is difficult for BNB Coin to do technical analysis. It shows us that although it is difficult to make a technical analysis of a coin, by studying the fundamentals of that coin we can predict the future behaviour of that coin somewhat.
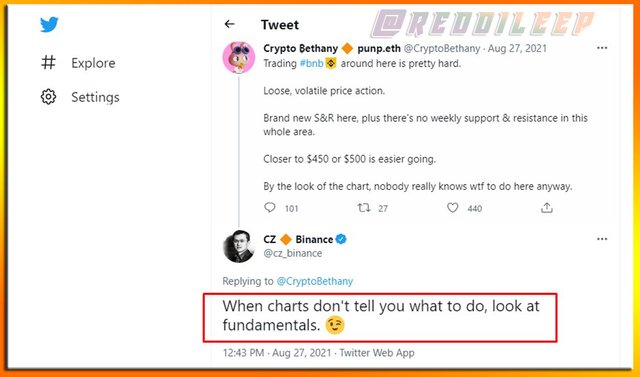
Screenshot was taken from https://www.twitter.com
As we discussed earlier, we can see that the crypto market is always volatile because of the news coming into the market in this way. Therefore, it is very important to do a fundamental analysis before investing in a project. That way we can better understand when we are entering the market and when we are leaving the market.

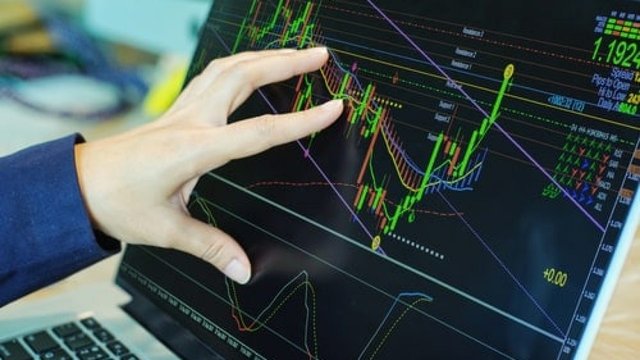
Image Source

As Crypto Traders, we must have good knowledge about Technical Analysis for predicting future market behaviour. Here we are considering past price movements as a comparison for the present market. The most important thing is that we have a lot of indicators to accomplish this Technical Analysis as a strategy.
If we simply talk about the content possibility here, there are a large number of well-known chart patterns currently in use. So these well-known chart pattern traders are tempted to trade according to the signals received from a large number of simultaneous patterns or indicators. Then we can see that in most cases the market behaves according to the relevant trading pattern.
For example, when looking at a support level, when prices reach the support zone, often, prices tend to rise from that zone. This is because there are many Traders who focus on these areas to place their buy orders.
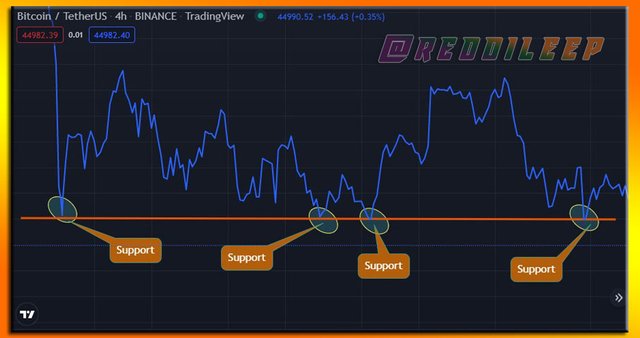
Screenshot was taken from https://www.tradingview.com/symbols/BTCUSDT/
In the above screenshots, we can clearly see that the price movement has taken support from these regions very tightly. This way, we have a certain level of possibility to predict future market behaviour according to Technical Analysis knowledge.

| Fundamental analysis is the formal way of studying its financial projects including socioeconomic data | Technical analysis is the way of studying its historical data considering past price movements |
| Here we have to do our own research to study its fundamental details. | Here we can use a lot of indicators or strategies to study its technical details. |
| Fundamental analysis is a very successful method for long term holders. | Technical Analysis is a very successful method for short term holders and leverage Traders |
| By doing a Fundamental analysis we have the ability to filter fake projects | We can't filter fake projects as market manipulators can easily move small markets as they desired. |
| By doing a Fundamental analysis we can't identify the exact entry point for a market. | By doing a Technical analysis we have the ability to identify exact entry points using short time frames. |

Below you can see I have taken a good entry point for my sell entry using BTC/USDT 30m time frame chart. According to the current chart pattern, I have taken my sell entry at a point in which the price can be rejected due to a major resistance zone.
Just like I thought, I saw a bearish candle is forming near the resistance level. Here I have analyzed it using 30m time frame.
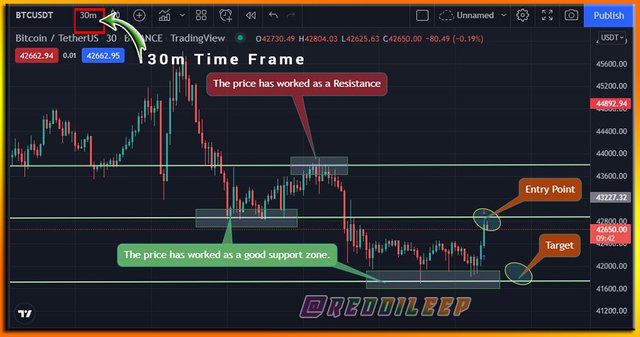
Screenshot was taken from https://www.tradingview.com/symbols/BTCUSDT/ 30m Time Frame
In addition to shorter time frames, we can try to focus on a bit higher frames to protect our entry point. So, here we can also see a certain level bearish candle has formed in 1h time frame.
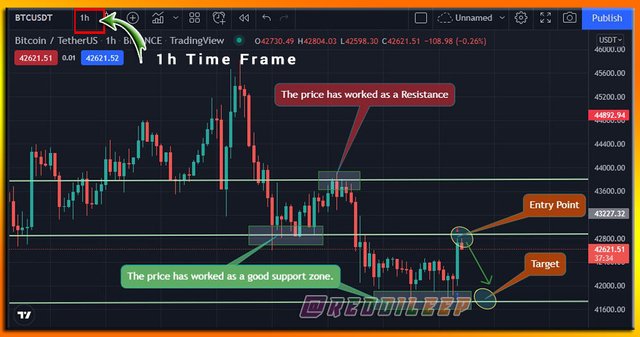
Screenshot was taken from https://www.tradingview.com/symbols/BTCUSDT/ 1h Time Frame
Below I have included the screenshot of my sell order that I have taken through Trading View using the Paper Trading facility.
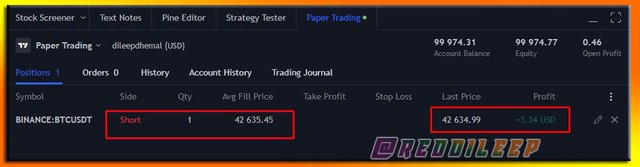
Screenshot was taken from https://www.tradingview.com - Paper Trading

Below you can see I have taken a good entry point for my Buy entry using BTC/USDT 4h time frame chart. According to the current chart pattern, I have taken my Buy entry at a point in which the price can be rejected due to a support zone. This is basically the reverse side of my previous sell entry.
Just like I thought, I found a bullish candle is forming near the identified support level. Here I have analyzed it using 4h time frame and support levels.
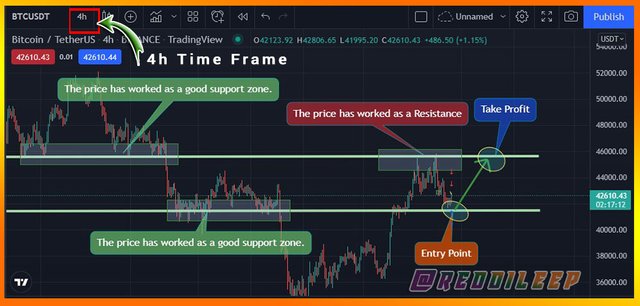
Screenshot was taken from https://www.tradingview.com/symbols/BTCUSDT/ 4h Time Frame
In addition to 4h time frames, we can try to focus on a bit higher frames to confirm our entry point. So, here we can also see a certain level bullish candle has formed in the 1-day time frame.
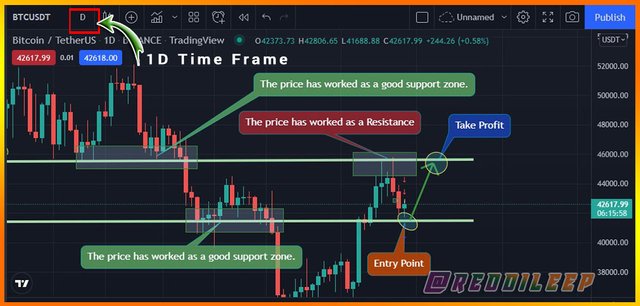
Screenshot was taken from https://www.tradingview.com/symbols/BTCUSDT/ 1D Time Frame
Below I have included the screenshot of my buy order that I have taken through Trading View using the Paper Trading facility.
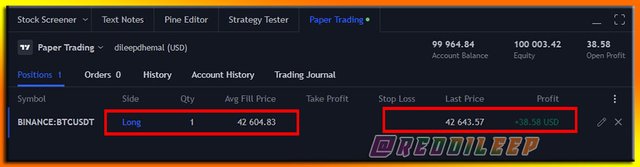
Screenshot was taken from https://www.tradingview.com - Paper Trading


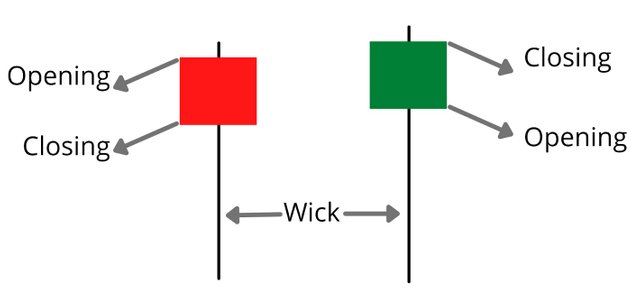
Image Source
We already know that candlesticks display the high prices, low prices, opening prices, and closing prices of any suitable market including Crypto Market and as well Stock Market. However, these high, low, opening and closing prices will be determined by using special patterns such as "Hanging Man" and "Shooting Star. Let's discuss of "Hanging Man" chart pattern.
The Hanging Man candle pattern is, quite simply, a hammer-shaped candle pattern. But the special thing here is that the Hanging Man candle pattern occurs during the market is moving up. If a species turns red, it means that a significant amount of market behaviour maintained by buyers has been passed on to sellers. In such a case we can see big selling pressure in the market. Let's focus on an example through Cryptocurrency market charts.
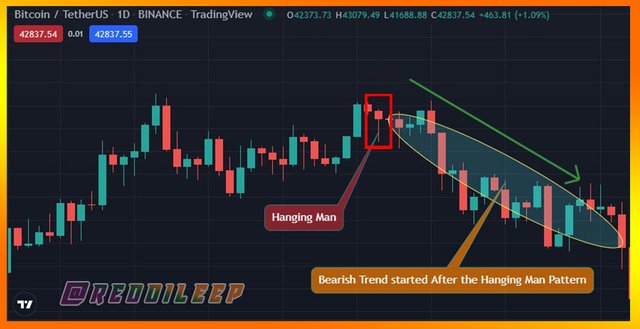
Screenshot was taken from https://www.tradingview.com
Above we can clearly see that the Price movement has changed to a downtrend after appearing a hanging man pattern. At the same time, if the hanging man is green, there is not as much selling pressure as in red, but it is not advisable to place buy orders in such cases.

Shooting Star can also be referred to as a chart pattern that is often seen in trading charts. This is also defined as a bearish candlestick. However, here we can see a bit long upper shadow. The shadow here should be twice or more than the minimum candle body.
This is also the case when the price level is going up and if found in any resistance, the trend will be reversed as a downtrend. And also, if a species turns red, it means that a significant amount of market behaviour maintained by buyers has been passed on to sellers. In such a case we can see big selling pressure in the market. Let's focus on an example through Cryptocurrency market charts.
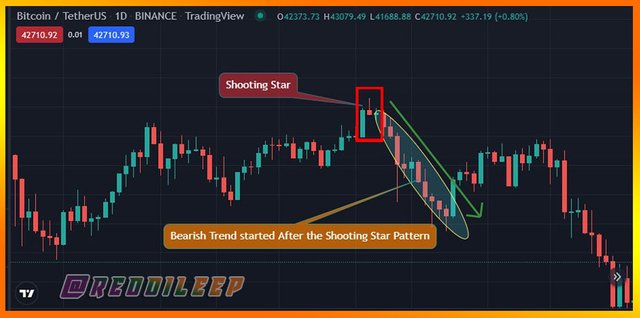
Screenshot was taken from https://www.tradingview.com
Above we can clearly see that the Price movement has changed to a downtrend after appearing in a Shooting Star pattern. At the same time, if the Shooting star is green, there is not as much selling pressure as in red, but it is also not advisable to place buy orders in such cases.

At present both fundamental analysis and technical analysis is very important to buy any Cryptocurrency assets. Because if a coin or a token is not strong its fundamentally, there will be no exact future for these coins or tokens. So, even if it is technically strong, we should consider both matters if we want to take the right decisions.
Chart Patterns are a very important factor in the technical analysis part. At present, there are a lot of identified chart patterns. Among them, "Hanging Man" and "Shooting Star" are very basic and strong chart patterns that we need to identify during chart analysing. If we have a good eye to identify these charts when making a trading setup, we have a higher possibility of winning most trades. However, we should do good research before making decisions.

Thank you for reading