Effective Trading Strategy using Line Charts -Steemit Crypto Academy | S6W1 | Homework Post for @dilchamo
Cover Image Created by Adobe PS
Hello Steemians!
Today I'm here to present my Homework for an attractive lesson created by Prof. @dilchamo. So, our topic is "Effective Trading Strategy using Line Charts" As I am practically much familiar with those topics, I thought to create a Homework post. So let's go straight to my explanations.


Screenshot was taken from https://www.tradingview.com/symbols/BTCUSDT/

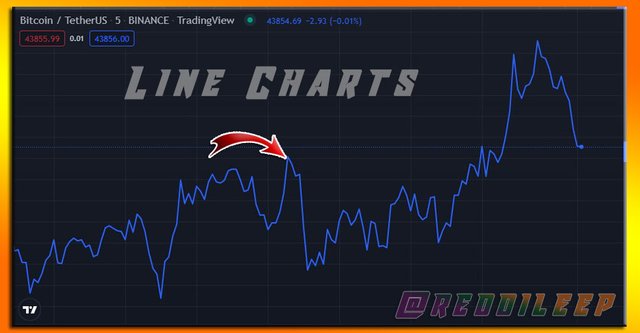
A line chart can be defined as one of the most useful Trading methods that we can use as a Trading technique in addition to Traditional Candlestick Charts. It basically displays closing prices of any price assets without considering advanced price movements. It means line charts are very simple and as well as very useful.
The line chart provides all the details of price movements as straight or continuous line elements. Sometimes it filters very small or unnecessary price movements as a clear Trend line. Here the most important thing is that we have a very clear chart window for analysing relevant Market following exact support and resistance zones.
I will explain Line charts further using an example.
Screenshot was taken from https://www.tradingview.com/symbols/BTCUSDT/
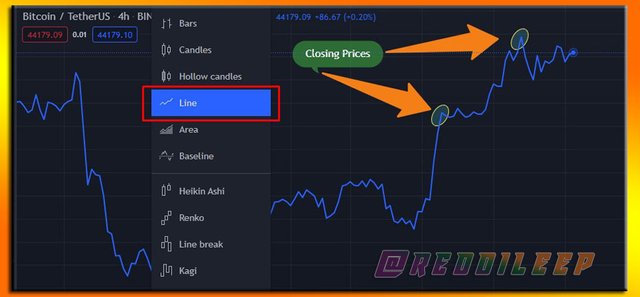
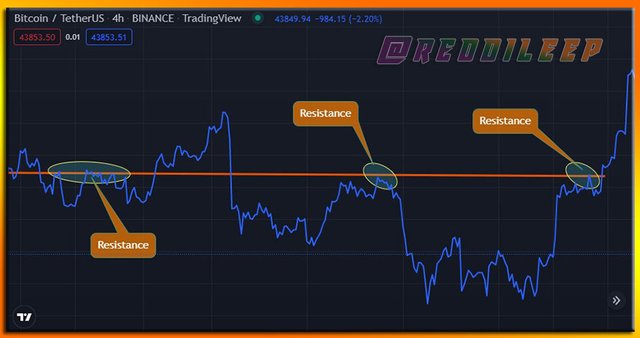
Above I have clearly shown an example for line charts. And also, I have highlighted some zones that can be identified as very clear closing prices as compared to candlestick charts. Here we have more possibility to identify clear chart patterns as well as clear support and resistance levels. I will explain support and resistance levels further using some examples in the next subtopics.

We can easily use Line charts for analysing the Historical prices through a clear graphical interface.
Line charts can be used as a technical tool for identifying the exact closing prices of each market movement.
When we combine Line charts with some other basic indicators such as EMAs and MAs, we can easily understand good support and resistance zones.
We can use these Line charts as very clear visualization of the entire price movement since the beginning of a market.

As Crypto Traders, we must have good knowledge about Support and Resistance levels for making a better trading setup. Since support and resistance levels are fundamentally very important, price movements often tend to bounce from each level. Let me explain the identification of Support and Resistance levels using Line Charts practically.

We already know that the Support Levels are very important locations which price movements often tend to bounce from each level. To be clear, a lot of people are waiting to buy those coins until the price comes to these locations. As a result, falling prices are likely to recover from each support level.
I will explain Support Levels further using an example.
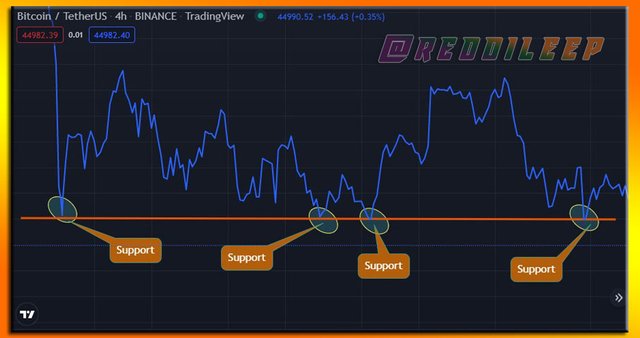
Screenshot was taken from https://www.tradingview.com/symbols/BTCUSDT/
In the screenshot above, I have drawn a trend line connecting some of the levels that have been supported to the price level. So, we can clearly see, most of the time, the price tends to bounce from each level. However, when price movement touches these levels a few times, it may become weak and the price can be broken.

Resistance levels are also very important points where price movements often tend to bounce from each level or difficult to break each level. To be clear, a lot of people are waiting to sell their coins until the price comes to these locations. As a result, rising prices are likely to reverse from each resistance level.
Again I will explain Resistance Levels further using an example.
Screenshot was taken from https://www.tradingview.com/symbols/BTCUSDT/
In the screenshot above, I have drawn a trend line connecting some of the levels that have been rejected to the price level. So, we can clearly see, most of the time, the price tends to bounce from each level. However, same as support levels, when price movement touches these levels a few times, it may become weak and the price can be broken.

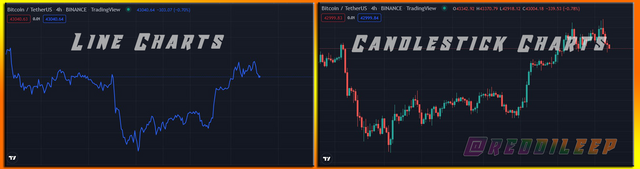
| Line chart represents relevant price details of any asset in a simple manner. | Candlestick chart represents relevant price details of any asset in an advanced way. |
| Line chart shows all the price movements considering closing prices of each asset. | Candlestick chart shows HIgh Price, Close Price, Open Price and Low prices of each asset |
| In Line charts, it's very easy to identify support and resistance zones | In the Candlestick chart, we have to analyze charts deeply to identify support and resistance zones |
| To draw a trend line, we can do this easily by connecting each of the corners that have moved to the level in the line charts | To draw a trend line, we first have to decide whether to do this by connecting the candle wicks or connecting the candle body |
| Here we can only identify current prices or last prices of any price assets and the unnecessary price movements will be filtered out | Here we have the ability to identify every single movement of any price assets by analysing candle wicks. |

Screenshot was taken from https://www.tradingview.com/symbols/BTCUSDT/


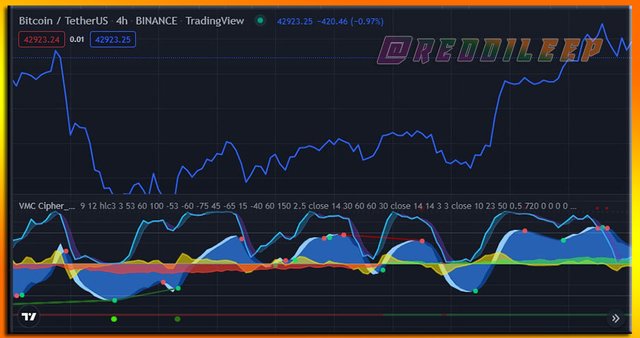
Actually, I have already explained a lesson regarding the VuManchu Cipher B indicator in the Steemit Crypto Academy. So, I have much knowledge about its uses and I think we can use it with these Line charts. So, let me combine the VuManchu Cipher B indicator with Line charts.
As I said earlier, VuManChu Cipher B is a highly profitable and colourful trading indicator that we can use for both bullish and bearish market predictions. There are a few main different indicators have included in this VuManchu Cipher B indicator including RSI, Money Flow, Market Momentum and Market Volume. This indicator is a good opportunity to break limitations when we use some trading platforms without purchasing their premium packages. So, here we can use this indicator for analyzing our charts beyond current limitations and combining them with Line charts.
Below I have added the VuManchu Cipher B indicator to the Line chart window.
Screenshot was taken from https://www.tradingview.com/symbols/BTCUSDT/
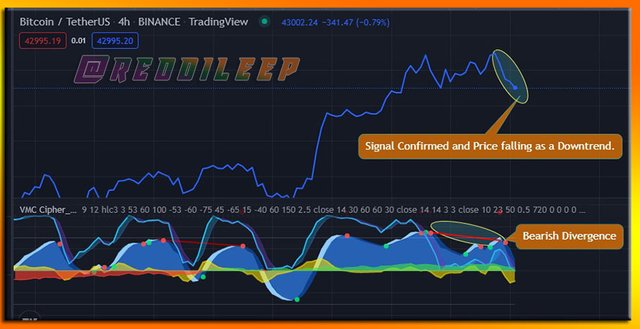
As I described earlier, we can use the VuManchu Cipher B indicator to find bearish divergences. Then we can confirm that signal through the line charts and take entry for selling opportunities.
Screenshot was taken from https://www.tradingview.com/symbols/BTCUSDT/
Bellow I have used the VuManchu Cipher B indicator to find bullish divergences. Then we can confirm that signal through the line charts and take entry for buying opportunities.
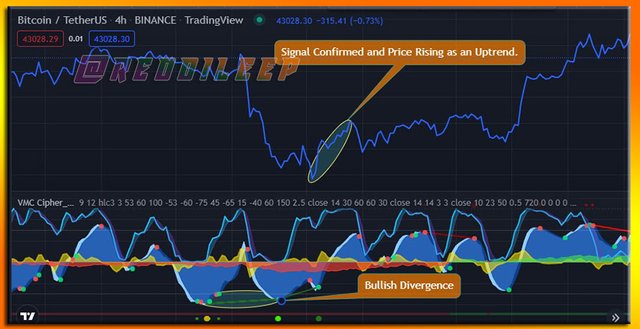
Screenshot was taken from https://www.tradingview.com/symbols/BTCUSDT/

Here we can use any Trading pattern for finding Bullish and Bearish Trading opportunities. And also, we can use any other suitable indicator to find Bullish and Bearish Trading opportunities. So, here I have decided to use the Bollinger Band indicator to find Bullish and Bearish trading opportunities following the Overbought and Oversold Strategy.

First of all, I will briefly explain what the Overbought and Oversold Strategy is. In fact, when the relevant price of any asset has reached the lower band of the Bollinger Band indicator, we can define this region as the Oversold region. Most of the time, the price movement tends to bounce from these levels as a good rejection from the lower region. Therefore, we can focus on those zone for taking good buying opportunities or Bullish Trading opportunities.
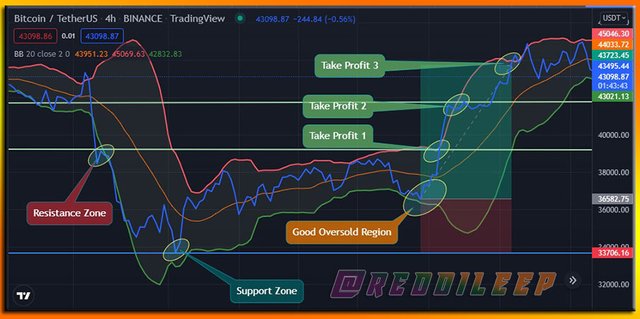
Screenshot was taken from https://www.tradingview.com/symbols/BTCUSDT/
Above I have clearly shown a very profitable trading setup using Line charts and Oversold Strategy. Here the "Take profit 1" is the first and safest exit point for my buy position. However, sometimes there are price movements that walk along with the band. These types of situations can be defined as "Walking the Bands". Therefore, we can wait for a good price rejection for closing our position. That's why I could find more than 1 take profit zones. Let's move to the next opportunity.

For taking a Bearish Trading opportunity, we can focus on good zones when the relevant price of any asset reaches the upper band of the Bollinger Band indicator. We can define this region as the Overbought region. Most of the time, the price movement tends to bounce from these levels as a good rejection from the Upper region. Therefore, we can take good opportunities in those zone as Bullish Trading opportunities.
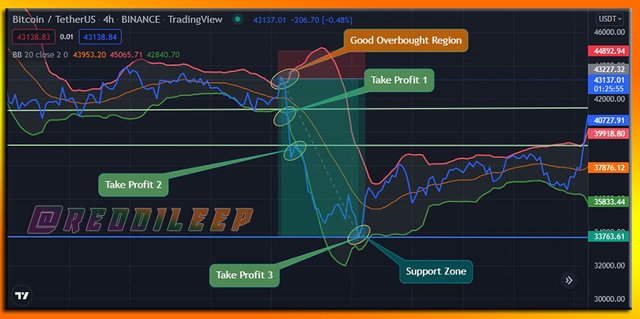
Screenshot was taken from https://www.tradingview.com/symbols/BTCUSDT/
Above I have clearly shown a very profitable trading setup using Line charts and Overbought Strategy. Here the "Take profit 1" is the first and safest exit point for my sell position. However, as I described earlier, there are price movements that walk along with the band. Therefore, we can wait for a good price rejection for closing our position. That's why again I could find more than 1 take profit zones.


Above I have defined important uses of line charts and I think we can take these things as Advantages of this Line charts method. So, I will repeat them as a modified version below.
We can take these Line charts effectively for analysing the Historical prices through a clear graphical interface.
Line charts can be taken as a technical analysis tool for identifying the exact closing prices of each market movement.
We have full confidence to combine Line charts with some other basic indicators such as EMAs and MAs. Therefore, we can easily understand good support and resistance zones.
When we look at its appearance, Line charts are very clear visualized chart patterns that we can identify the entire price movement since the beginning of a market.

We can not use these Line charts for making Advanced Trading setups as it doesn't provide all the details of any asset.
Line charts only provide closing prices of each asset and therefore we can't identify exact movements of the relevant Market.
For the Line charts, we can't use some of the important and useful trading indicators such as TD sequential and Parabolic Sar indicators.
When we consider taking entry to the market, we should know the exact trend using lower time frames. But here we can not suggest for sure whether it is bullish pressure or bearish pressure.

Line charts can be taken as profitable Trading strategies for analysing any Market very easily. Here the most interesting thing is that we have full confidence to see the last price movement considering every single minute. So, we can use these Line charts effectively combining other trading indicators or desired trading patterns.
At the same time, we should have to ability to manage our risk when we deal with Line charts. Because it doesn't show every single movement of the relevant asset. Therefore, we can't identify exact market pressure without using any other trading indicator such as Moving Averages or Exponential Moving Averages.
