Crypto Trading with Moving Average - Crypto Academy |S6W2| - Homework Post for Professor @shemul21
Cover Image Created by Adobe PS
Hello Steemians!
Today I'm here to present my Homework for an attractive lesson created by Prof. @shemul21. So, our topic is "Crypto Trading with Moving Average" As I am practically much familiar with those topics usually, I thought to create a Homework post. So let's go straight to my explanations.


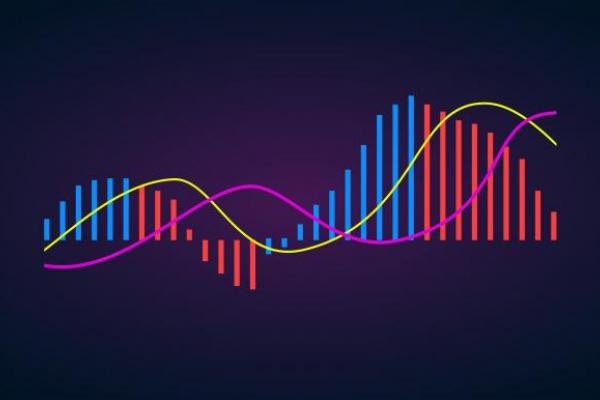
Image Source
Basically, Moving averages can be defined as the most commonly used indicator in technical analysis. Simply put, moving averages are a technical indicator that can easily track the direction of a trend and is also used to identify support and resistance zones. But this indicator is not a 100% successful indicator as market managers often use this indicator to manipulate the market unnecessarily with their cunning. Of course, no indicator is 100% successful, but we can increase the winning rate by combining them with other indicators and modifying the settings on those indicators. Let me explain the whole process of it further.
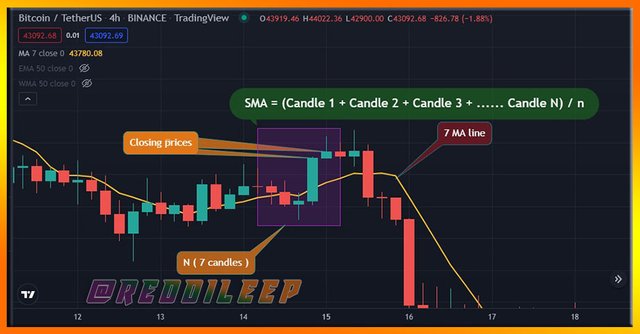
What happens here is that you look at the average closing prices of a currency pair over a given period of time. For example, if we consider the MA line in candles 5, the closing prices in those 5 candles are divided by the period we have given as input. Let me illustrate this with a real chart.
Screenshot was taken from https://www.tradingview.com
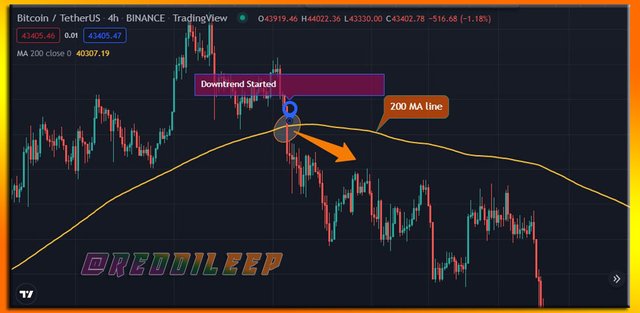
Above we can see a strong trend reversal can occur after crossing a long period Moving Average Line. Here I have used a 200 period MA and 4h BTC/USDT chart for demonstrating my example. Since I have used the 4h chart here, this MA line has been created with an average of 200 4h candles. At the same time, the MA line is clearly down and the market is moving significantly below the downtrend.

Screenshot was taken from https://www.tradingview.com
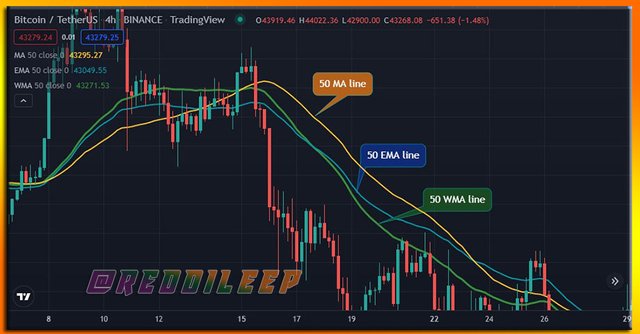
Actually, when we look at a Trading Chart providing platform, we can see a lot of customized versions of these Moving Averages. As I described earlier, MAs are good trend identification tools as popular indicators. This is why many users combine these MAs to create several advanced indicators. However, there are generally three main types of these Moving Averages.
SMA - (Simple Moving Averages)
EMA - (Exponential Moving Average)
WMA - (Weighted Moving Average)
.png)
This is the basic version of Moving Averages and it calculates the average of a chosen range of prices or candle's closing prices and its period. These indicators can be defined as a lagging indicator which means the indicator will not react to the price suddenly.
If we first look at how this is calculated we can see that a very successful method is used for this. First of all, we know that the beginning and the end of the candle can be seen precisely. We can easily identify them by looking at the candle body. And also, here we can see how much the considered candle went up or down using the candle wicks. In this way, there are four specific points to this one candle. (Opening Price, Closing Price, Lowest Point Highest point). In short, this SMA is calculated by averaging the closing prices of the candle and the given input for the SMA indicator. I will explain it through an illustration.
Screenshot was taken from https://www.tradingview.com

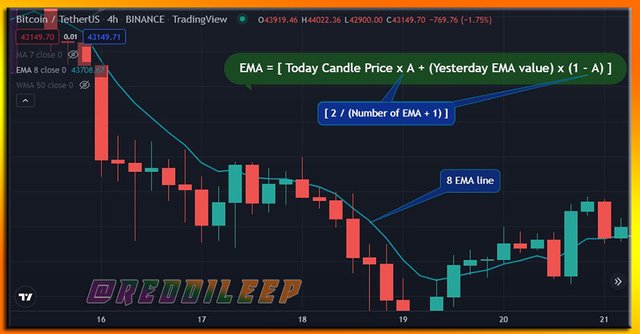
EMA or Exponential Moving Average is somewhat similar to MA, but the realism is greater than MA. As an example, In addition to the value of the MA, past data are also considered. It means, closing prices and past candle information will be calculated to create this EMA line. However, more attention is paid to the most recent data points, which are calculated taking into account all the data for a given period of time.
If we first look at how this is calculated here we can see a slightly more complex process than the MA. Here a multiplier is also used to calculate the EMA line so that we can see it as smooth as the MA. I will explain it through an illustration.
Screenshot was taken from https://www.tradingview.com

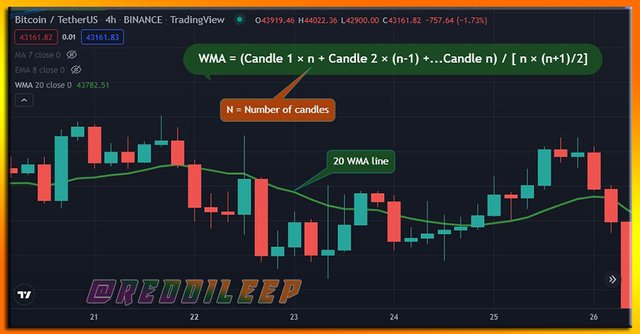
This is another popular indicator that we can use for identifying the trend of a considered price asset. Simply put, buy/sell can be done using the signal from these, but it is better to use more indicators to increase the accuracy of these indicators.
Here the slightly higher weight is given to the most recent prices and the lower weight is given to the previous prices to calculate the WMA line. I will further explain it through an illustration.
Screenshot was taken from https://www.tradingview.com

| SMA | EMA | WMA |
|---|---|---|
| It is an indicator that is more focused on long Term Trading | It is an indicator that is more focused on short Term Trading | It is an indicator that is equally focused on both short & long Term Trading |
| Indicator response to the price will be corporated with a long duration. | Indicator response to the price will be corporated with a short duration. | Indicator response to the price will be corporated with both short & long duration. |
| Generated signal will not be accurate for short term trades due to the candle calculation method. | Generated signal will not be accurate for long term trades due to the candle calculation method. | Generated signal will be accurate for both long and short term trades due to the candle calculation method. |
| SMA line calculation method is very straightforward as compared to other MAs. | EMA line calculation method is slightly difficult as compared to SMAs. | WMA line calculation method is a complicated process as compared to other MAs. |
.png)

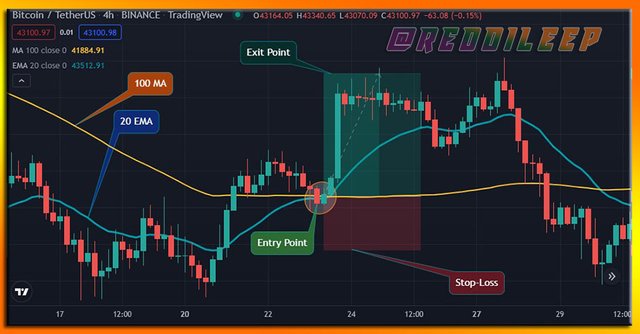
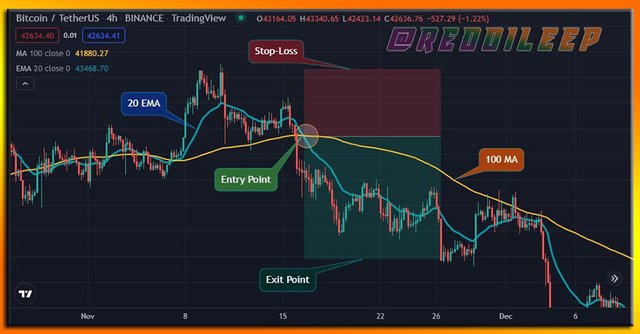
As I explained earlier, we have a possibility to take Entry and Exit points using these Moving Averages. However, we can use more than 1 Moving Average to increase the accuracy of our entry and exit points. Because, if we are able to use more than 1 indicator, then the exact trend can be filtered and the received signals will be improved than a single indicator.
Therefore, here I have included 100 periods MA(Moving Average) and 20 periods EMA (Exponential Moving Average) for identifying my entry and exit points more accurately. At the same time, I will use MAs crossing strategy for taking the exact entry and exit points.
Screenshot was taken from https://www.tradingview.com
In the above-included screenshot, I have taken BTC/USDT price chart using the TradingView platform. Then, I have included 100 MA indicators and 20 EMA indicators for my simple strategy. Finally, I easily took my entry point at the point where it crosses 20 EMAs above the 100 MA line.

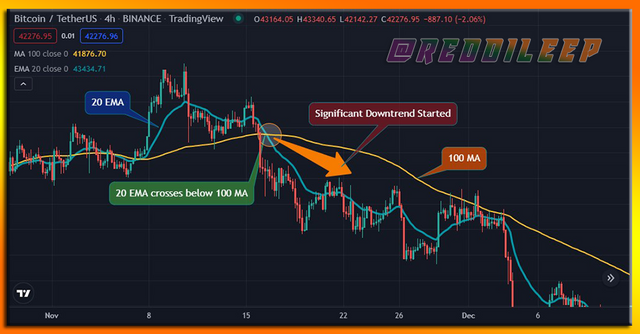
Here I have also included 100 periods MA(Moving Average) and 20 periods EMA (Exponential Moving Average) for identifying my entry and exit points more accurately. At the same time, I will use MAs crossing strategy for taking the exact entry and exit points in the sell short order.
Screenshot was taken from https://www.tradingview.com
In the above-included screenshot, I have taken BTC/USDT price chart using the TradingView platform. Then, I have included 100 MA indicators and 20 EMA indicators for my simple strategy. Finally, I easily took my entry point at the point where it crosses 20 EMAs below the 100 MA line.

MA Crossover is a popular trading strategy that we can use for both long and short term tradings. The main thing here is that when two moving averages cross over two periods crosswise, significant market behaviour moves towards the relevant trend.
Here the method uses fast-moving average and slower moving average. If I explain further, when the lower period of Moving Average Crosses above the higher period of Moving Average, then the market moves towards a significant uptrend. At the same time, when the lower period of Moving Average Crosses below the higher period of Moving Average, then the market moves towards a significant downtrend. let's look at an example.
Screenshot was taken from https://www.tradingview.com
However, we must understand that the market manipulators are very interested in these crossovers. This is because the liquidity of such places is high and they are tempted to use those places to make a profit. I will illustrate such a type of incident through a real chart.
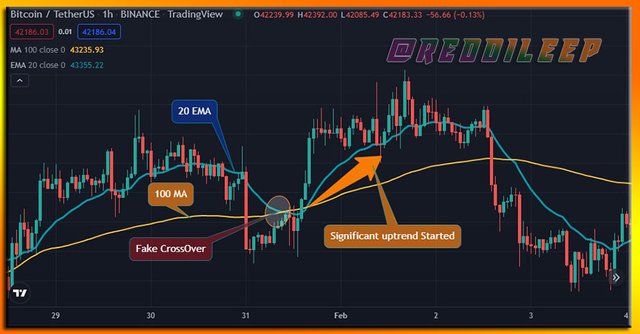
Screenshot was taken from https://www.tradingview.com

As I explained above, there is no indicator that can produce 100% efficiency. Every indicator has its own limitations. So, Moving Average also have limitations in addition to its benefits. Let's discuss some major Limitations of Moving Average.
Moving Average doesn't provide an exact trend for very lower time frames. Therefore, we can't use it for very lower time frame charts.
We can't use Moving Average as a stand-alone indicator due to its highly volatile movements.
Market manipulators are very interested in these Moving Averages. Therefore, we can't depend on the exact trend reversal points such as Crossovers.
Moving Average doesn't provide correct signals for the sideways market due to its trend line calculation method.
Even a small mistake can give completely wrong signals if we didn't focus on the correct input settings very carefully.

At present Moving Averages can be used as very helpful support indicators for creating most Trading strategies. And also, we can see there are a lot of modified Indicators based on these Moving average indicators. We can also use these Moving average indicators for taking suitable entry and exit points. However, it will not be suitable as a stand-alone indicator unless we don't use more than 1 MAs, EMAs or WMAs.

Thank you for reading