(ENG/ESP) Steemit Crypto Academy Contest / S20W2: Trading Steem with Elliott Wave Theory
Scr
Hello everyone!
Greetings to you all and welcome today week 20 of the steeemit engagement challenge. I'm so excited to be participating in these week's amazing contest, which is about Trading Steem with Elliott Wave Theory. Without taking much time, let's start.
Elliott Wave Theory was first developed by Ralph Nelson Elliott in the 1930s. Elliott, who was an accountant, noticed recurring patterns in stock market data and suggest these patterns were influenced by human psychology and behavior. He then proceed to studied various financial markets and name these patterns as "waves," which he described in his book "The Wave Principle" published in 1938.
Elliott's theory began to gained popularity in the mid-20th century, as it's continues to be used by traders and investors today. While some traders find it a valuable tool for understanding market trends and making informed investment decisions, some criticize its subjectiveness nature and potential for Market misinterpretation. Nevertheless, Elliott Wave Theory stands as an important part of the technical analysis landscape.
Elliott Wave Theory identifies two main wave types: impulsive waves which follow the trend and the corrective waves that move against the trend. These patterns can be observed at various timeframes, creating a fractal structure of the market.
Key principles of this theory include thefive-wave impulse and three-wave corrective structures.However, identifying these patterns can be subjective, and the theory can be complex. While it remains a popular tool, chances of market misinterpretation stand at a high risk.
Question 1: Describe the Five Impulsive Waves of Elliott Wave Theory
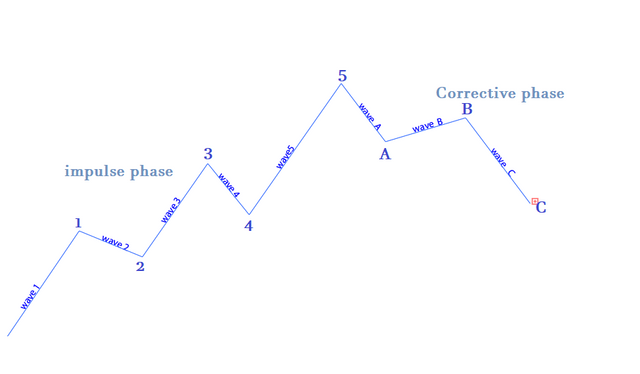
Impulsive waves are the driving force behind a trend in Elliott Wave Theory. They are typically are made of 5 smaller waves, each with its own distinct characteristics:
Wave 1: This is the initial impulsive wave, often characterized by a strong move in the direction of the trend. It can be a relatively small wave, but it sets the tone for the entire impulse.
Wave 2: This is a corrective wave that moves against the trend. It is typically a pullback or retracement of a portion of Wave 1.
Wave 3: This is often the largest and most powerful wave in the impulse. It extends beyond the end of Wave 1 and is typically a strong extension of the trend.
Wave 4: This is another corrective wave that moves against the trend. It is typically a shallower pullback than Wave 2.
Wave 5: This is the final impulsive wave in the sequence. It is often a weaker wave than Wave 3 and can sometimes end in a climactic pattern.
Key Criteria to Differentiate Impulsive Waves from Corrective Waves
Structure: Impulsive waves have a five-wave structure, while corrective waves typically have a three-wave structure.
Direction: Impulsive waves move in the direction of the larger trend, while corrective waves move against the trend.
Extension: Impulsive waves often exhibit extensions, where one of the waves (usually Wave 3) extends beyond the end of the previous wave.
Retracement: Corrective waves typically retrace a portion of the preceding impulsive wave.
Timeframe: Impulsive waves tend to take longer to develop than corrective waves.
Example: STEEM/USDT Trading Pair
Imagine a bullish trend in the STEEM/USDT trading pair. In this scenario, the five impulsive waves might appear as follows:
Wave 1: A strong upward move in the STEEM/USDT price.
Wave 2: A pullback or retracement of a portion of Wave 1.
Wave 3: A powerful extension of the upward trend, possibly exceeding the high of Wave 1.
Wave 4: A shallower pullback or retracement.
Wave 5: A final upward move, potentially ending in a climactic pattern such as a triple top or a divergence.
Question 2: Identify Impulsive and Corrective Waves on a Steem Chart
Steps for Identifying Waves:
Choose a Timeframe: For a detailed analysis, consider using a daily or weekly timeframe. This will provide a clearer view of price movements over a longer period.
Identify the Trend: Determine the overall trend direction (upward, downward, or sideways) during the chosen period.
Look for Impulsive Waves:
Structure: Search for five-wave patterns moving in the direction of the trend. These are likely impulsive waves.
Extension: Look for a wave, usually Wave 3, that extends beyond the end of the previous wave.
Momentum: Impulsive waves often exhibit strong momentum and price changes.
Identify Corrective Waves:
Structure: Look for three-wave patterns moving against the trend. These are likely corrective waves.
Retracement: Corrective waves often retrace a portion of the preceding impulsive wave.
Zigzag Patterns: Common corrective patterns include zigzags, flats, and triangles.
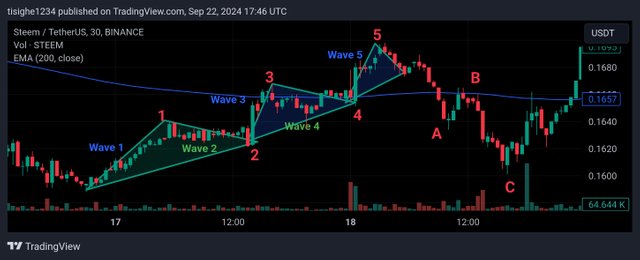
A Historical STEEM/USDT Chart Analysis
Imagine a bullish trend in STEEM/USDT. We might observe the following
Impulsive Wave 1: A strong upward move, potentially with a higher volume.
Corrective Wave 2: A pullback or retracement, possibly forming a zigzag pattern.
Impulsive Wave 3: A powerful extension of the uptrend, potentially breaking through previous highs.
Corrective Wave 4: A shallower pullback, possibly forming a flat pattern.
Impulsive Wave 5: A final upward move, potentially ending in a climactic pattern.
Question 3: Explain the Alternation Rule in Corrective Waves
The Alternation Rule in Elliott Wave Theory.
The alternation rule is a fundamental principle in Elliott Wave Theory that suggests corrective waves tend to alternate in structure. This means that if one corrective wave is a zigzag pattern, the next corrective wave is more likely to be a flat or a triangle.
How the Alternation Rule Influences Trading Strategy
Understanding the alternation rule can be beneficial for traders in several ways:
Predicting Corrective Patterns: By knowing the structure of the previous corrective wave, traders can anticipate the potential structure of the next one.
Identifying Potential Turning Points: When a corrective wave ends in a pattern that is different from the previous one, it can signal a potential turning point in the market.
Managing Risk: Traders can use the alternation rule to set stop-loss orders and take profits at strategic levels based on expected corrective wave patterns.
Complex Correction vs. Simple Correction in STEEM Example.
Case 1: Simple Correction (Flat)
Impulsive Wave 1: A strong upward move in STEEM price.
Corrective Wave 2: A flat pattern, indicating a sideways consolidation.
Impulsive Wave 3: A continuation of the uptrend.
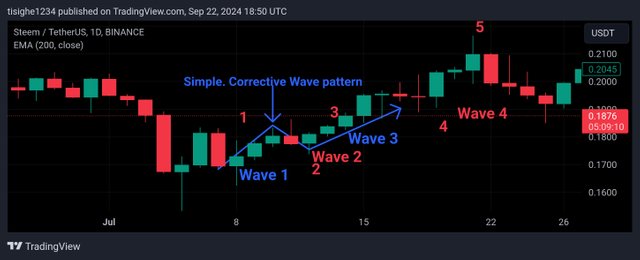
D1. Chart. wave 2 is a flat pattern follow by uptrend. This is in line with the rule of simple correction.
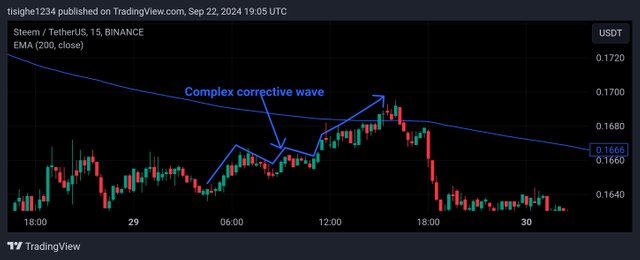
Case 2: Complex Correction (Zigzag)
Impulsive Wave 1: A strong upward move in STEEM price.
Corrective Wave 2: A zigzag pattern, indicating a more volatile correction with multiple price swings.
Impulsive Wave 3: A continuation of the uptrend.
In this hypothetical example, the alternation rule suggests that if Wave 2 is a flat, Wave 4 is more likely to be a zigzag, and vice versa. Traders can use this information to anticipate the potential depth and duration of corrective waves and adjust their trading strategies accordingly.
Points to note
The alternation rule is a useful tool for predicting the structure of corrective waves in Elliott Wave Theory.
Understanding the alternation rule can help traders identify potential turning points and manage risk.
The complexity of corrective waves can vary, with simple corrections (flats) and more complex corrections (zigzags) being common.
By applying the alternation rule to your analysis of the STEEM market, A trader can gain a deeper understanding of potential price movements and make more informed trading decisions.
Question 4: Plot a Trading Scenario for Steem Based on Elliott Waves
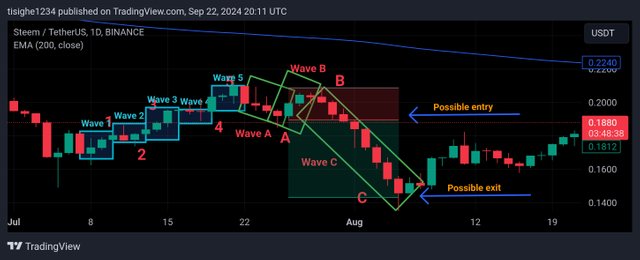
A Trading scheme for STEEM Based on Elliott Wave Theory
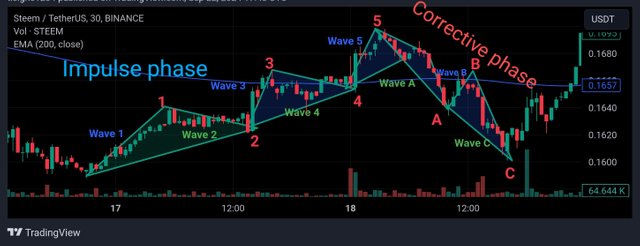
The Elliot waves theory stresses on 2 key scheme, the impulsive wave and the corrective wave. The impulsive wave is marked by an uptrend followed by possible retracements in a phase 1,2,3,4 of 5. Each number represent a wave pattern, which is necessary for inform Market decisions. The following below explains the Elliot waves theory based on Impulse and correction phase.
Upward Impulse (1-2-3-4-5):
Wave 1: A strong upward move, potentially breaking above a previous resistance level.
Wave 2: A pullback or retracement, but not retracing the entire Wave 1.
Wave 3: A powerful extension, possibly exceeding the high of Wave 1.
Wave 4: A shallower pullback, potentially forming a flat pattern.
Wave 5: A final upward move, potentially ending in a climactic pattern like a triple top.
Downward Correction (A-B-C):
Wave A: A downward move, potentially retracing a portion of Wave 3.
Wave B: A corrective bounce, possibly reaching a Fibonacci retracement level.
Wave C: A downward move, potentially reaching a Fibonacci extension level.
Trading Strategy:
Entry:
Impulse Waves: Enter long positions at the beginning of Wave 1 or after a pullback in Wave 2.
Corrective Waves: Enter short positions at the beginning of Wave A or after a bounce in Wave B.
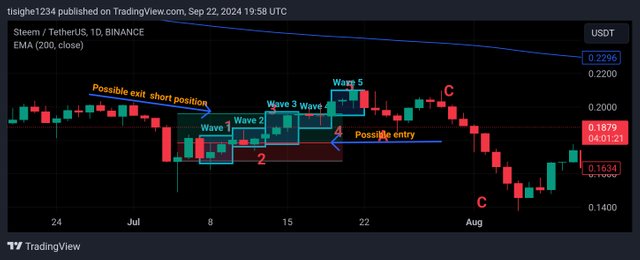
Exit:
Impulse Waves: Exit long positions at the end of Wave 5 or near a Fibonacci extension level.
Corrective Waves: Exit short positions at the end of Wave C or near a Fibonacci retracement level.
Fibonacci Levels:
 * Retracement Levels:23.6%, 38.2%, 61.8%
 * Extension Levels: 161.8%, 261.8%, 423.6%
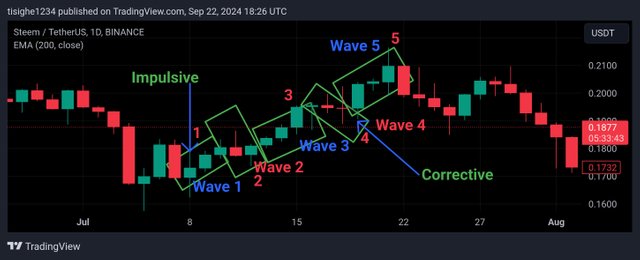
Question 5: Analyze Steem's Current Market Trend Using Elliott Waves.
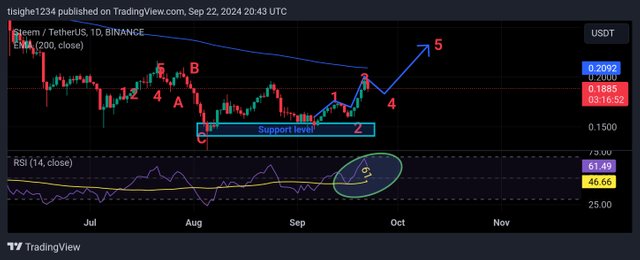
Analyzing the price chart of steem at its current level , I was able to make some possible judgments. I was able to spot a resistance point which gave rise to a possible uptrend, then followed by a pullback and back on an Uptrend. This are they possible signs? The market is about to form an impulsive phase.
Looking at the chat. Critically, I was able to see that the first three phases have been formed completely and the market is about to form The fourth phase Which is a possible retracement or corrective phase And then maybe a possible Uptrend again till We reach the The five wave phase.
Currently spotting the price of steam at 0.1886$ It is suggested that this price will go up till 0.20 to 0.2200$
In the days ahead. This information is strongly supported by the current value of the RSI which is still On it journey To reach the overbought condition before any other thing could happen after.
I equally employ the use of moving average 200, and moving average 50. The moving average 50 is currently below the 200 average when observed on a small time frame like 4 hour. This is a strong suggestion that we are still likely to witness a rise in steem price.
Conclusion
Elliott Wave Theory offers a unique perspective on market analysis by suggesting that price movements are influenced by human psychology and behavior, resulting in predictable patterns. While it can provide valuable insights, it's important to approach the theory with a critical eye, as it can be subjective and complex.
At this point I would like to invite a falling person's join me participate in Amazing contest. @fombae, @simonnwigwe, @growwithme
Credit to: @rafk
Upvoted! Thank you for supporting witness @jswit.
TEAM 4
Congratulations! Your post has been upvoted through steemcurator06. Good post here should be..