[How to Trade Cryptocurrencies Profitably Using TD Sequential]-Steemit Crypto Academy | S4W8 | Homework Post for @reddileep

1- Define TD Sequential Indicator in your own words.
The TD Sequential Indicator is a technical analysis indicator that is used to identify the end of a trend and also the beginning of a new trend. That is, it gives signals about when a trend is about to end and when there is going to be a market reversal or a market correction. It was created and developed by a man known as Thomas Demark.
In the cryptocurrency markets, there are some indicators that help to determine when the price is trending, there are other indicators that help to determine when the price is ranging, but none of them are sufficiently dynamic enough to help differentiate between when a price is trending and when a price is ranging. The TD Sequential indicator addresses these problems by having both momentum and trending components. The indicator is completely objective and has money management rules incorporated in it. The beauty about this indicator is that it can be applied to any market and any timeframe, regardless of the level of volatility that is being experienced in the market because it is based on relative price action, and does not need the default settings to be altered.
The indicator attempts to bring to the fore points of exhaustion in ranges, to anticipate market tops and bottoms when the market would have reached its overbought or oversold levels, and when the sentiments of the market are extreme during trends. The indicator is very useful for market timing purposes when it is added to the trading tools/analysis of a trader. The indicators highlight when the signal is generated, and the points where a position should not be open or add to an already existing position in the direction of the current trend.
The TD Sequential indicator is composed of two main components namely:
TD Setup - It is an indicator that helps to define whether the market would be confined to a range or begin a directional trend. It relies on the momentum of the price movement.
TD Countdown - It is an indicator that deals with a trend and tries to identify low-risk opportunities to fade established directional moves.
After the TD setup is successfully completed, the TD countdown follows.
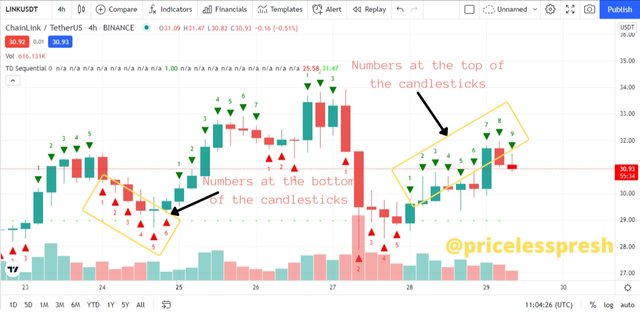
On the chart, when the TD Sequential indicator is installed, it is shown with numbers at the top of the candlesticks and numbers at the bottom of the candlesticks. The numbers on the top of the candlesticks are displayed with green color, likewise, the numbers at the bottom of the candlesticks are displayed with red color.
Some of the benefits of using TD Sequential indicators are
- It is used for timing the markets.
- It can be used to spot overbought and oversold periods because it shows market exhaustion periods.
- It helps to determine to take profit levels.
- It can be used to fade trends.
- It suggests a change in the market dynamics anytime the behavior of the indicator is interrupted or changed.
- It is more reliable than the conventional and popular indicators known.
- The indicator is dynamic as it switches between trends and ranges, thereby making it not to be constrained to a specific level.
2- Explain the Psychology behind TD Sequential. (Screenshots required)
As explained earlier the TD Sequential indicator is composed of two main components. They are TD Setup and TD Countdown. These two components follow each other, that is, a TD setup must occur before a TD countdown occurs. These components are also regarded as phases as one happens then the next. But I would be looking into the setup phase.
Also while using the indicator we must also make use of the Japanese candlestick or Bars on the chart. This is because they give a clear indication of the behavior of the market. When using the indicator we have to look at the numbering on the indicator in relation to the market movement. This helps us get trend reversal or correction signals when we count the numbers that the indicators display.
Let's see how the psychology of the TD Sequential indicator works in the price setup.
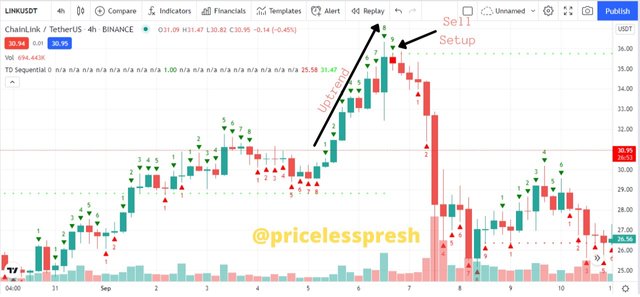
For a Sell Setup to occur there must be a rise in price or an uptrend. This is shown through the behavior of the candlestick as the candlesticks closed higher. This may sound counterintuitive as we are used to buying when the price rises and we sell when the price lowers. At the same time, the consecutive close of the candlesticks must be at a stretch of 9 candlesticks.
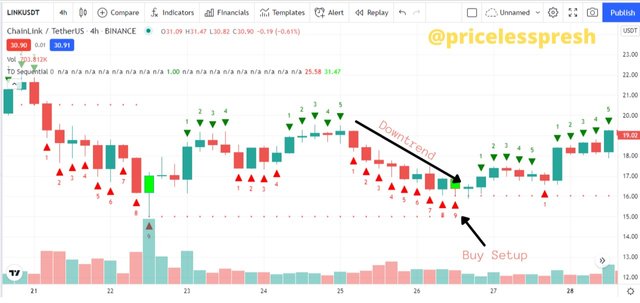
Likewise, for a Buy Setup to occur there must be a reduction in price or a downtrend. This is shown through the behavior of the candlestick as the candlesticks closed lower. This may also sound counter-intuitive as we are used to selling when the price falls and we buy when the price rises. At the same time, the consecutive close of the candlesticks must be at a stretch of 9 candlesticks.
3- Explain the TD Setup during a bullish and a bearish market. (Screenshots required)
In this exercise, I would be demonstrating how to do a Sell Setup and a Buy Setup using the TD Sequential Indicator.
Sell Setup on the TD Sequential Indicator:
The prerequisite for a Sell Setup is a Bullish Price Flip. The Bullish Price Flip is an indicator that there is a switch from a negative to positive momentum. The Bullish price flip occurs when the close of the candlestick that starts the Sell Setup count is higher than the close of the candlestick four periods earlier, and the close of the candlestick before the candlestick that starts the Sell Setup count is lower than the close of the candlestick four periods earlier.
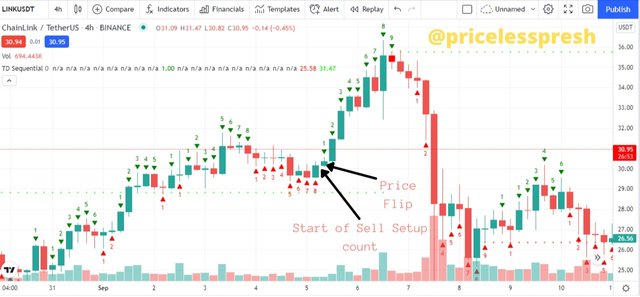
The chart of LINKUSDT illustrates the price action necessary to produce a Bullish price flip for the initiation of a TD Sell setup. The close of the candlestick that starts the Sell Setup count is above the close of the candlestick four periods earlier which is 5. The chart also shows an extension of the price action as it moved in a series of 9 consecutive closes without any interruption, with each close higher than the close of four candlestick earlier.
Buy Setup on the TD Sequential Indicator:
In the same vein, as the sell set up, a prerequisite for a Buy Setup is a Bearish Price Flip. A Bearish Price Flip is an indicator that there is a switch from a positive to negative momentum. The Bearish price flip occurs when the close of the candlestick that starts the Buy Setup count is lower than the close of the candlestick four periods earlier, and the close of the candlestick before the candlestick that starts the Buy Setup count is higher than the close of the candlestick four periods earlier.
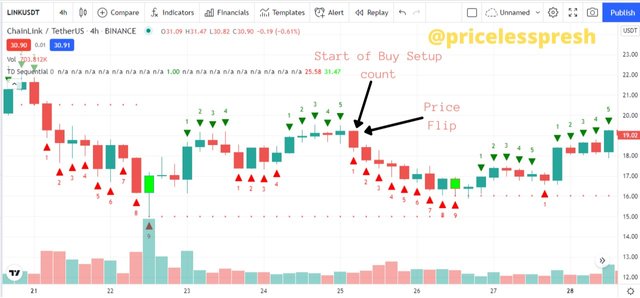
The chart of LINKUSDT illustrates the price action necessary to produce a Bearish TD price flip for the initiation of a TD Buy Setup. The close of the candlestick that starts the Buy Setup count is below the close of the candlestick four periods earlier which is 2. The chart also shows an extension of the price action as it moved in a series of 9 consecutive closes without any interruption, with each close lower than the close of four candlestick earlier.
Note: If at any point the sequence of nine consecutive prices closing lower or higher than the close of four bars earlier (up to and including the close of TD setup bar 9) is interrupted, the TD setup that was developing will stop and start over anew.
4- Graphically explain how to identify a trend reversal using TD Sequential Indicator in a chart. (Screenshots required)
To identify a trend reversal using the TD Sequential indicator there are some certain requirements that are essential in letting traders know exactly when a trend reversal is about to occur.
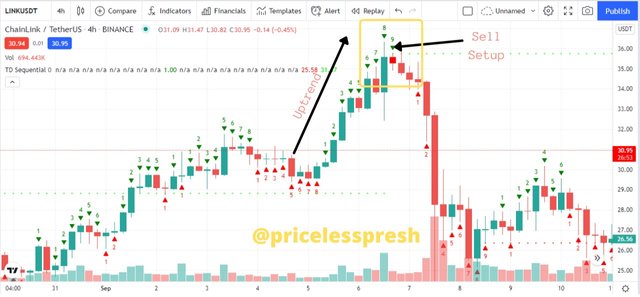
For a Bearish trend reversal, the market must move in an uptrend and is accompanied by a number on the candlestick reaching up to 9. If it reaches 9, it means that all the candlesticks closed higher than the candlesticks four periods earlier. If at any time a candlestick closes lower than the candlestick four periods earlier, the 9 number sequence breaks and starts all over again.
At the same time once the number on the candlestick reaches 9, then the Highs of candlestick numbers 8 & 9 must be higher than the highs of candlestick 6 & 7. Only then we can certain that there would be a reversal in the bearish direction. The yellow shape captures the highs of candlesticks 8 & 9 which is seen to be higher than the highs of candlesticks 6 & 7.
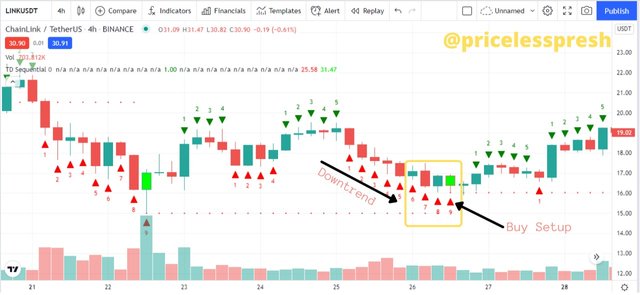
Also for a bullish trend reversal, the market must move in a downtrend and is accompanied by a number on the candlestick reaching up to 9. If it reaches 9, it means that all the candlesticks closed lower than the candlestick four periods earlier. And if any of the candlesticks closes higher than the candlestick four periods earlier, the 9 number sequence breaks and starts all over again.
At the same time once the number on the candlestick reaches 9, then the Lows of candlestick numbers 8 & 9 must be higher than the lows of candlestick 6 & 7. Only then we can be certain that there would be a reversal in the bearish direction. The yellow shape captures the lows of candlesticks 8 & 9 which is seen to be lower than the lows of candlesticks 6 & 7.
5- Using the knowledge gained from previous lessons, do a better Technical Analysis combining TD Sequential Indicator and make a real purchase of a coin at a point in which TD 9 or 8 count occurs. Then sell it before the next resistance line. (You should demonstrate all the relevant details including entry point, exit point, resistance lines, support lines or any other trading pattern such as Double bottom, Falling wedge and Inverse Head and Shoulders patterns.)
In this exercise, it is pertinent to state that I did a reverse of purchase, I made a sale. This is mainly due to the time of partaking in this exercise. At the time of doing this exercise, most of the cryptocurrencies had moved from the Buy Setup to the Sell Setup. While some were in the process of moving to the Sell Setup. In order words, I didn't see any Buy Setup do this exercise. I truly hope this would be put into consideration.
With that said let us go into the crux of the matter.
I used a combination of TD Sequential Indicator and Bollinger Bands. That's because like the TD indicator, Bollinger Bands also show areas of overbought conditions and oversold conditions. It also shows when the market is in range and when the market breaks out of the range.
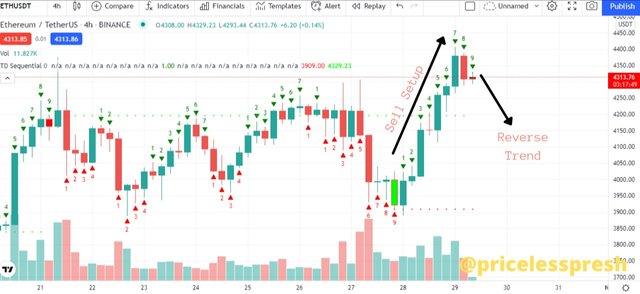
On the 4 Hour chart of ETHUSDT, a Sell Setup had fully developed to maturity, and so it was expected that the trend would reverse after the completion of the 9th candlestick formation.
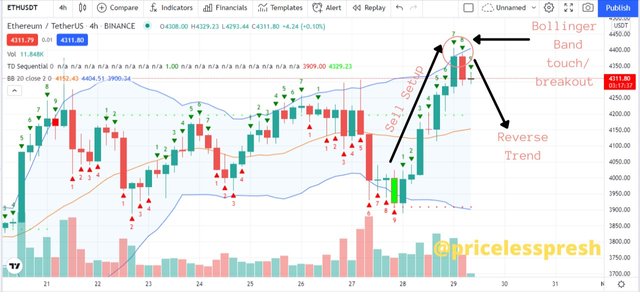
Then I added the Bollinger Bands to check the market formation. The Sell Setup was there, then the candlestick with the number 7 on the top of it had broken out of the Bollinger Band. This usually indicates that the market has reached its overbought condition and at the same time the trend has reached its exhaustion, therefore a downward movement of the price is expected.
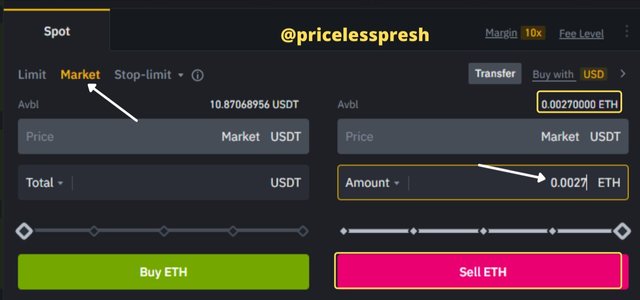
So I placed a Sell Market order. I did this on the Binance terminal. I had 0.0027 ETH, so I sold it.
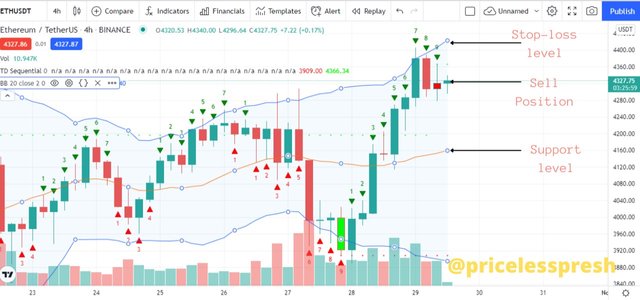
I placed my Sell Market order at 4,317.90 USDT, my Support level was at 4184.77 USDT, and my Stop Loss level was at 4409.90 USDT.
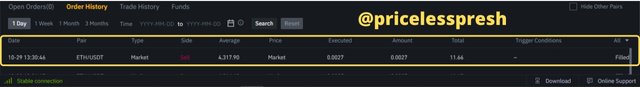
This is the confirmation of the Sell Market Position. The position was Filled, that is, it was executed at the market price.
Conclusion
The TD Sequential indicator is very spectacular. It is one of the very few indicators that are precise and give good signals. While doing research on the indicator I found out that Thomas Demark developed the indicator in the '70s through the trial and error process. That is, he did it by hand at a time when computers weren't widespread.
Another thing of note is that the indicator which was developed more than 30 years ago to analyze the price data of assets on a daily timeframe, can be used to analyze any type of market and on any timeframe.
CC:
@reddileep