Crypto Trading with Price Action - Crypto Academy / S6W2- Homework Post for @reminiscence01

Hello Steemians, welcome once again to my homework post for this week, the second week in the Season 6 of Steemit Crypto Academy. This is a homework post for @reminiscence01 on “Crypto Trading with Price Action”

1 . Explain your understanding of price action.
In understanding price action, we need to note that investors and treaders often perform different market analysis for an asset before making any trading decision. The different market analysis performed by traders and investors in a market are of 3 major types and they includes; Technical analysis, Fundamental analysis and Sentimental analysis. These analysis are used by traders in the finance market to identify and predict future price trends.
Fundamental analysis is used mainly by long-term traders as it cannot be used to identify price trends. Fundamental analysis does not show vital price data needed for traders to identify price trends which guide them in taking of trading decisions.
Price action is the movement of an asset price over a period of time. Price action is what forms the foundation for technical analysis of an asset in the market. Short-term traders depends totally on price action, through which trends are identified which help traders make good trading decision.
Technical analysis is derived from price action since it depends on past price actions in the calculation and identification of present and future trends which are used to make trading decisions.
Technical analysis makes use to charts and other technical tools in a chart to interpret and identify price action at any point in time. In trying to identify price action, traders uses different types of charts that best suits their ability of spotting and interpretation of trends, and price reversals. For example, some traders uses the candlestick chart because it is known as the chart type that help visualize better the price trend by showing more market data such as the low, high, open and close values.
Price action traders also make use of other tools on a chart such as chart patterns, market structure, volume, support and resistance levels etc to determine and identify the price movement of an asset. In the identification of price action, previous price data are used as it is believed that trends repeat themselves in the future.
Price action is very important to price action traders as it help traders identify the direction of the price movement thereby helping them to spot possible buying and selling positions.
2. What is the importance of price action? Will, you chose any other form of technical analysis apart from price action? Give reasons for your answer.
Identification of price trend
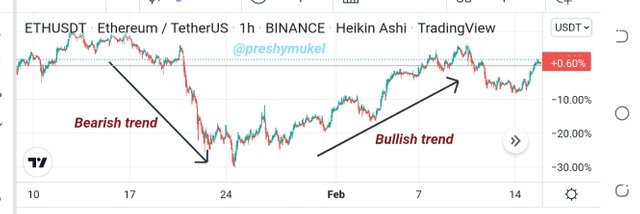
Price action help traders to identify the price movement and understand the structure of the market thereby giving traders a guide when taking trading decisions. With price action a trader can know if the price trend is an uptrend or a downtrend which will then guide them on which trade position to take. An uptrend is observed when the movement is ascending i.e moving from lower to higher price level, while a downtrend is observed when the price moves in a descending pattern i.e moving from a higher to a lower price level.
In the identification of trends, price action makes use of technical tools and indicators such as charts, market structure, support and resistance levels etc.
Price trends identification
Price action shows the psychological and emotional behavior of traders
Price action helps interpret the behavior of traders (buyers and sellers) i.e the emotions and physychogy of traders which are represented on the price chart with patterns. The interpretation of the emotion and psychology of traders by price action help traders to know the subsequent price action.
Spotting of trade positions
Price action plays a viral role in spotting of an entry and exit position. As mentioned in the above point, price action displays traders emotional and psychological behaviors thereby revealing what the next price action will be, at this point helping traders to spot an entry or exit point.
Price action help filter noise and get rid if false signals.
Most of the technical indicators used some times gives false signals, the price action is different and cannot be manipulated because it shows the current price trend of an asset in the market.
Also in price action multiple timeframe are used to filter noise in the market, this way trading patterns, entry and exit positions can be recognized.
Will you choose any other form of technical analysis apart from price action? Give reasons for your answer.
In conducting of analysis it is ideal to combine indicators and other technical tools inorder to get an accurate and stronger signal. The combination of indicators and signals help in the confirmation of price trends.
Therefore, I'll choose any other form of technical analysis in combination with price action, because the price action help confirm the signals of other technical indicators and tools. More over the main objective of technical analysis is the identification of price action of an asset in a market, therefore I'll say it is ideal to combine the main tool of interest with other technical tools in order to easily identify and confirm price trends in a market.
3. Explain the Japanese candlestick chart and its importance in technical analysis. Would you prefer any other technical chart apart from the candlestick chart?
A Japanese Candlestick Chart
Japanese candlesticks chart is a financial chart used to determine and identify price movement just like every other chart in the financial market. The Japanese candlesticks chart is the commonly used chart for technical analysis because it visualizes the price action of an asset and it is also easy to read.
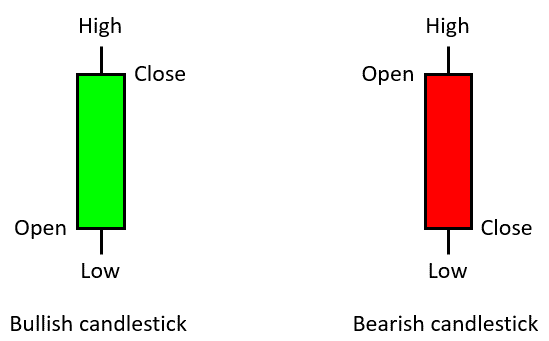
The Japanese candlesticks chart is made up of candlesticks which form the chart, and these candlesticks are of two categories, the bullish candlestick and the bearish candlestick. The bullish candlestick is represented with green color and it appears when the price of an asset is ascending (moving from a lower to a higher price level) while the bearish candlestick is represented with a red color and it is seen when the price of an asset is descending (moving a higher to a lower price level).
Anatomy of the Japanese candlestick
In understanding the anatomy of the Japanese candlestick, it should be noted that three essential things make up the Japanese candlestick and they includes;
The Body: The body of the candlestick contains the open and close of a market.
The Color: The color of a candlestick is used to identify the trend of a market. Green color candlestick represents a bullish trend, and a red color candlestick represent a bearish trend.
The Wick: The wick is also known as the shadow, It contains the low and high of an asset market price.
.png)
Example of a bullish and bearish Candlestick Source
Importance of Japanese candlestick chart in technical analysis.
The candlestick is widely used based on it's importance to traders in technical analysis, the Japanese candlestick chart shows more price data such as the opening and closing prices, and also the market lowest and highest point, price trends. These data are made very clear on the chart that it can be read on a glance unlike the traditional line chart that shows less price data which is some times hard to read.
Every of the Japanese candle on a chart is important as each and every candlestick carrys and relays a piece of information which are used to analyze the market. For instance, the color of a candle tells if the price movement at that point in time is descending or ascending.
Would you prefer any other technical chart apart from the candlestick chart?
The candlestick chart has been my choice of chart since I found myself in the finance market space and in my opinion, I'll say the candlestick chart is the best type of technical chart because with it the price movement of an asset can be identified in a glance and also for the fact that candlestick gives more price information is another thing that made it unique.
4. What do you understand by multi-timeframe analysis? State the importance of multi-timeframe analysis.
Multiple time frame analysis is a process whereby the same currency pair is viewed under different time frames. A larger time frame is basically used for long-term trading while a shorter time frame is used for short-term trading to spot entries and exit positions.
Multiple time frames are used to recognize trading patterns in a market which help give traders sufficient trading opportunities and for this reason it is used by most professional traders.
Different traders have their own different trading strategy and that applies in the multiple time frame trading, in choosing a timeframe it is best a traders chooses a timeframe that's suits his/her style and the type of trade.
For day trading a smaller timeframe is recommended, the timeframe for day trading ranges from 1 minute to 15 minutes to 1 hour. They uses the one hour timeframe to identify the overall market trend and then the 15 minutes to spot an entry or exit position.
For swing trading the recommended timeframe is 1 Day for identifying of overall trends and 4 hours timeframe for spotting of an entry and exit position.
Importance of multi-timeframe analysis
The most important reason for multiple timeframe analysis is to give traders a broader vision of the overall price trend of an asset before selecting a lower timeframe for an entry and exit point.
The price of an asset can be a bullish trend and a bearish trend at the same time which when analyzed on different time frames clears the noise and gives traders the real price trend, and this in return gives the traders confident while trading.
In multiple timeframe trading, lower time frames are used as long and short positions thereby helping to minimize trading risk for trader.
5. With the aid of a crypto chart, explain how we can get a better entry position and tight stop loss using multi-timeframe analysis. You can use any timeframe of your choice.
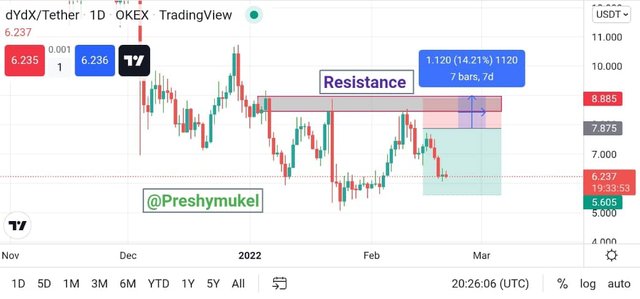
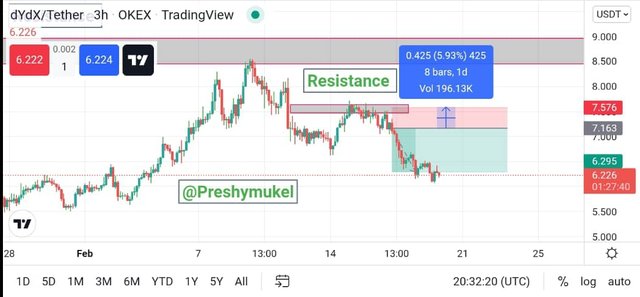
1-Day timeframe
From this 1D timeframe of the DYDX/USDT chart, I identified a resistance level which the Price has tested thrice which means it is a strong resistance that can't be broken easily. After the price tested the resistance, it pull back and continue a downward movement. Then I opened a sell position after I find a valid sell but the stop loss was much and I can't take the risk to place such a trade. Because the downtrend is still forming and no trader would like to miss this trade. So I will go down to a smaller timeframe.
3-Hours timeframe
On the 3H timeframe of DYDX/USDT, I noticed another resistance and the price was unable to break the resistance. The price action has signaled that the market is in a downtrend. Then I opened a sell order but the stop loss is still much. So, I will go down to a smaller timeframe to get a better entry with tight stop loss.
15-Minutes timeframe
The chart above is a 15M timeframe of DYDX/USDT. Here, there is a strong resistance where price has tested but was unable to breakthrough. As such, I saw a better entry with a tight stop loss of 1.98% compared to the 1D 14.41%. The trade was executed after the valid sell with a smaller stop loss. So, I obtained a better entry with a tight stop loss on the 15mins timeframe.
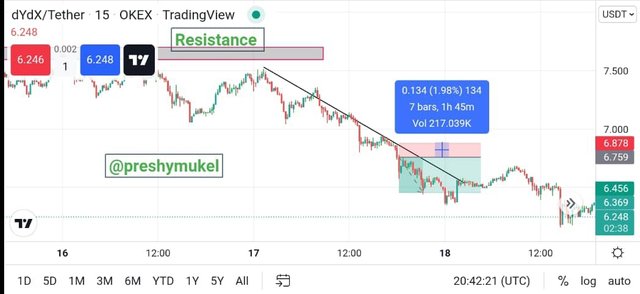
The above shows the importance of multi-timeframe, as such, for a trader to get a better stop loss multi-time frames analysis is recommended.
6. Carry out a multi-timeframe analysis on any crypto pair identifying support and resistance levels. Execute a buy or sell order using any demo account. (Explain your entry and exit strategies. Also, show proof of transaction).
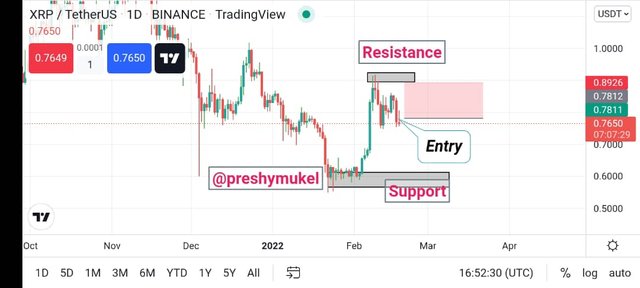
Using 1day timeframe
Looking at the 1day timeframe, we can observe the resistance level and support level. However, the market was in an uptrend before the bearish hammer candle emerged indicating a possible downtrend. As such I find a possible sell entry but the stop loss was high.
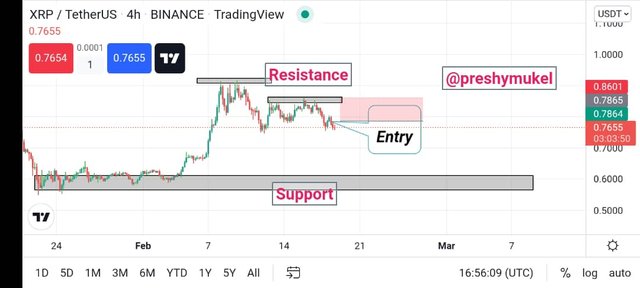
Using 4H timeframe
At the 4H timeframe, there was a clear downtrend and the resistance is not broken. As such, I identified a possible sell entry and the stop loss was not tight which will make me proceed to a shorter timeframe.
Using 1H timeframe
At the 1H timeframe, the resistance is not also broken and the price action is still indicating a downtrend, a possible sell entry was found but with a stop loss of 6.53% which is very big. So lets check another shorter timeframe to obtain a better stop loss.
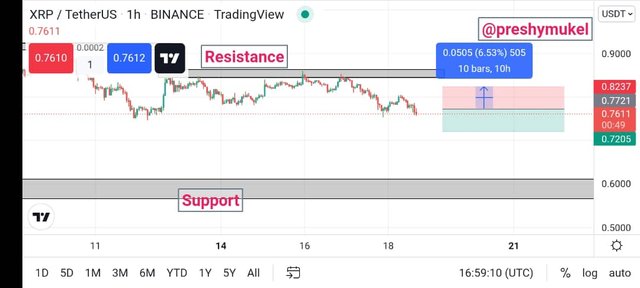
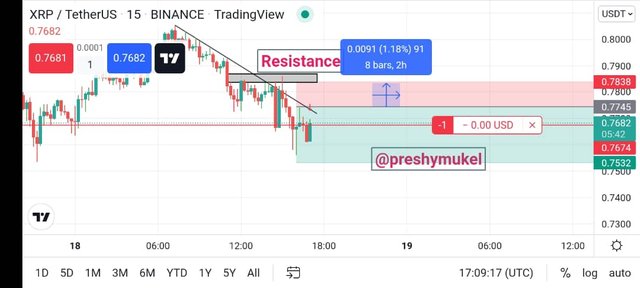
Using 15Mins timeframe
Here on the 15Mins timeframe, the resistance is still strong and the market is still on a downtrend. I can see a better entry with a tight stop loss of 1.18%. Meaning the stop loss of 6.53% of the 1H timeframe has changed to 1.18% in the 15Mins timeframe, this is a preferable stop loss. I therefore went ahead to place the sell order.
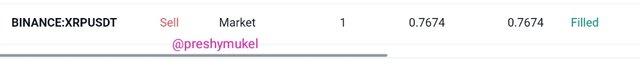
The sell order history
Conclusion
Price action is an important tool for technical analysis as it help traders to understand the price movement of an asset thereby making it possible for good trading decisions to be made.
Price action apart from giving information about the price movement of an asset, it also gives other important information about a market such as the emotional and psychological behavior of traders in the market, support and resistance levels, etc
The Japanese candlestick chart is a technical analysis tool used to determine price movement and it is widely used by traders. Japanese candlestick chart help visualize price action of an asset and it can easily be read by traders.
Thanks @reminiscence01 for this impactful lecture
NOTE: All the chart screenshots I used in this homework post are my personal charts from TradingView.com