Crypto Trading with Moving Average ]-Steemit Crypto Academy | S6W2 | Homework Post for @shemul21

Hello Steemians.......... Welcome to the Week 2 of the season 6 edition of Steemit Crypto Academy. Welcome to my post for @shemul21 on “Crypto Trading with Moving Average”.

1. Explain Your Understanding of Moving Average.
Moving average (MA) is an indicator used in the finance market during technical analysis. It is used to examine price data over a period of time which is then used to identify price trends and entry and exit positions.
The stock market is volatile, changing from one price trend to another, and the prices of stocks moves in accordance with the trend at any given time. Predicting of these trends in a market tends to be difficult, but the use of technical indicators and tools can help in the prediction of trends. Moving average plays a key role in identifying of these trends and reversals thereby helping traders know the state of the market and be able to spot long and short positions.
A rising MA indicates that the trend of an asset is bullish and a falling MA indicates a bearish trend.
Moving average (MA) is the most popular and effective indicator used by traders for technical analysis.
Moving average is usually used to calculate the data point of a asset in the market and this is done by creating series of average prices of a given period of time. The MA is calculated inorder to aid smoothing of the price data by constantly creating average data update. The MA is also used to determine resistance and support levels in a market.
Moving average indicator is an indicator that can be customized by users, and this gives room for traders and investors to choose a preferable time period when calculating the MA. Shorter MA time periods are used for short-term trading while longer MA time periods are used for long-term trading.
The commonest time periods used during MA calculations are; 15-days, 20-days, 30-days, 50-days, 100-days, and 200-days. The 50-days and 200-days time periods are the mostly used by treaders when calculating MA.
Traders and investor uses different MA time period which works best for them as there are no perfect time period for setting of MA.
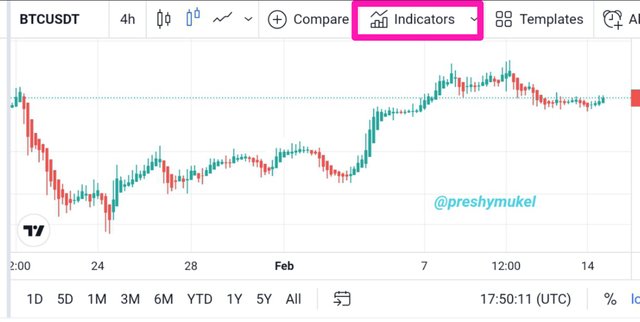
How to add and customize the MA indicator on a chart
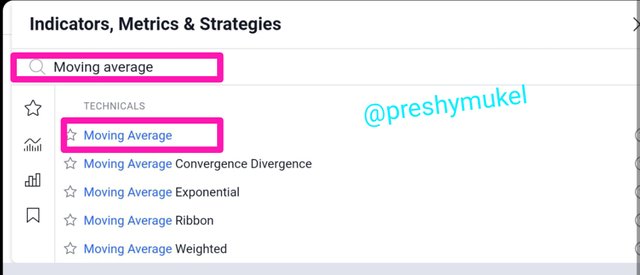
We can add the MA indicator on a chart by clicking on indicator. Then on the indicator search bar, type Moving average. The moving average indicator will appear, click on it to add it to the chart.
Process of adding a MA to chart
Process of adding MA to a chart
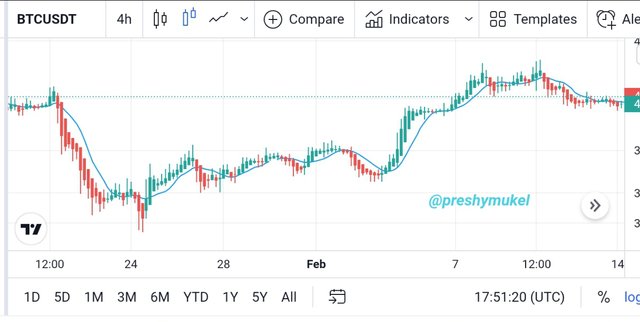
Moving average indicator on a chart
Now the MA has been added to the chart, we can now customize the MA settings such as the MA length and color of our choice.
Tap on the MA line on the chart to open the settings, then input the length of your choice and also select the color of ur choice.
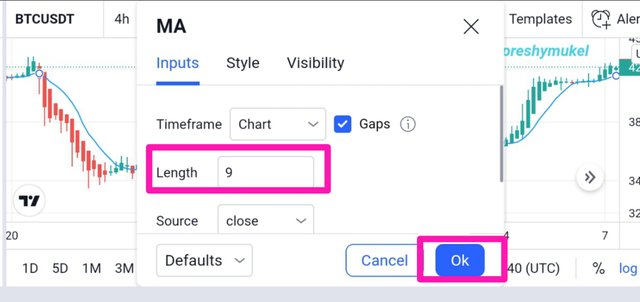
MA length setting
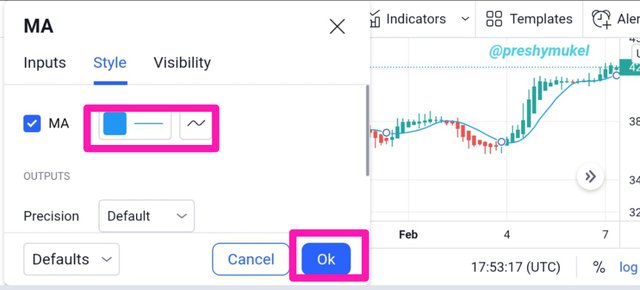
MA color setting
2. What Are The Different Types of Moving Average? Differentiate Between Them.
There are 3 main types of Moving Average, they are:
1. Simple Moving Average (SMA) indicator
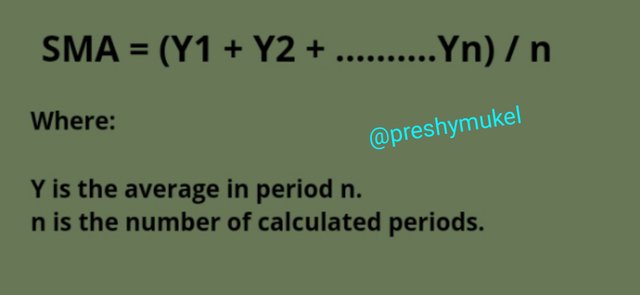
The SMA indicator is the simplest among the other types of moving average. It is an indicator that is gotten by adding up the recent data points in a specific period of time and dividing the total sum by the periods number.
SMA is used to identify price trends and to generate signals for exit and entry positions in a market. The SMA can be used to calculate different prices such as low, high, open and close using the period’s previous price data.
SMA mathematically is calculated as;
Edited in Canva
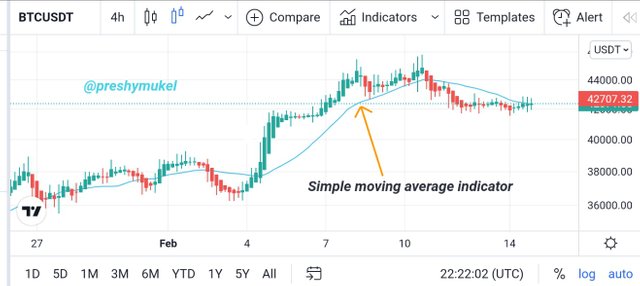
Simple moving average indicator on a chart
2. Weighted Moving Average indicator
The weighted moving average is a moving average that concentrates more on the current price points than the previous. It gives more weight to the most current data point.
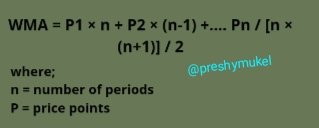
WMA is calculated by multiplying all the closing points within a selected series, by a weighted coefficient.
WMA is calculated mathematically as:
Edited in Canva
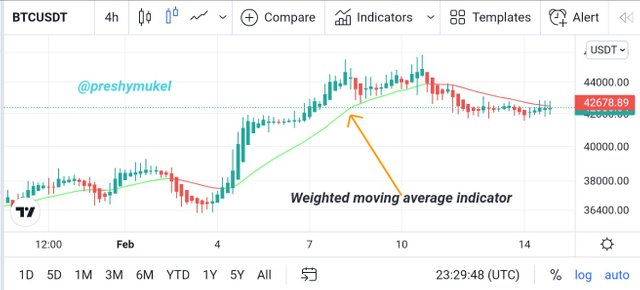
Weighted moving average indicator on a chart
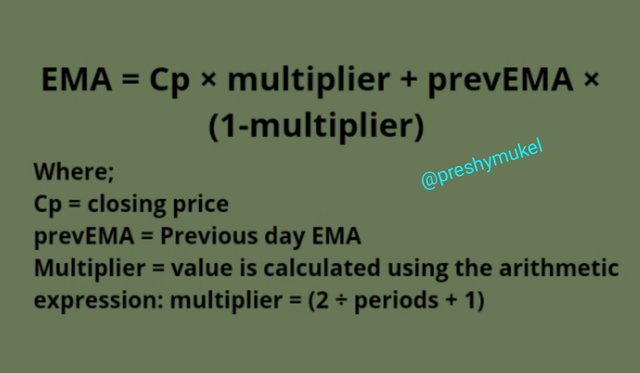
3. Exponential Moving Average (EMA) indicator
EMA indicator function for the tracing of price trends also just as the SMA indicator. The EMA gives more weight to recent price data and as such can be used for short-term trading, the EMA shows less of historical data. The EMA is considered to be accurate with price predictions of sudden price changes because it gives more weight to current price data.
EMA is calculated by adding up a specific part of the recent closing price to the previous data of the MA
EMA is calculated mathematically as:
Edited in Canva
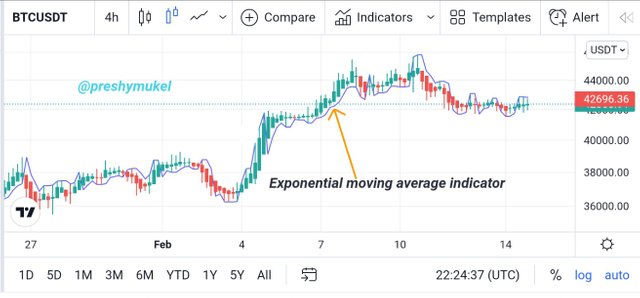
EMA indicator on a chart
Differences between SMA, WMS and EMA indicators
| SMA Indicator | WMS Indicator | EMA Indicator |
|---|---|---|
| SMA is preferably used for long-term trading | WMS is suitable for short-term trading | EMA is also suitable for short-term trading. |
| SMA gives equal weight to both previous and current data points | WMA give more weight to current data points than previous | EMA also gives current data points more weights than previous data points. |
| SMA with a longer period of length is more suitable | Both higher and lower lengths are suitable for WMA | Lower length period of EMA is more suitable. |
3. Identify Entry and Exit Points Using Moving Average. (Demonstrate with Screenshots)
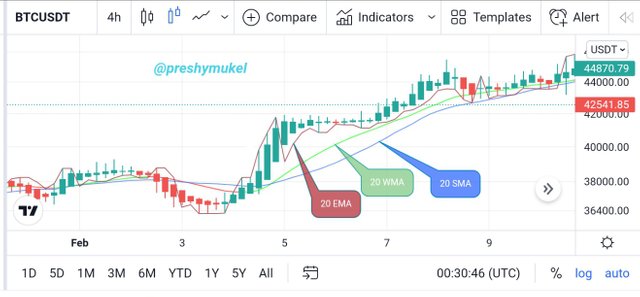
A chart consisting of 20-days of EMA, WMA and SMA
From the above chart I added a 20-days EMA, 20-days WMA and 20-days SMA on the chart. It can be observed from the chart that all the three indicators indicates that the price is on a bullish trend.
It can also be observed that the 20-days EMA is closer to the price, then the 20-days WMA and lastly the 20-days SMA. These MA indicators can be used to spot an entry and exit point on the chart.
Entry position
In answering this question I'll use the Exponential Moving Average (EMA) and the Simple Moving Average (SMA).
I'll be using 10-days EMA and 50-days SMA in trying to spot an entry position. When the EMA and SMA moves below the price of an asset, it indicates an uptrend and that point is considered a good entry position.
Spotting an entry point using EMA and SMA Indicators
From the chart above I was able to identify the price trend and also spot an entry position.
Exit position
In spotting an exit position, I also used 10-days EMA and 50-days SMA.
When an EMA and SMA indicators moves above the price of an asset, it indicates a bearish trend and at that spot traders are advised to exit the market by selling off their assets.
From the chart below, I was able to identify an exit position using the EMA and SMA indicators.
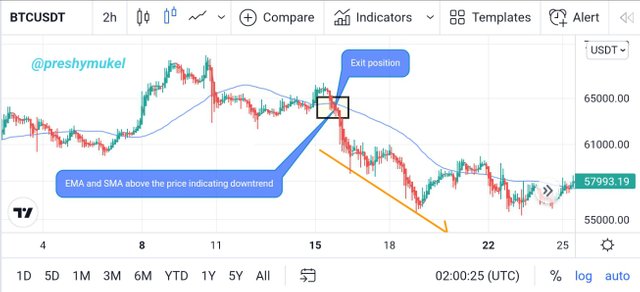
Spotting an exit point using EMA and SMA Indicators
4. What do you understand by Crossover? Explain in Your Own Words.
Moving average crossover is a method whereby two of the same type of moving average is added to a chart, each with different period lengths, a slower (long period length) and a faster (short period length) moving average.
I'll give an example of a 50-days EMA and 200-days EMA, where the 50-days EMA is faster moving average because of it's short length period and as such is closer to the current price point while the 200-days EMA is the slower moving average because of it's long length period and as such it is farther to the current price points.
Below is an example of both 50-days and 200-days EMA on a chart.
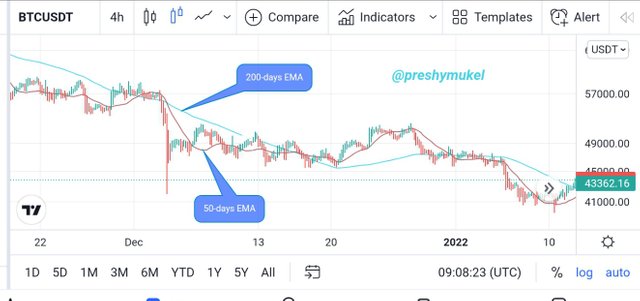
From the chart above, the green EMA is the 200-days EMS while the red EMA is the 50-days EMA. It can also be observed that the 50-days EMA is closer to the current price point than the 200-days EMA.
The moving crossover method is used to identify exit and entry positions on a chart. In using crossover method, below are some rules that can guide a trader spot an exit and entry position.
An entry position signal is observed when the short period length Exponential Moving Average goes above the long period length Exponential Moving average.
An exit position signal is gotten when the short period length Exponential Moving Average goes below the long period length Exponential Moving average.
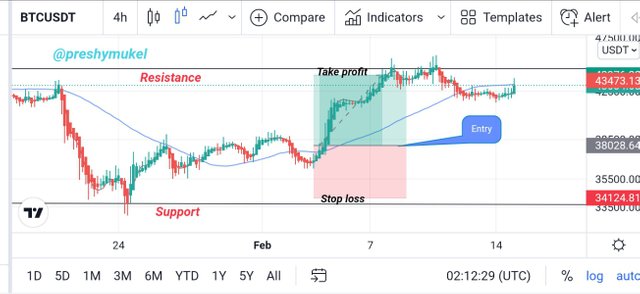
Entry position
Spotting an entry position using Moving average crossover
From the above chart, it can be seen that the 50-days EMA is above the 200-days EMA therefore indicating a bullish trend and a good position to enter the market.
I went ahead to place a buy order, setting my stop loss and take profit.
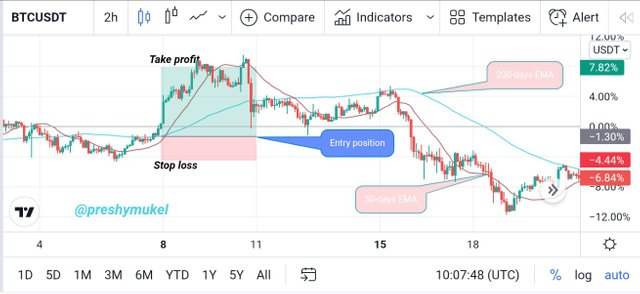
Exit position
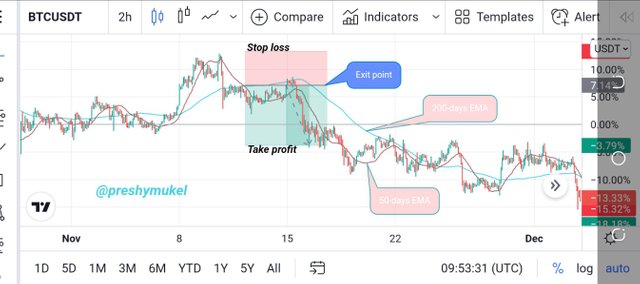
Spotting an exit position using Moving average crossover
From the chart above, we can see that the 50-days EMA is below the 200-days EMA therefore signalling a bearish trend and as such traders are ought to exit the market (sell their assets).
I was able to spot my exit position and I also set my stop loss and take profit.
5. Explain The Limitations of Moving Average.
Moving average plays an important role in identifying of trends and spotting of entry and exit positions.
Besides it advantages it has it's own limitations and these limitations includes;
In the calculation of moving average, data outside the average period are not taken into consideration.
There's no guide rules when it comes to the periods of Moving average length, therefore traders are expected to experiment moving average period lengths and choose the one that works perfectly for them. A moving average period length that works for trader A might not work for trader B, so it is good to choose a Moving Average length of your own as a trader.
Using moving average without adjusting it can lead to mistakes in forecasting of price movement.
Moving average shows signals very late, and this can lead to traders losing their assets when they don't get signals early enough to exit a market at a particular point in time.
Conclusion.
Moving average is a vital indicator used by traders in technical analysis. When using moving average indicator it is very important that traders select a moving average length period that is best suitable for them as there are no guidelines for perfect moving average lengths.
And also it is advisable that traders combine moving average with other technical tools or indicators to get a stronger and more reliable signals.
Thanks professor @shemul21 for the wonderful the lecture, it was impactful.
NOTE: All the charts I used above in the course of writing this post are my personal charts gotten from TradingView
