Crypto Trading Using Zig Zag Indicator- Crypto Academy /S6W1-Homework Post for kouba01
Show your understanding of the Zig Zag as a trading indicator and how it is calculated?
It is always important to know that trading with the trends results in a profitable trade. However, analysing the price trend requires the use of indicators as well as other technical tools. Various technical indicators have been developed to spot and forecast trend changes at an early level as well. When the trend is identified it's very easy to picture potential buy and sell signals. This is to show that the concept of spotting trends is an important element of trading since it suggests the direction of the price of an asset within a given timeframe.
Perhaps, interpreting and understanding trend movement is vital in the affairs of trading crypto assets that's only if you want to be a successful trader. However, there is a trend based technical indicator used by the traders to identify the recent trends using the highest and lowest asset price point in conjunction with diagonal lines which shows the trend is known as the zigzag indicator.
Moreover, the Zigzag indicator is specially developed to spot changes in price trends over a specific timeframe. Indicating these changes in price trends will enable traders to make trade decisions.
The Zig Zag indicator is known to create trend lines on a crypto chart. The line of the zigzag is like a retracement move and an impulsive move. Hence, this price movement limit enables traders to avoid being fooled by the market noise, small price fluctuations, which is one of the main functions of this indicator. So, a trader who understands this indicator can be able to filter out insignificant price fluctuations in any cryptocurrency as such can accurately trace the occurring price trend.
A savvy trader will be able to understand that the role of this indicator is to filter minor price movements, as such understanding enable trends easier to spot in all time frames.
Zigzag Indicator Calculation
Always remember that the zigzag indicator will use data on the highest and lowest points respectively of the market has ever reached with the time frame. However, to be able to understand this indicator, we have to focus on the previous movement into consideration in trading.
Well, this indicator calculation is based on the percentage movement of any asset price within a given timeframe. For better u understanding let's check the formula.
Zigzag = (SPHL, %change = MP, retrace = FALSE, LastExtreme = TRUE)
If %change >= MP, plot zigzag
Where;
SHL= Swing price high or low price
%change - Price movement in percentage
LastExtreme = Changing variable
The formula looks somehow complicated. Remember, I said always focus on the previous movement of this indicator. However, the zigzag indicator spot a swing point that can either high or low, based on the percentage depth of the trade set, the zigzag indicator look for price movement higher than or equal to the previous price point. Suppose the swing price point is higher, the will be a retracement move with a trend line drawn to meet the current swing point.
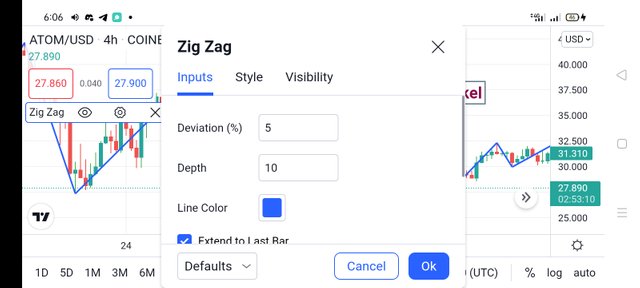
2. What are the main parameters of the Zig Zag indicator and How to configure them and is it advisable to change its default settings? (Screenshot required)
Basically, the Zig Zag Indicator is made of two major parameters, known as "Deviation" and "Depth". Through these two parameters, the zigzag can operate. Also, these two main parameters of the zigzag indicator have different functions, and the values we input determine the functionality of this indicator. Let's check out these parameters and their function.
Deviation:
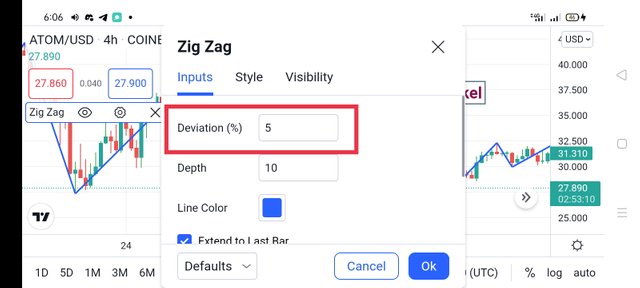
The fixed minimum percentage of a price change that has a maximum or minimum of the previous swing point (the highest or lowest price), before a new swing high or swing low will be determined is known as Deviation parameter. That's the asset price has to approach the percentage, which is used by the Zig Zag Indicator to determine a new swing point. However, by the default setting of the zigzag indicator, the deviation is presented as 5 ( meaning the asset price has to shift 5% from the past swing high or swing low for the indicator to determine a new swing high or swing low. Remember, the deviation can be adjusted from 5 to a suitable number based on the trader's choice, but there will be a significant change in the candlesticks.
Depth
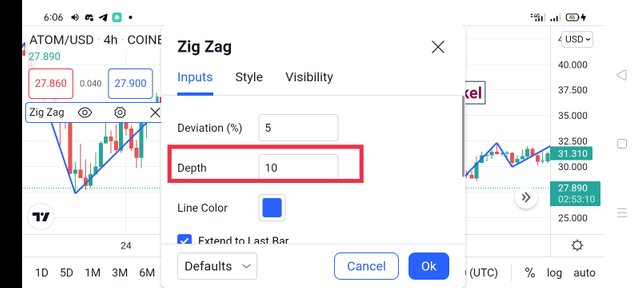
The minimum number of periods at which it will take for the zigzag indicator to create a swing price point which can be high or low is known as depth Basically, you can observe this from the candlestick distance. By default setting, the zigzag indicator depth is 10. Remember, each trader can rest the depth of this indicator from 10 to any suitable number of their choice, and this change can affect the minimum distance of the candlestick.
IMAGE SHOWING deviation as 5 and depth as 10
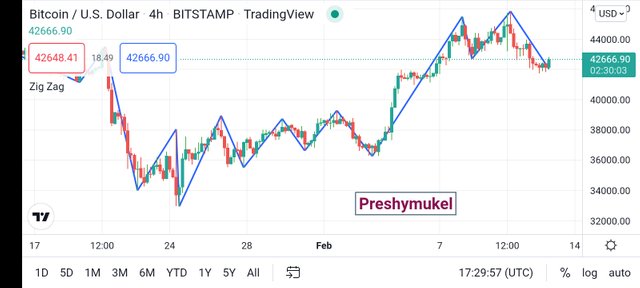
IMAGE SHOWING deviation as 2 and depth as 3
For better clarification, we have seen the nature of the chart by default settings of the Zig Zag Indicator, which has the deviation and depth value as 5% and 10 respectively. Also, the change of the deviation and the depth to 2 and 3 respectively, we can observe the nature of the chart changed as shown above.
Zigzag Indicator Configuration
I believe we have understood the two basic parameters of the indicator, so let's check the configuration of the zigzag indicator and how it can be added to any crypto chart.
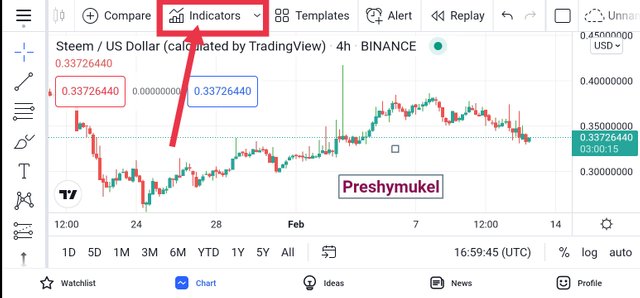
First, you have to visit your preferred crypto chart exchange platform, and here I will be using tradingview.com.. After which, I select any of the crypto pairs, then click on the indicator button.
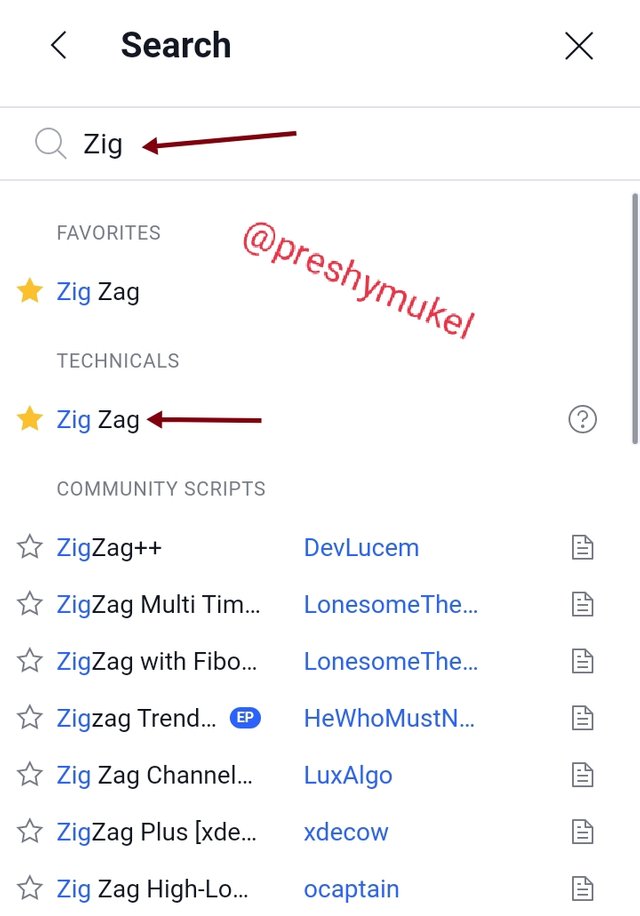
Now, on the landing page of the indicator interface, search on the indicator " zigzag", and click on it once the desired one you want appears.
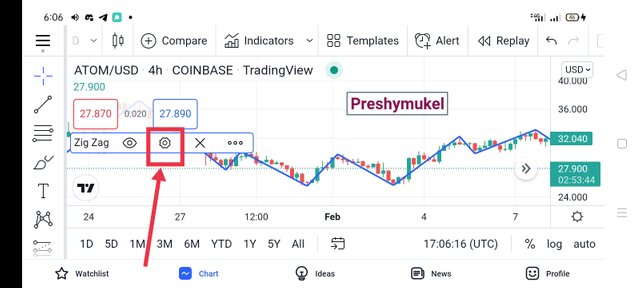
With these steps, you have added the indicator to the chart and configured it to our choice which enables us to access these parameters ( Deviation and Depth). Now, Click on the setting button as shown below.
The default setting under the input page for the parameters which is depth and deviation were 10 and 5. And under the style, we can change the desired lines and label of the indicator.
Finally, we have added and configured the Zigzag indicator
The following step by step screenshot above will clarify us better. However, we can see the images above arranged step by step. Once, we have achieved these steps, the Zigzag indicator is configured and added to any of the crypto charts.
Is it advisable to change its default settings?
Yes,
Every trader has its trading strategy, though what matter is the success rate of the trades. So, it is only advisable to change the parameters (depth 10 and deviation 5) of the Zigzag indicator of your choice only if the default parameters setting is not suitable for your trading strategy.
Well, adjusting the parameters might affect the indicator which might also make the indicator too sensitive or insensitive to react with the price movement. Thus, it lies in the hands of a trader to ensure of the changes being made on the indicator do not lead to errors that might cause a poor rate of trades.
3. Based on the use of the Zig Zag indicator, how can one predict whether the trend will be bullish or bearish and determine the buy/sell points (screenshot required)
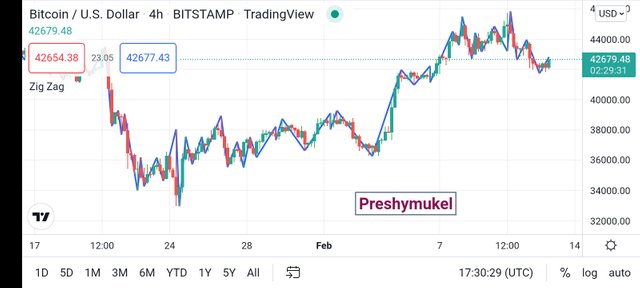
Identifying trend using the Zigzag Indicator is simple. Here, the Zigzag indicator as known uses the diagonal lines drawn to join two swings high and swing low which is used to scan for the next swing high or swing low as such forms a Zigzag pattern structure on the crypto chart. From the chart below, we can see the patterns formed by the indicator as such can be used to spot or forecast trends direction.
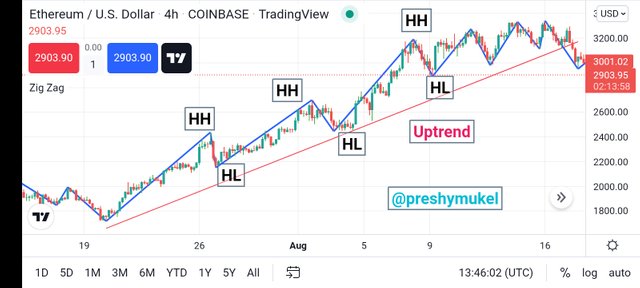
Bullish Trend
To identify a bullish trend, the Zigzag indicator will draw a diagonal line that will join swing points with consistently higher highs and higher lows. Once we observe these consistent higher highs and higher lows on any crypto chart when using the zigzag indicator, it means the market is observing a trend called a bullish trend. Always take note that the bullish trend is associated with the formation of higher highs and higher lows.
IMAGE SHOWING BULLISH TREND USING ZIGZAG INDICATOR
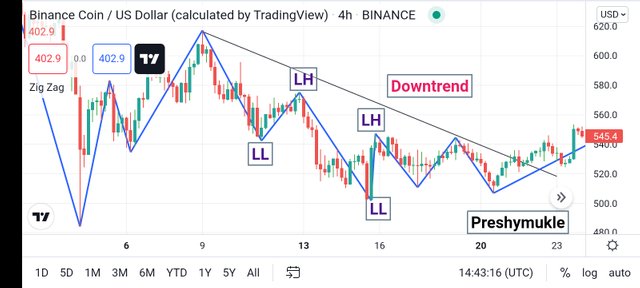
Bearish Trend
To identify a bearish trend, the Zigzag indicator will draw a diagonal line that will join swing points with consistently lower highs and lower lows. Once we observe these consistent lower highs and lower lows on any crypto chart when using the zigzag indicator, it means the market is observing a trend called a bearish trend. Always take note that the bearish trend is associated with the formation of lower highs and lower lows.
IMAGE SHOWING BEARISH TREND USING ZIGZAG INDICATOR
Identifying Buy and Sell Points Using the Zigzag Indicator
Identifying buy and sell points can be observed using the zigzag indicator only when the indicator is on a strong trend which can be bullish or bearish, then buy and sell points will be seen. The primary function of the zigzag indicator to traders is that it's filtered market noise by avoiding minor price fluctuations or movements. Let's check it out.
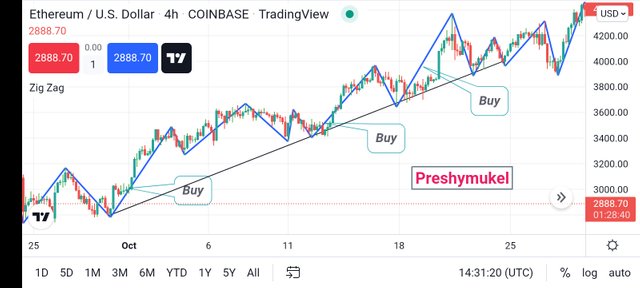
Buy Point
Buy is always associated with the formation of a strong bullish trend. So, a buy point can be observed on any of the crypto charts using the zigzag indicator when the market within a timeframe is observing a strong bullish trend as such forming consistent higher highs and higher lows. Once, we observe this strong bullish trend, then a buy point can be identified, and the entry should be after a new swing low and take profit and stop-loss can be placed above the higher highs and below the swing lows respectively.
IMAGE SHOWING BUY POINTS USING ZIGZAG INDICATOR
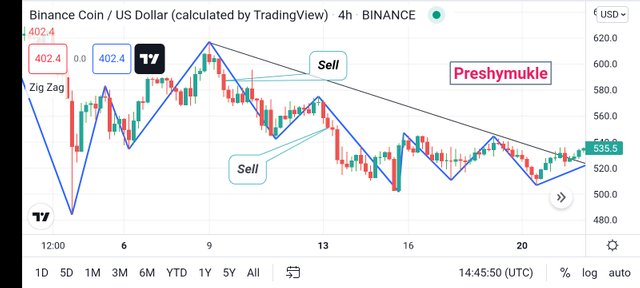
Sell Point
Also, sell is always associated with the formation of a strong bearish trend. So, a selling point can be detected on any of the crypto charts using the zigzag indicator when the market within a timeframe is detecting a strong bearish trend as such forming consistent lower highs and lower lows. Thus, once, we observe this strong bearish trend, then a selling point can be identified, and the entry should be after a new swing high and take profit and stop-loss can be placed below the lower lows and above the swing highs respectively.
IMAGE SHOWING SELL POINTS USING ZIGZAG INDICATOR
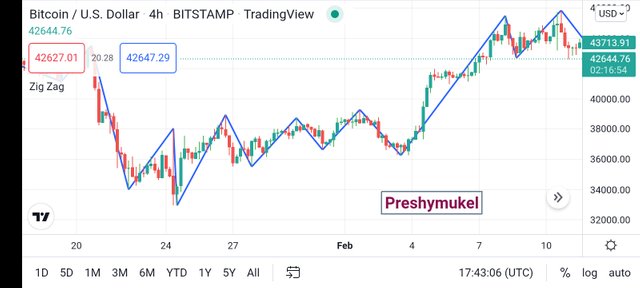
4. Explain how the Zig Zag indicator is also used to understand support/resistance levels, by analyzing its different movements.(screenshot required)
Not only to identify trend direction in the market the Zig Zag Indicator does but it can also be used to observe Resistance levels and Support Levels. These two levels are important upper zones(Resistance) and lower zones (Support) that some traders trade. These two levels are formed mostly in the range market where the asset price test multiple times as such producing strong trade signals.
The zigzag indicator line joins previous swing highs and swing lows on the chart. So, we will identify Support and Resistance levels using the Zig Zag Indicator by forming limits for the two levels. The lower limits are the support levels and the upper limit is the resistance levels. When the zigzag indicator has tested multiple times in the upper limit (swing highs) in the same levels, it's referred to as a Resistance level. Similarly, when the zigzag indicator has respected multiple times in the lower limit (swing lows) in the same level, it's known as a support level.
For better understanding, let's check out the screenshot showing the Support and Resistance levels.
IMAGE SHOWING SUPPORT AND RESISTANCE USING ZIGZAG INDICATOR
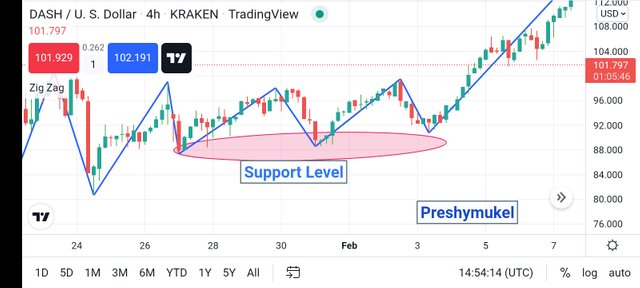
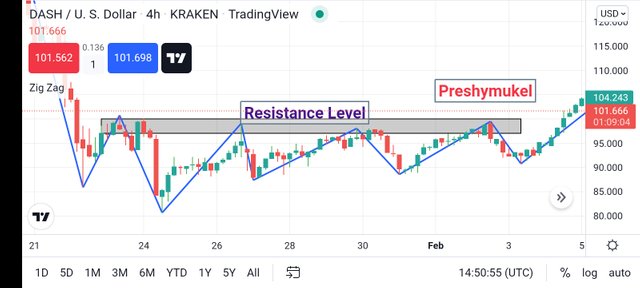
From the image above, the Support level is spotted at the lower limit of the charts, as a result of multiple swing lows formed in the same level. Also, the Resistance level is identified at the upper limit of the chart, as a result of multiple swing highs formed in the same level.
5. How can we determine different points using Zig Zag and CCI indicators in Intraday Trading Strategy? Explain this based on a clear example. (Screenshot required)
I believe we have understood the basic principle of using the Zig Zag Indicator to identify support and resistance levels, but it is a deal to know that we do not use the indicator to forecast trend reversal. However, we can use the zigzag indicator to trade Intraday trading since we can identify buy and sell points as well as support and resistance levels.
Intraday trading doesn't need a premature trend instead it requires a strong trend that has already formed. Hence, it doesn't require a shorter timeframe as well but a longer one. However, it is always said that using one indicator like zigzag as a standalone trading analysis tool is not advisable. So, we will be combining the zigzag and the CCI indicator in this section of the question.
First, the CCI in full is known as Commodity Channel Index indicator, which is very helpful to traders for receiving signals about a market condition (oversold and overbought) over a specific period. The CCI does this by using a line that will shift between the upper limit level(+100) and the lower limit level (-100). However, the range of +100 is for the overbought level and -100 is for the oversold level.
Moreover, the basic principle of the CCI indicator is that when the line touches and whipsaw above the upper limit or below the lower limit, the market conditions at that timeframe is overbought and oversold.
Let's combine the Zigzag indicator and the CCI indicator to obtain trade signals. Note when the zigzag indicator breaks from previous levels and the CCI indicator shows related trade signals by either the crossing over of the upper limit(overbought) or lower limit (oversold levels).
Buy Signal
A buy signal using the zigzag and CCI indicator can be obtained when the zigzag indicator line breaks above the previous swing highs which can also be called the resistance level, and the CCI indicator line is above the +100 level which indicates that market conditions at that specific time are in an oversold level.
IMAGE SHOWING BUY SIGNAL USING ZIGZAG AND ICC INDICATOR TOGETHER
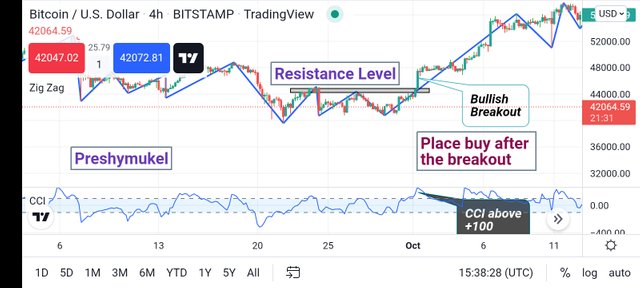
From the screenshot of the crypto chart above, the zigzag indicator has passed past the previous swing high, and the CCI indicator crosses above the +100 level.
Sell Signal
A sell signal using the zigzag and CCI indicator together can be obtained when the zigzag indicator line breaks below the previous swing lows which can also be called the support level, and the CCI indicator line is below the -100 level which indicates that market conditions at that specific time are in an overbought level.
IMAGE SHOWING SELL SIGNAL USING ZIGZAG AND ICC INDICATOR TOGETHER
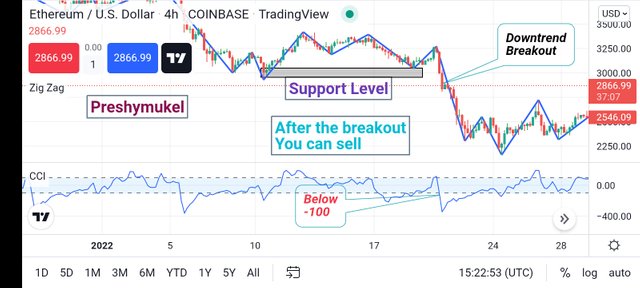
From the screenshot of the crypto chart above, the zigzag indicator has passed past the previous swing low, and the CCI indicator crosses below the -100 level.
6. Is there a need to pair another indicator to make this indicator work better as a filter and help get rid of false signals? Give more than one example (indicator) to support your answer. (screenshot required)
For a successful trade, it is ideal not to use any indicator such as zigzag as a standalone indicator to anticipate trend reversal or obtain trade signals. Using the zigzag indicator with other indicators makes filtering of market noise or false signals easier.
Zigzag and RSI Indicator Pairing
The Relative Strength Index (RSI) indicator is one of the best oscillation-based indicators traders often use. It is basically used to know the proportion of the market as well as to identify the present conditions of the market if it's in the phase of oversold or overbought levels. Nonetheless, RSI locates overbought and oversold areas by moving up and down within a range of 0 to 100, with 0 interpreting oversold areas while 100 interpreting overbought areas.
It is advisable when the price whipsaw below the 30 RSI level, it signals that the current market is in an oversold condition. As such you can expect a possible bullish reversal signal. Similarly, when the RSI whipsaw above the 70 RSI level implies that the current market is in an overbought condition and except a possible bearish reversal signal.
To combine these two pairs of indicators (zigzag and RSI), a breakout strategy is obtained. Remember, it can be a bullish or bearish breakout. That's the break will close the previous resistance or support in correspondence with the RSI indicator being above 70 or below 30 respectively.
IMAGE SHOWING Zigzag and RSI Indicator Pairing
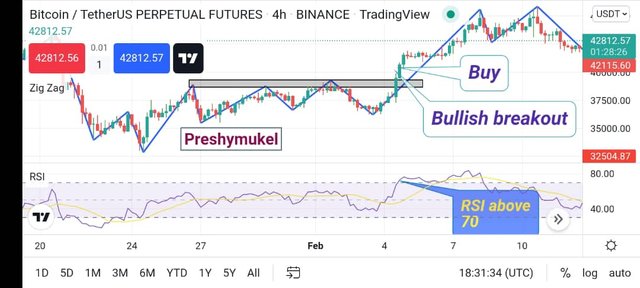
Looking at the crypto chart above, the asset price close above the resistance (breakout) with the RSI moving above the 70 level, which indicates a buy signal since it's a bullish breakout. The buy entry should be after the breakout, stop loss and the take profit should be below and above the swing points.
Zigzag and EMA Indicator Pairing
Here, I will combine the Zig Zag Indicator and the EMA Indicator. The EMA with lengths of 50 and 200 will be used to obtain buy or sell signal resulting to a change in the trend direction where the signal will be generated when the two EMA lines (50 & 200) will cross each other.
A buy signal will be observed when the EMA 50 crosses above the EMA 200 and both EMA move below the price. Similarly, a sell signal is observed when the EMA 50 crosses above the EMA 200 and both EMA move above price. Let's check out the crypto chart below for a better understanding.
IMAGE SHOWING Zigzag and EMA Indicator Pairing
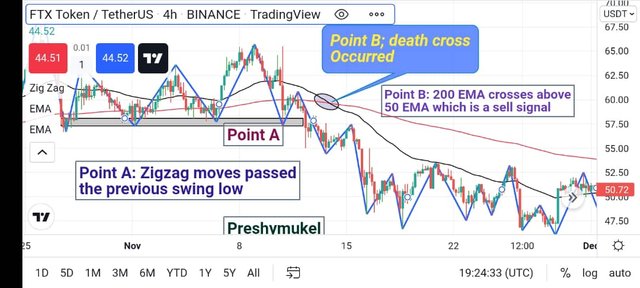
Looking at the chart, the crossover took place when the 50 EMA line begins above the 200 EMA line which signals a transition of downtrend as such, potential selling position can be seen. The two EMA move above the price, which later cause a breakout with the previous swing point called the support level. The Zigzag Indicator confirms the signal by move passing the previous swing low ( supports levels). Moreover, he Zigzag indicator move occurred after the two EMA lines crosses each other called a death cross, which was a confirmation provided by the Zigzag indicator to the downtrend signal.
7. List the advantages and disadvantages of the Zig Zag indicator:
The zigzag indicator has the good aspect as well as the bad aspect when using it. So let's check them out.
Advantages Of The Zigzag Indicator
It has a very simple nature whereby it won't be complicated to understand by a novice. Meaning this indicator can not only be hard to understand and the savvy and a novice can interpret and understand it as a result of its simple like nature.
The zigzag indicators as seen in this lesson has demonstrated to indicate signals of changes in trend direction that exist in the market, as such, it is good for traders since it provides a clearer image of the market trends.
The zigzag indicator is very helpful to identify trends and avoid minor price fluctuations and filter market noise.
It is can be used as a means of confirmation of trend direction when using other indicators since it has the capability of defining past price movement as well as filtering false signals. Though not ideal as a standalone technical analysis trading tool.
Lastly, the zigzag indicator is not limited by any timeframe unlike some other indicators, as such, it can be used for both long-term and short-term timeframes. Meaning it goes will all the preferred timeframe of the user.
Disadvantages Of The Zigzag Indicator
The Zigzag indicators has a limitation when it comes to prediction. It can't be used for predicting future trend price movements, which is a great problem. Though it only evaluates past price actions and it is ideal to use in conjunction with another indicator, as such should be used as a standalone indicator.
Another demerit of the zigzag indicator is that it often provide false signals. However, this can be encountered when a trader changes the parameters (depth and deviation) into a small value to trade on short timeframes, as such, it might be insensitive to react with the price movement.
- The zigzag has a complex configuration. A beginner who does not understand and interpret the setting of the parameters (depth and deviation) can't achieve successful trades. Meaning once the trader enters a setting that is not right it will become insensitive, as such, can't work very effectively and efficiently.
CONCLUSION
From what we have understood from this lesson, we now know that the Zig Zag indicator is an important indicator that is useful and can be used by traders, to identify and confirm trends direction. However, the zigzag indicator uses diagonal lines to join swing points (high and low) to form a pattern known as zigzag, as such, save the stress of the trader to draw trend lines at the swings highest point to swing lowest points on the chart.
Moreover, it is not ideal to use this indicator as a standalone indicator since it has some limitations such as not being able to predict trends reversals. So, to have successful trades using this indicator, we have to understand and interpret how it works and should be paired with another technical analysis tool which is a better means of helping to confirm trade signals.
Note: The screenshots were all taken from tradingview.